
이 전략의 주요 아이디어는 이동 평균의 황금 포크 사다리 포크를 구매 판매 신호로 사용하여, 가격 두 개의 평평선을 돌파하는 방법을 결합하여 포지션 및 중단을 수행하는 것입니다. 단기 평평선 상에서 장기 평평선을 돌파 할 때 구매 신호를 생성; 단기 평평선 아래에서 장기 평평선을 돌파 할 때 판매 신호를 생성합니다. 이 전략은 동시 트렌드 추적 및 역전 거래의 특징을 가지고 있습니다.
이 정책의 세부 내용은 다음과 같습니다.
단기 간단한 이동 평균과 장기 간단한 이동 평균을 계산하십시오.
가격의 이동 평균보다 높거나 낮다는 것을 비교합니다. 가격의 이동 평균 위에 다면으로, 가격의 이동 평균 아래에 공백으로 판단하는 근거로.
짧은 평균선에서 긴 평균선을 착용할 때 더 많이; 짧은 평균선 아래 긴 평균선을 착용할 때 공백을하십시오.
이 경우, 상자 상점의 빈 위치가 바뀌게 됩니다.
이 전략의 주요 장점은 다음과 같습니다.
쌍방향 전략은 트렌드 추적과 역전 거래를 결합하여 시장 추세를 추적하고 역전 기회를 잡는 것을 동시에 고려합니다.
평선형 황금 포크 사다리 장치는 일정 정도의 지속성을 가지고 있으며, 가짜 돌파구를 효과적으로 제거할 수 있다.
평균선 이론을 활용하여 트렌드 변동 중에 수익을 고정하는 데 도움이 됩니다.
이 전략의 주요 위험은 다음과 같습니다.
쌍평선 전략은 변수에 민감하며, 이동 평균 변수를 잘못 설정하면 거래 빈번하거나 기회를 놓치게 될 수 있다.
파격 실패는 손실을 초래할 수 있으며, 위험을 통제하기 위해 효율적인 손해 차단이 필요합니다.
트렌드 반전이 성공적일 수는 없지만, 기존의 트렌드를 계속하면 손실이 발생할 수 있다.
이 전략의 주요 최적화 방향은 다음과 같습니다.
이동 평균 변수를 테스트하고 최적화하여 최적의 변수 조합을 찾습니다.
트렌드를 판단하는 지표를 추가하고, 트렌드와 흔들리는 시장을 구분한다.
리스크를 통제하기 위해 효과적인 스톱을 추가합니다. 예를 들어, 스톱을 추적하고, 스톱을 올립니다.
다른 지표와 결합하여 전략의 안정성을 높여줍니다.
요약하자면, 이 전략은 양평선 역추적 전략으로서, 트렌드 추적과 역추적 거래를 고려하면서, 파라미터 최적화와 위험 통제가 있는 상태에서 더 좋은 효과를 얻을 수 있다. 그러나 모든 전략은 방향 판단 오류, 손해 중지 실패 등의 위험에 직면할 수 있으며, 시장의 변화에 적응하기 위해 지속적인 테스트와 최적화가 필요합니다.
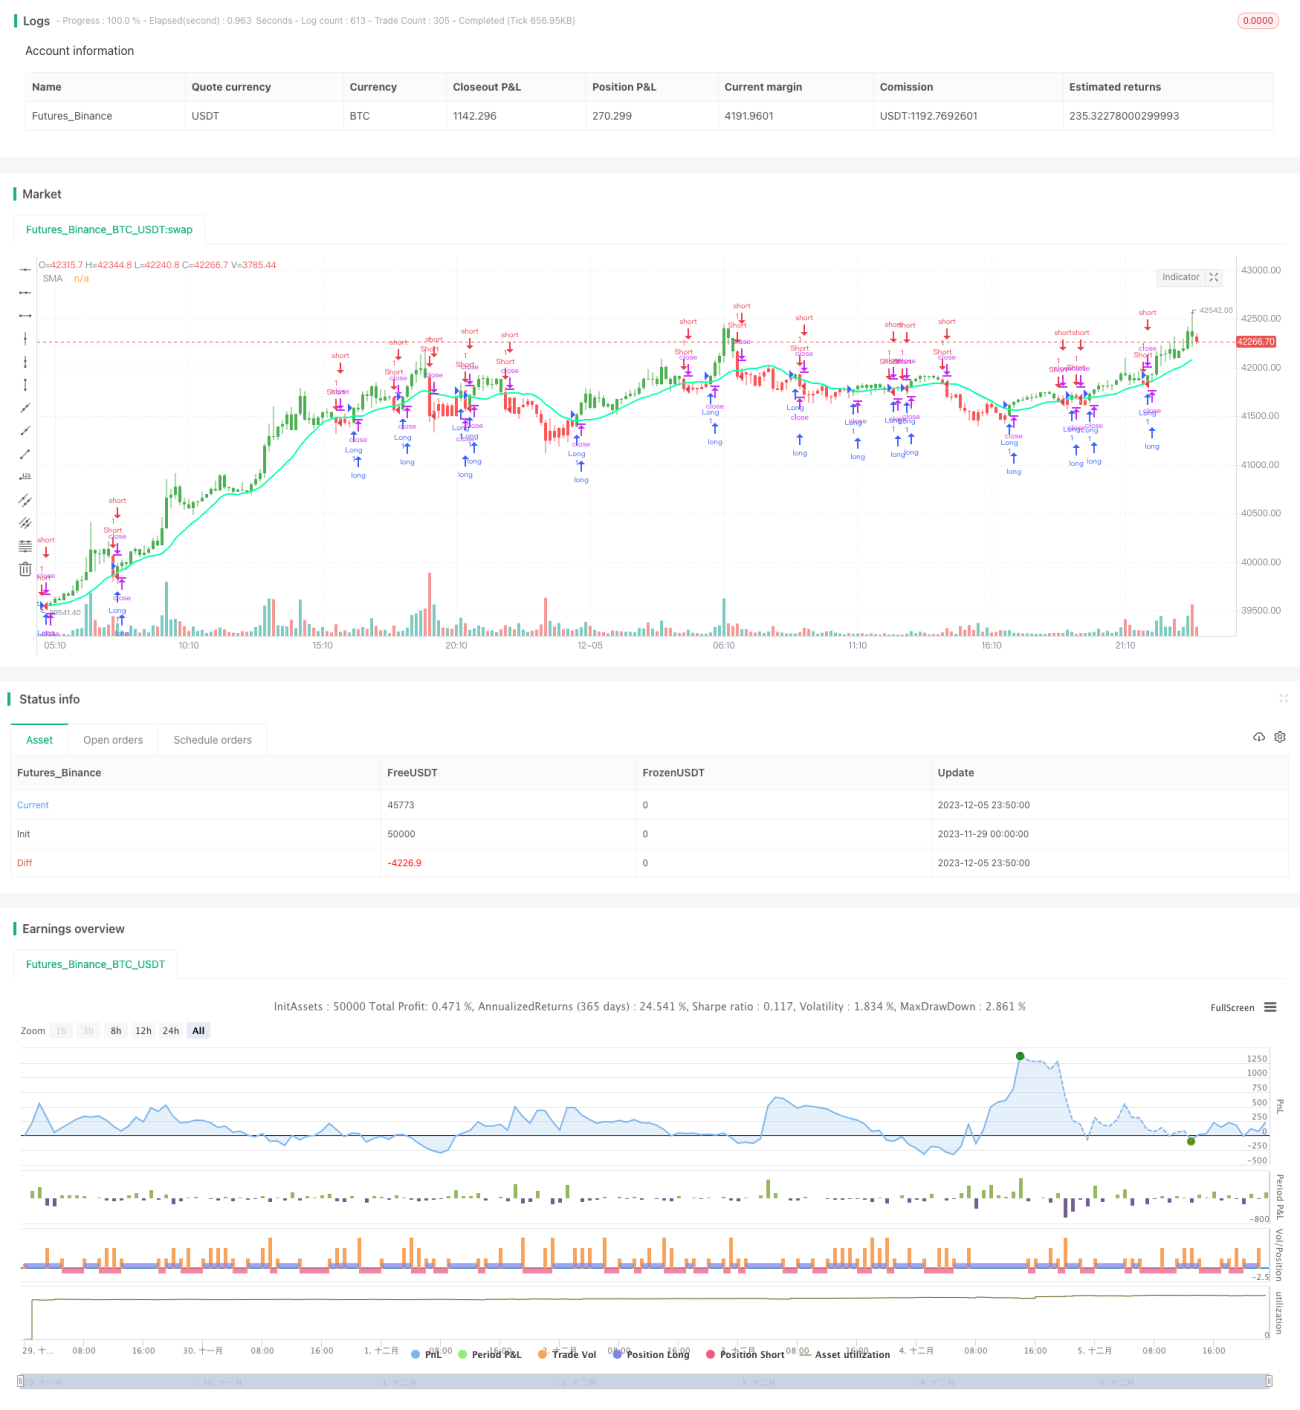
/*backtest
start: 2023-11-29 00:00:00
end: 2023-12-06 00:00:00
period: 10m
basePeriod: 1m
exchanges: [{"eid":"Futures_Binance","currency":"BTC_USDT"}]
*/
// This source code is subject to the terms of the Mozilla Public License 2.0 at https://mozilla.org/MPL/2.0/
// © HPotter
// Simple SMA strategy
//
// WARNING:
// - For purpose educate only
// - This script to change bars colors
//@version=4
strategy(title="Simple SMA Strategy Backtest", shorttitle="SMA Backtest", precision=6, overlay=true)
Resolution = input(title="Resolution", type=input.resolution, defval="D")
Source = input(title="Source", type=input.source, defval=close)
xSeries = security(syminfo.tickerid, Resolution, Source)
Length = input(title="Length", type=input.integer, defval=14, minval=2)
TriggerPrice = input(title="Trigger Price", type=input.source, defval=close)
BarColors = input(title="Painting bars", type=input.bool, defval=true)
ShowLine = input(title="Show Line", type=input.bool, defval=true)
UseAlerts = input(title="Use Alerts", type=input.bool, defval=false)
reverse = input(title="Trade Reverse", type=input.bool, defval=false)
pos = 0
xSMA = sma(xSeries, Length)
pos := iff(TriggerPrice > xSMA, 1,
iff(TriggerPrice < xSMA, -1, nz(pos[1], 0)))
nRes = ShowLine ? xSMA : na
alertcondition(UseAlerts == true and pos != pos[1] and pos == 1, title='Signal Buy', message='Strategy to change to BUY')
alertcondition(UseAlerts == true and pos != pos[1] and pos == -1, title='Signal Sell', message='Strategy to change to SELL')
alertcondition(UseAlerts == true and pos != pos[1] and pos == 0, title='FLAT', message='Strategy get out from position')
possig = iff(reverse and pos == 1, -1,
iff(reverse and pos == -1, 1, pos))
if (possig == 1)
strategy.entry("Long", strategy.long)
if (possig == -1)
strategy.entry("Short", strategy.short)
if (possig == 0)
strategy.close_all()
nColor = BarColors ? possig == -1 ? color.red : possig == 1 ? color.green : color.blue : na
barcolor(nColor)
plot(nRes, title='SMA', color=#00ffaa, linewidth=2, style=plot.style_line)