슈퍼 트렌드를 사로잡는 폭탄 전략


생성 날짜: 2023-12-08 15:40:26 마지막으로 수정됨: 2023-12-08 15:40:26
복사: 0 클릭수: 708
avatar of ChaoZhang ChaoZhang
1
집중하다
1621
수행원

슈퍼 트렌드를 사로잡는 폭탄 전략

개요

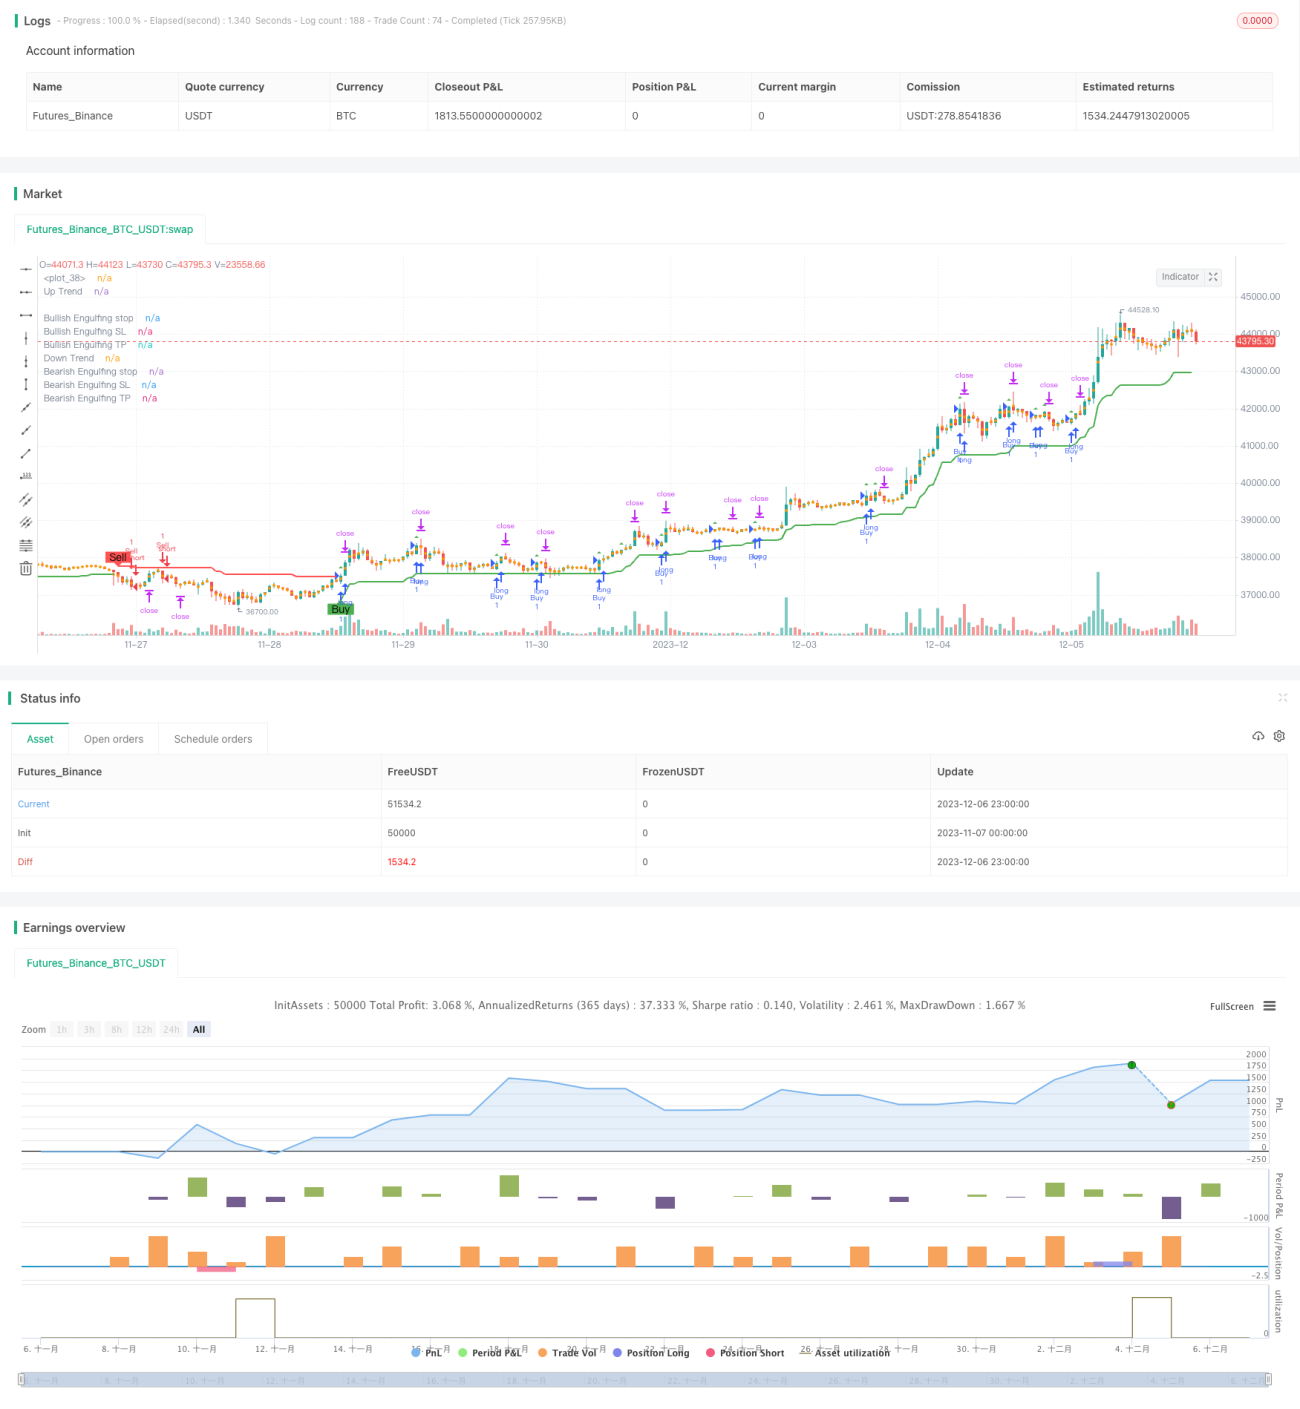
오버트렌드 삼키기 전략은 트렌드 추적 전략으로, 트렌드 방향을 식별하기 위해 평균 실제 파장 (ATR), 오버트렌드 지표 및 삼키기 형태를 결합하고, 삼키기 형태를 확인하면서 유리한 비율의 진입 기회를 찾습니다.

전략 원칙

이 전략은 먼저 ATR과 초 트렌드 지표를 사용하여 CURRENT 시장의 트렌드 방향을 판단한다. 구체적으로, 가격이 상반기보다 낮을 때 하향 트렌드로 정의되고, 가격이 하향기보다 높을 때 상승 트렌드로 정의된다.

트렌드 방향을 확인하는 동시에, 전략은 K 라인이 포식 형태를 형성하는지 여부를 판단합니다. 코드 논리에 따르면, 상승 추세에서, 전 K 라인 종료 가격이 현재 K 라인 개시 가격보다 높고 현재 K 라인 종료 가격이 개시 가격보다 낮으면 다중 포식; 하향 추세에서, 전 K 라인 종료 가격이 현재 K 라인 개시 가격보다 낮고 현재 K 라인 종료 가격이 개시 가격보다 높으면 허공 포식.

포식 형태와 트렌드 방향이 일치할 때 거래 신호가 생성된다. 또한, 전략은 포식 형태를 기반으로 중지 가격과 중지 가격을 계산한다. 진입 후, 가격이 중지 가격이나 중지 가격에 닿으면 현재 위치에서 빠져 나간다.

우위 분석

이 전략은 트렌드 추적과 형태 인식의 장점을 결합하여 트렌드 상황의 반전 신호를 식별하여 시장 전환점에서 더 큰 상황을 잡을 수 있습니다. 또한, 스톱 손실 메커니즘은 손실 위험을 효과적으로 제어 할 수 있습니다.

위험 분석

이 전략의 가장 큰 위험은 삼키기 형태가 거짓된 파열이 될 수 있다는 점이며, 이로 인해 잘못된 신호가 발생한다. 또한, 스톱 및 스톱 설정이 너무 무단으로 이루어져 수익/손실 균형을 이루지 못하게 될 수도 있다. 파라미터 조합을 최적화하고 스톱 위치를 적절히 조정하는 것이 좋습니다.

최적화 방향

실시간으로 ATR의 매개 변수를 최적화하여 시장의 변동성을 더 잘 포착 할 수 있습니다. 또한, 다른 지표의 동향을 연구하여 전략의 안정성을 더욱 향상시킬 수 있습니다.

요약하다

트렌드 포식 전략은 트렌드 추적과 형태 인식의 장점을 통합하여 트렌드 포식 형태를 역전 신호로 전략하여 시장 전환점에서 높은 효과를 얻을 수 있습니다. 그러나 이 전략에는 특정 잘못된 신호 위험이 있으며 위험을 제어하기 위해 추가 테스트 및 최적화가 필요합니다.

전략 소스 코드
/*backtest
start: 2023-11-07 00:00:00
end: 2023-12-07 00:00:00
period: 1h
basePeriod: 15m
exchanges: [{"eid":"Futures_Binance","currency":"BTC_USDT"}]
*/

// This source code is subject to the terms of the Mozilla Public License 2.0 at https://mozilla.org/MPL/2.0/
// © Armanhammer

//@version=5
strategy("Engulfing with Trend", overlay=true)

Periods = input.int(title="ATR Period", defval=10)
src = input(hl2, title="Source")
Multiplier = input.float(title="ATR Multiplier", step=0.1, defval=3.0)
changeATR= input.bool(title="Change ATR Calculation Method ?", defval=true)
showsignals = input.bool(title="Show Buy/Sell Signals ?", defval=true)
highlighting = input.bool(title="Highlighter On/Off ?", defval=true)

atr2 = ta.sma(src, Periods)
atr= changeATR ? ta.atr(Periods) : atr2

up=src-(Multiplier*atr)
up1 = nz(up[1],up)
up := close[1] > up1 ? math.max(up,up1) : up
dn=src+(Multiplier*atr)
dn1 = nz(dn[1], dn)
dn := close[1] < dn1 ? math.min(dn, dn1) : dn

var trend = 1
trend := nz(trend[1], trend)
trend := trend == -1 and close > dn1 ? 1 : trend == 1 and close < up1 ? -1 : trend

upPlot = plot(trend == 1 ? up : na, title="Up Trend", style=plot.style_linebr, linewidth=2, color=color.green)
buySignal = trend == 1 and trend[1] == -1
plotshape(buySignal and showsignals ? up : na, title="Buy", style=shape.labelup, location=location.absolute, color=color.new(color.green, 0), text="Buy")
//plotshape(buySignal ? up : na, title="UpTrend Begins", location=location.absolute, style=shape.circle, size=size.tiny, color=color.green, transp=0)
//plotshape(buySignal and showsignals ? up : na, title="Buy", text="Buy", location=location.absolute, style=shape.labelup, size=size.tiny, color=color.green, textcolor=color.white, transp=0)
dnPlot = plot(trend == 1 ? na : dn, title="Down Trend", style=plot.style_linebr, linewidth=2, color=color.red)
sellSignal = trend == -1 and trend[1] == 1
plotshape(sellSignal and showsignals ? dn : na, title="Sell", style=shape.labeldown, location=location.absolute, color=color.new(color.red, 0), text="Sell")
//plotshape(sellSignal ? dn : na, title="DownTrend Begins", location=location.absolute, style=shape.circle, size=size.tiny, color=color.red, transp=0)
//plotshape(sellSignal and showsignals ? dn : na, title="Sell", text="Sell", location=location.absolute, style=shape.labeldown, size=size.tiny, color=color.red, textcolor=color.white, transp=0)
mPlot = plot(ohlc4, title="", style=plot.style_circles, linewidth=0)
longFillColor = highlighting and trend == 1 ? color.new(color.green, 0) : na
shortFillColor = highlighting and trend == -1 ? color.new(color.red, 0) : na
fill(upPlot, dnPlot, color=longFillColor)
fill(dnPlot, upPlot, color=shortFillColor)
alertcondition(buySignal, title="SuperTrend Buy", message="SuperTrend Buy!")
alertcondition(sellSignal, title="SuperTrend Sell", message="SuperTrend Sell!")
changeCond = trend != trend[1]
alertcondition(changeCond, title="SuperTrend Direction Change", message="SuperTrend has changed direction!")

// Define Downtrend and Uptrend conditions
downtrend = trend == -1
uptrend = trend == 1


// Engulfing
boringThreshold = input.float(25, title="Boring Candle Threshold (%)", minval=1, maxval=100)
engulfingThreshold = input.float(50, title="Engulfing Candle Threshold (%)", minval=1, maxval=100)
stopLevel = input.int(200, title="Stop Level (Pips)", minval=1)

// Boring Candle (Inside Bar) and Engulfing Candlestick Conditions
isBoringCandle = math.abs(open[1] - close[1]) * 100 / math.abs(high[1] - low[1]) <= boringThreshold
isEngulfingCandle = math.abs(open - close) * 100 / math.abs(high - low) <= engulfingThreshold

// Bullish and Bearish Engulfing Conditions
bullEngulfing = uptrend and close[1] < open[1] and close > open[1] and not isBoringCandle and not isEngulfingCandle
bearEngulfing = downtrend and close[1] > open[1] and close < open[1] and not isBoringCandle and not isEngulfingCandle

// Stop Loss, Take Profit, and Entry Price Calculation
bullStop = close + (stopLevel * syminfo.mintick)
bearStop = close - (stopLevel * syminfo.mintick)
bullSL = low 
bearSL = high
bullTP = bullStop + (bullStop - low)
bearTP = bearStop - (high - bearStop)

// Entry Conditions
enterLong = bullEngulfing and uptrend
enterShort = bearEngulfing and downtrend

// Exit Conditions
exitLong = ta.crossover(close, bullTP) or ta.crossover(close, bullSL)
exitShort = ta.crossover(close, bearTP) or ta.crossover(close, bearSL)

// Check if exit conditions are met by the next candle
exitLongNextCandle = exitLong and (ta.crossover(close[1], bullTP[1]) or ta.crossover(close[1], bullSL[1]))
exitShortNextCandle = exitShort and (ta.crossover(close[1], bearTP[1]) or ta.crossover(close[1], bearSL[1]))

// Strategy Execution
if enterLong
    strategy.entry("Buy", strategy.long)

if enterShort
    strategy.entry("Sell", strategy.short)

// Exit Conditions for Long (Buy) Positions
if bullEngulfing and not na(bullTP) and not na(bullSL)
    strategy.exit("Exit Long", from_entry="Buy", stop=bullSL, limit=bullTP)

// Exit Conditions for Short (Sell) Positions
if bearEngulfing and not na(bearTP) and not na(bearSL)
    strategy.exit("Exit Short", from_entry="Sell", stop=bearSL, limit=bearTP)


// Plot Shapes and Labels
plotshape(series=bullEngulfing, style=shape.triangleup, location=location.abovebar, color=color.green)
plotshape(series=bearEngulfing, style=shape.triangledown, location=location.abovebar, color=color.red)

// Determine OP, SL, and TP
plot(series=bullEngulfing ? bullStop : na, title="Bullish Engulfing stop", color=color.red, linewidth=3, style=plot.style_linebr)
plot(series=bearEngulfing ? bearStop : na, title="Bearish Engulfing stop", color=color.red, linewidth=3, style=plot.style_linebr)
plot(series=bullEngulfing ? bullSL : na, title="Bullish Engulfing SL", color=color.red, linewidth=3, style=plot.style_linebr)
plot(series=bearEngulfing ? bearSL : na, title="Bearish Engulfing SL", color=color.red, linewidth=3, style=plot.style_linebr)
plot(series=bullEngulfing ? bullTP : na, title="Bullish Engulfing TP", color=color.green, linewidth=3, style=plot.style_linebr)
plot(series=bearEngulfing ? bearTP : na, title="Bearish Engulfing TP", color=color.green, linewidth=3, style=plot.style_linebr)

// Create labels if the condition for bullEngulfing or bearEngulfing is met
//if bullEngulfing
   // label.new(x=bar_index, y=bullSL, text="SL: " + str.tostring(bullSL), color=color.red, textcolor=color.white, style=label.style_labelup, size=size.tiny)

//if bearEngulfing
   // label.new(x=bar_index, y=bearSL, text="SL: " + str.tostring(bearSL), color=color.red, textcolor=color.white, style=label.style_labeldown, size=size.tiny)

//if bullEngulfing
  //  label.new(x=bar_index, y=bullTP, text="TP: " + str.tostring(bullTP), color=color.green, textcolor=color.white, style=label.style_labeldown, size=size.tiny)

//if bearEngulfing
  //  label.new(x=bar_index, y=bearTP, text="TP: " + str.tostring(bearTP), color=color.green, textcolor=color.white, style=label.style_labelup, size=size.tiny)