이동평균선과 RSI를 기반으로 한 일방적 롱 전략

1
Follow
1778
Followers
개요
이 전략은 엔리코 말베르티 (Enrico Malverti) 의 기사를 바탕으로 만들어졌으며, 주로 단순 이동 평균 (SMA) 과 상대적으로 강한 지표 (RSI) 를 사용하여 다중 입점 및 포지션 신호를 식별한다. 전략은 더 많이 하고, 아무것도 하지 않는다.
전략 원칙
입점 신호는 종결 가격에 긴 주기적인 SMA 평균선에서 더 많은 포지션을 열 때이다.
평형 신호는 다음과 같다:
- RSI가 70이거나 75을 넘으면 평준화됩니다.
- 마감 가격 아래의 짧은 기간의 SMA 평균선에서 파손될 때 멈춰라.
- 마감 가격 아래에서 짧은 주기를 통과하는 SMA 평균선에서 정지한다.
동시에 스톱 손실 SMA 평균선과 스톱 중지 SMA 평균선도 그려집니다.
우위 분석
이 전략은 다음과 같은 장점을 가지고 있습니다.
- 이 지표들은 간단하고 이해하기 쉬운 조합으로 구성되어 있으며, 이해하기 쉽고 실행이 가능합니다.
- 더 많은 일을 하고, 더 많은 공백을 피할 수 있습니다.
- 명확한 출입규칙, 스톱로스, 스톱스톱규칙이 있고, 위험도 조절할 수 있습니다.
- 비교적 쉽게 최적화할 수 있으며, SMA 주기 등의 매개 변수를 조정할 수 있다.
위험 분석
이 전략에는 몇 가지 위험도 있습니다.
- "이번의 사고는, '이번의 사고'라는 뜻입니다. '이번의 사고'는, '이번의 사고'라는 뜻입니다.
- SMA 평균선에서 잘못된 위치가 발생할 위험이 있습니다.
- RSI 지표는 분산하기 쉽고, 오버 바이 오버 소드 신호는 신뢰할 수 없습니다.
대응 방법:
- "정신적으로 영향을 받지 않는, 고정된 추적 메커니즘을 구축하는 것"
- SMA 평균 선의 변수 조정, 최적화 주기;
- 다른 지표와 결합하여 RSI 신호를 필터링한다.
최적화 방향
이 전략은 다음과 같은 방향으로 최적화될 수 있습니다.
- 다른 매개 변수의 SMA 설정을 시도합니다.
- 다른 지표들을 추가하여 입출력 신호를 필터링합니다.
- 트렌드를 판단하는 지표, 추세를 구분하는 지표, 추세를 정리하는 지표
- 변수들이 스스로 적응하도록 최적화하기 위해 시도한다.
요약하다
이 전략의 전체적인 아이디어는 명확하고 이해하기 쉽고, 기본 지표를 사용하며, 제어성이 강하며, 중·장기선 운영에 적합하다. 그러나 매개 변수 설정과 지표 필터링은 반복적으로 테스트 및 최적화가 필요합니다. 전략이 더 안정적이고 신뢰할 수 있도록 하기 위해서이다. 아이디어 간단한 전략은 또한 실제로 사용할 수 있는 거래 시스템을 형성하기 위해 많은 최적화 조정과 풍부한 조합이 필요합니다.
Source
Pine
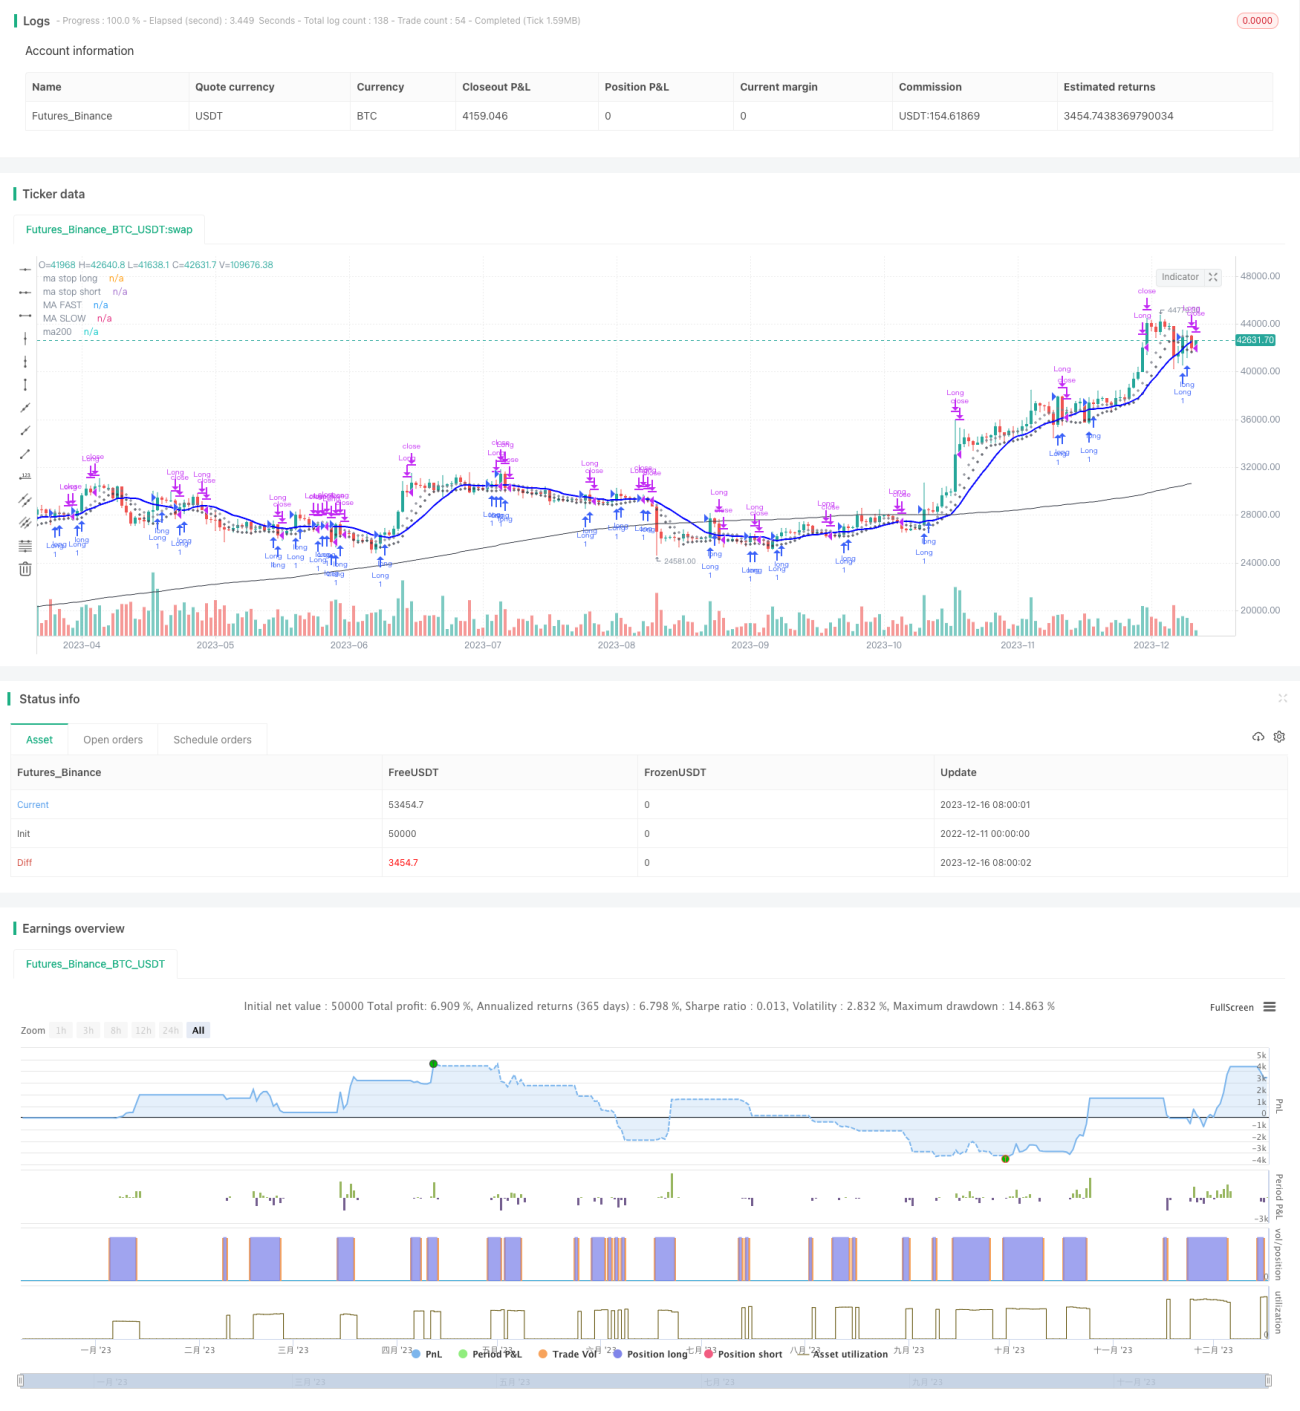
/*backtest
start: 2022-12-11 00:00:00
end: 2023-12-17 00:00:00
period: 1d
basePeriod: 1h
exchanges: [{"eid":"Futures_Binance","currency":"BTC_USDT"}]
*/

//@version= 4
// form the original idea of Enrico Malverti www.enricomalverti.com , trading system 2015
// https://sauciusfinance.altervista.org
strategy(title="MAs & RSI strategy long only", overlay = true, max_bars_back=500)Strategy parameters
Related strategies
Comment
All comments (0)
No data
- 1