SMA and PSAR Strategy for Spot Trading

Overview
This strategy is named "SMA and PSAR Spot Trading Strategy". It combines the advantages of Simple Moving Average (SMA) and Parabolic SAR (PSAR) to determine market trend direction and generate trading signals. When SMA shows an upward trend and PSAR is below price, it is considered as a buy timing. When SMA shows a downward trend and PSAR is above price, it is considered as a sell timing.
Strategy Logic
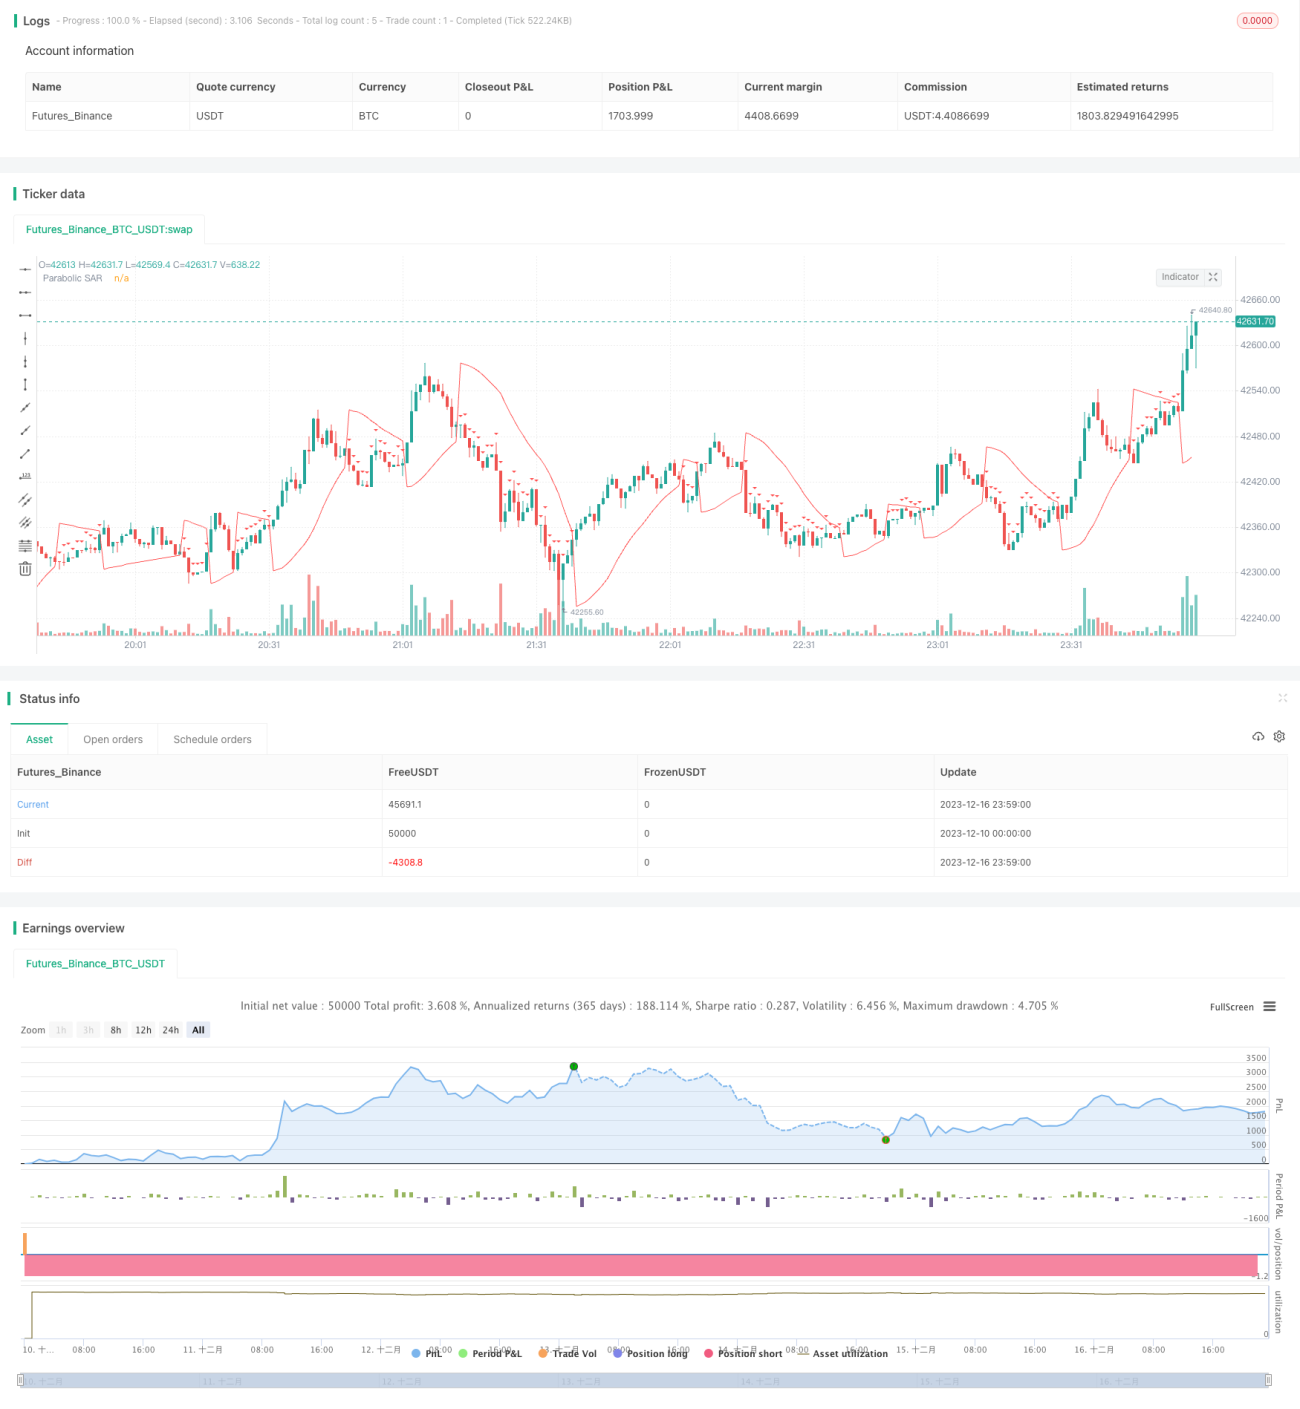
The strategy uses 100-period SMA to determine the overall trend direction. When close price breaks through SMA 100 upwards, it is defined as an upward trend. When close price breaks through SMA 100 downwards, it is defined as a downward trend.
At the same time, PSAR indicator is calculated to determine detailed entry points. PSAR initial value is set at 0.02, increment value is 0.01, and maximum value is 0.2. When in an upward trend, if PSAR is below close price, a buy signal is generated. While in a downward trend, if PSAR is above close price, a sell signal is generated.
In summary, when judged as an upward trend, if PSAR is lower than close price, a buy signal is generated. When judged as a downward trend, if PSAR is higher than close price, a sell signal is generated.
To reduce trading risk, the strategy also sets time exits to close positions after 5 minutes.
Advantage Analysis
This strategy combines SMA and PSAR indicators to determine trends and entry points, which can effectively utilize the advantages of both indicators to improve decision accuracy. SMA can be used to determine major trends, while PSAR is more sensitive to detailed entry points. Using both complements each other and makes the strategy more robust.
In addition, setting time exits helps control risks of individual trades and avoid excessive losses. Overall, this strategy is stable and reliable, suitable for most market environments.
Risk Analysis
-
SMA and PSAR may generate incorrect signals, leading to unnecessary trading losses.
-
The time exit setting is short, may not fully capture trending moves.
-
Parameter settings (like SMA period, PSAR parameters etc.) may not suit some specific products, needing optimization.
-
Backtest curve fitting risks. Market environments change in live trading, strategy performance may not be as good as backtest.
Optimization Directions
-
Test different SMA period parameters to find more suitable values for specific products.
-
Test and optimize PSAR parameters to make it judge detailed entries more accurately.
-
Extend time exit parameters, appropriately increasing holding time on the premise of taking sufficient profits.
-
Add stop loss strategies to better control maximum loss per trade.
Conclusion
This strategy comprehensively uses indicators like SMA and PSAR to determine market trends and entry points, which is stable and reliable, suitable for most market environments. Meanwhile, setting time exits helps control risks. This strategy can be further improved through parameter optimization, stop loss strategies etc. to obtain better live performance.
/*backtest
start: 2023-12-10 00:00:00
end: 2023-12-17 00:00:00
period: 1m
basePeriod: 1m
exchanges: [{"eid":"Futures_Binance","currency":"BTC_USDT"}]
*/

//@version=4
strategy(title="SMA and Parabolic SAR Strategy with Time-Based Exit", shorttitle="SMA+PSAR", overlay=true)

// Define the parameters for the Parabolic SAR- 1