선형 회귀 및 이동 평균을 기반으로 한 추세 추종 거래 전략

개요
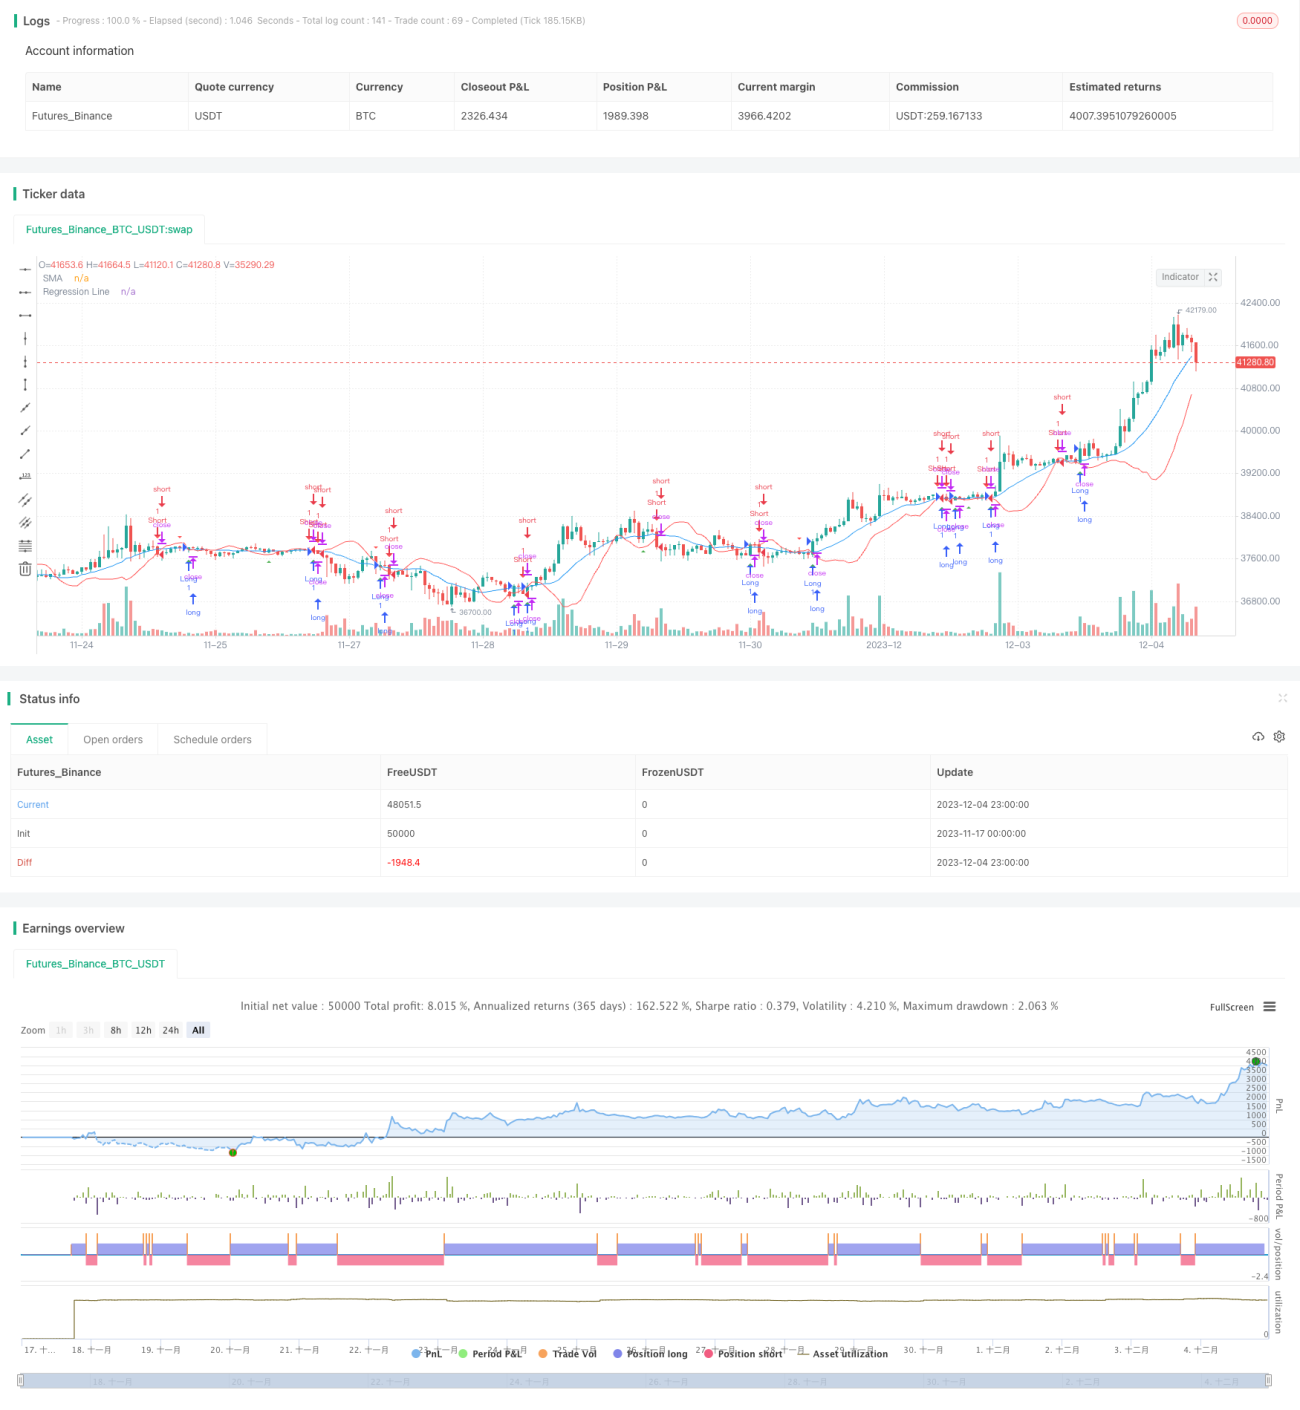
이 전략은 선형 회귀선과 이동 평균을 기반으로 간단한 트렌드 추적 거래 시스템을 설계했다. 선형 회귀선 위에 이동 평균을 통과할 때 더하고, 선형 회귀선 아래에 이동 평균을 통과할 때 공백을했다. 동시에 선형 회귀선의 기울기를 결합하여 일부 거래 신호를 필터링하고, 트렌드 방향이 일치했을 때만 출전한다.
전략 이름
Trend Following Regression Trading Strategy (트렌드 추적 회귀 거래 전략)
전략 원칙
이 전략은 다음과 같은 핵심 요소들을 포함하고 있습니다.
- N일 간소 이동 평균 (SMA) 을 계산합니다.
- 가장 최근 N일에서의 선형 회귀선을 계산합니다.
- 마감가격이 SMA를 넘어서 회귀선보다 높을 때 더 많이 합니다.
- 마감 가격이 SMA 라인을 통과하고 회귀 라인보다 낮을 때 포지션
- 스톱로스 가격과 스톱 <unk> 가격을 설정합니다.
선형 회귀선은 최근 기간 동안의 트렌드 방향에 잘 적합합니다. 이것은 전체 트렌드의 방향을 판단하는 데 도움이 될 수 있습니다. 가격이 SMA 라인을 돌파 할 때, 우리는 선형 회귀선의 방향이 그 돌파구와 일치하는지 여부를 추가로 판단해야합니다. 두 가지 방향이 일치 할 때만 거래 신호가 생성됩니다. 이것은 일부 가짜 돌파구를 필터링 할 수 있습니다.
또한, 전략은 손실을 중지하는 장치를 설정합니다. 가격이 중지 라인을 만질 때, 평소 위치 손실을 중지합니다. 또한, 중지 라인을 설정하여 수익의 일부를 잠금합니다.
전략적 이점
이 전략은 다음과 같은 장점을 가지고 있습니다.
- 트렌드 지표와 브레이크 지표를 결합하여 가짜 브레이크를 방지하고 신호 품질을 향상시킵니다.
- 선형 회귀를 사용하여 트렌드 방향을 판단하고, 트렌드 필터링을 수행합니다. 트렌드가 올라갈 때만 더 많이하고, 트렌드가 내려갈 때 공백을 만듭니다.
- 위험을 통제하기 위해 스톱 및 스톱 메커니즘을 설정합니다.
- 규칙이 명확하고, 이해하기 쉽고, 실행하기 쉽습니다.
- 몇 개의 변수를 조정하는 것만으로도 복잡하지 않습니다.
위험 분석
이 전략에는 몇 가지 위험도 있습니다.
- 위기 상황에서 더 많은 잘못된 거래 신호가 발생합니다.
- 이동 평균선과 회귀 주기의 설정은 반복 테스트 최적화를 필요로 하며, 잘못 설정하면 전략 성능에 영향을 줄 수 있다.
- 극한상황의 중단 손실은 파격으로 인해 더 큰 손실이 발생할 수 있습니다.
- 기술적인 지표에 기초하고 기본적 요소를 포함하지 않습니다.
이러한 위험들에 대해, 우리는 다음과 같은 몇 가지 측면에서 최적화할 수 있습니다:
- 불안한 시장에서 일시 중단 전략을 고려하거나 다른 지표를 사용하여 필터링하십시오.
- 매개 변수를 반복적으로 테스트하여 최적의 매개 변수를 찾습니다.
- 최적화 및 동적으로 정지 위치를 조정
- 경제 데이터와 같은 기본 요소와 함께
최적화 방향
이 전략은 다음과 같은 부분에서 최적화될 수 있습니다.
- 시장 상황을 판단하는 보조적인 지표들을 추가하여 불안정한 상황에서 거래하는 것을 피하십시오.
- 이동 평균 유형을 최적화합니다. 예를 들어, 이중 이동 평균, 3 이동 평균 등의 조합
- 회귀선 기울기를 더 분석하여 기울기 판단 규칙을 추가합니다.
- 변동률 지표와 결합하여 동적 스톱 손실 스톱 위치를 설정합니다.
- 기계 학습 방법을 사용하여 매개 변수를 자동으로 최적화합니다.
요약하다
이 전략은 이동 평균의 트렌드 추적 기능과 선형 회귀의 트렌드 판단 기능을 통합하여 비교적 간단하고 쉬운 트렌드 추적 거래 시스템을 형성한다. 트렌드가 뚜렷한 시장에서 이 전략은 더 나은 효과를 얻을 수 있다. 또한 우리는 파라미터와 규칙에 대한 많은 피드백과 최적화를 수행하고 위험을 잘 제어해야 하며, 이 전략은 안정적인 투자 수익을 얻을 수 있어야 한다.
- 1