
이 전략은 간단한 이동 평균과 몇 가지 수학 계산을 사용하여 구매/판매 지점을 결정한다. 우리는 100 일 SMA를 기준선으로 사용합니다. 종결 가격이 그 선보다 낮다면, 우리는 그 선보다 낮은 위치에 따라 개시 지점을 선택합니다.
이 전략은 세 개의 SMA 라인을 사용한다: 빠른 라인 (기본 14일), 느린 라인 (기본 100일) 및 참조 라인 (기본 30일).
마감값이 기준선보다 낮고, 느린 선에 대한 낮은 편차가 구성된 낮은 편차보다 크며, 빠른 선이 올라가고 느린 선이 내려가면, 다단으로 진입한다. 이러한 조건이 충족될 때, 빠른 선과 느린 선이 교차할 가능성이 매우 높기 때문에 더 좋은 진입점이다.
닫기 가격이 참조선보다 높고, 느린 선에 대한 높은 편차가 구성된 높은 편차보다 크면, 닫기 가격이 연속으로 3개의 K선으로 상승하여 수익을 달성하고, 빠른 선이 느린 선보다 높을 때, 평점 포지션은 단순하다. 가격이 계속 크게 상승하면, 추적 스톱 손실이 시작된다.
매 거래의 포지션은 특정 비율에 따라 진입하여 포지션을 제어합니다.
대응 최적화 조치:
SMA 파동 편향 거래 전략은 편향량을 다른 SMA 평균을 참조하여 최적의 입문 시점을 찾습니다. 또한, 탈퇴 메커니즘은 손실을 추적하여 수익을 고정합니다. 이 전략은 간단하고 이해하기 쉽고 실행이 쉽습니다.
/*backtest
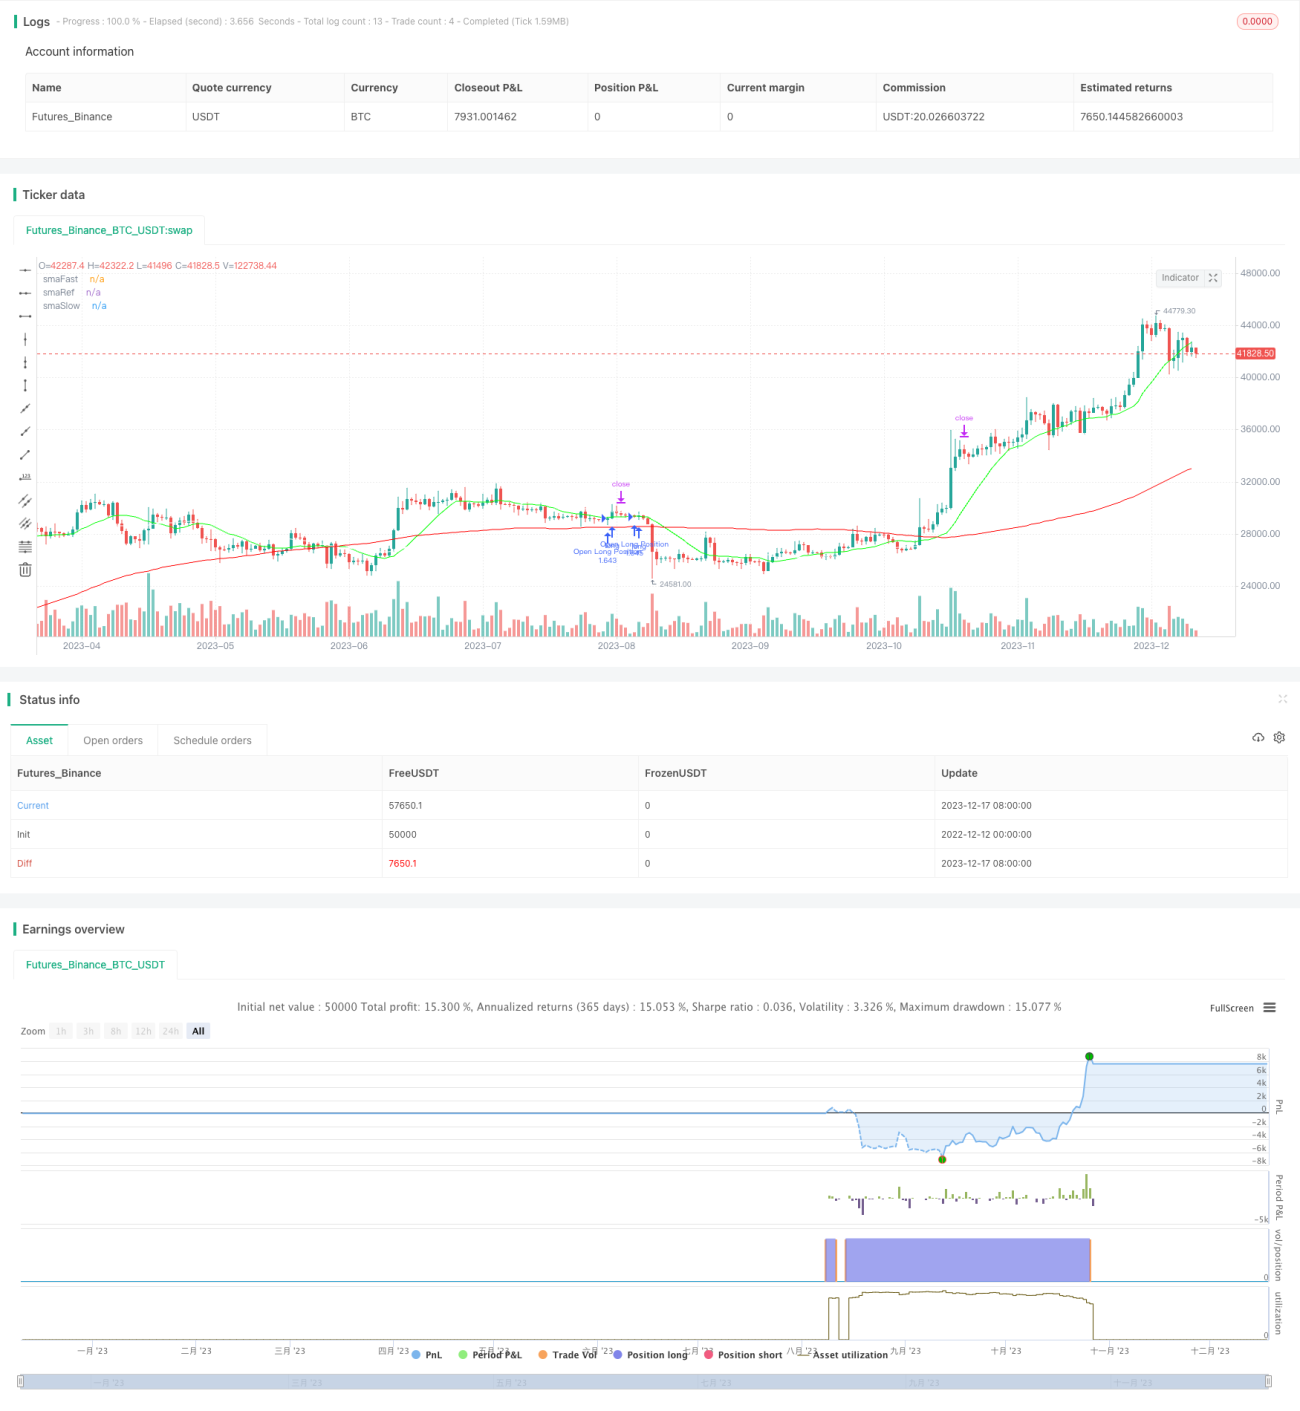
start: 2022-12-12 00:00:00
end: 2023-12-18 00:00:00
period: 1d
basePeriod: 1h
exchanges: [{"eid":"Futures_Binance","currency":"BTC_USDT"}]
*/
// @version=4
// Author: Sonny Parlin (highschool dropout)
strategy(shorttitle="SMA+Strategy", title="SMA Offset Strategy",
overlay=true, currency=currency.USD,
initial_capital=10000)
// Inputs and variables
ss = input(14, minval=10, maxval=50, title="SMA Fast (days)")
ff = input(100, minval=55, maxval=200, title="SMA Slow (days)")
ref = input(30, minval=20, maxval=50, title="SMA Reference (days)")
lowOffset = input(0.001, "Low Offset (%)", minval=0, step=0.001)
highOffset = input(0.0164, "High Offset (%)", minval=0, step=0.0001)
orderStake = input(0.96, "Order Stake (%)", minval=0, step=0.01)
// SMA
smaFast = sma(close, ss)
smaSlow = sma(close, ff)
smaRef = sma(close, ref)
distanceLow = (close - smaSlow) / close
distanceHigh = (close - smaSlow) / close
// Set up SMA plot but don't show by default
plot(smaFast, "smaFast", color=#00ff00, display = 0)
plot(smaSlow, "smaSlow", color=#ff0000, display = 0)
plot(smaRef, "smaRef", color=#ffffff, display = 0)
// The buy stratey:
// guard that the low is under our sma low reference line by our lowOffset %,
// default is 0.001. (low < smaRef) and (distanceLow > lowOffset)
// SMA fast is on the rise and SMA slow is falling and they are very likely
// to cross. (rising(smaFast,1)) and (falling(smaSlow, 1))
enterLong = (low < smaRef) and (distanceLow > lowOffset) and (rising(smaFast,1)) and (falling(smaSlow, 1))
// The sell Strategy:
// Guard that close is higher than our sma high reference line by our
// highOffset %, default is 0.0164. (close > smaRef) and (distanceHigh > highOffset)
// Guard that close has risen by 3 candles in a row (rising(close,3))
// Guard that we currently have profit (strategy.openprofit > 0)
// Guard that SMA fast is higher than smaSlow (smaFast > smaSlow)
// If it keeps going up past our close position the trailing stoploss will kick in!
enterShort = (close > smaRef) and (distanceHigh > highOffset) and (rising(close,3)) and (strategy.openprofit > 0) and (smaFast > smaSlow)
// Order size is based on total equity
// Example 1:
// startingEquity = 2000
// close = 47434.93
// orderStake = 0.45
// (2,000 × orderStake) / close = orderSize = 0.0189733599 = approx $900
// Example 2:
// startingEquity = 2000
// close = 1.272
// orderStake = 0.45
// (startingEquity × orderStake) / close = orderSize = 707.5471698113 = approx $900
orderSize = (strategy.equity * orderStake) / close
// Trailing Stoploss
// I'm using 1.35 as my default value, play with this for different results.
longTrailPerc = input(title="Trailing Stoploss (%)",
type=input.float, minval=0.0, step=0.1, defval=1.35) * 0.01
longStopPrice = 0.0
longStopPrice := if (strategy.position_size > 0)
stopValue = close * (1 - longTrailPerc)
max(stopValue, longStopPrice[1])
else
0
if (enterLong)
strategy.entry("Open Long Position", strategy.long, orderSize, when=strategy.position_size <= 0)
if (enterShort)
strategy.exit(id="Close Long Position", stop=longStopPrice)
//plot(strategy.equity)