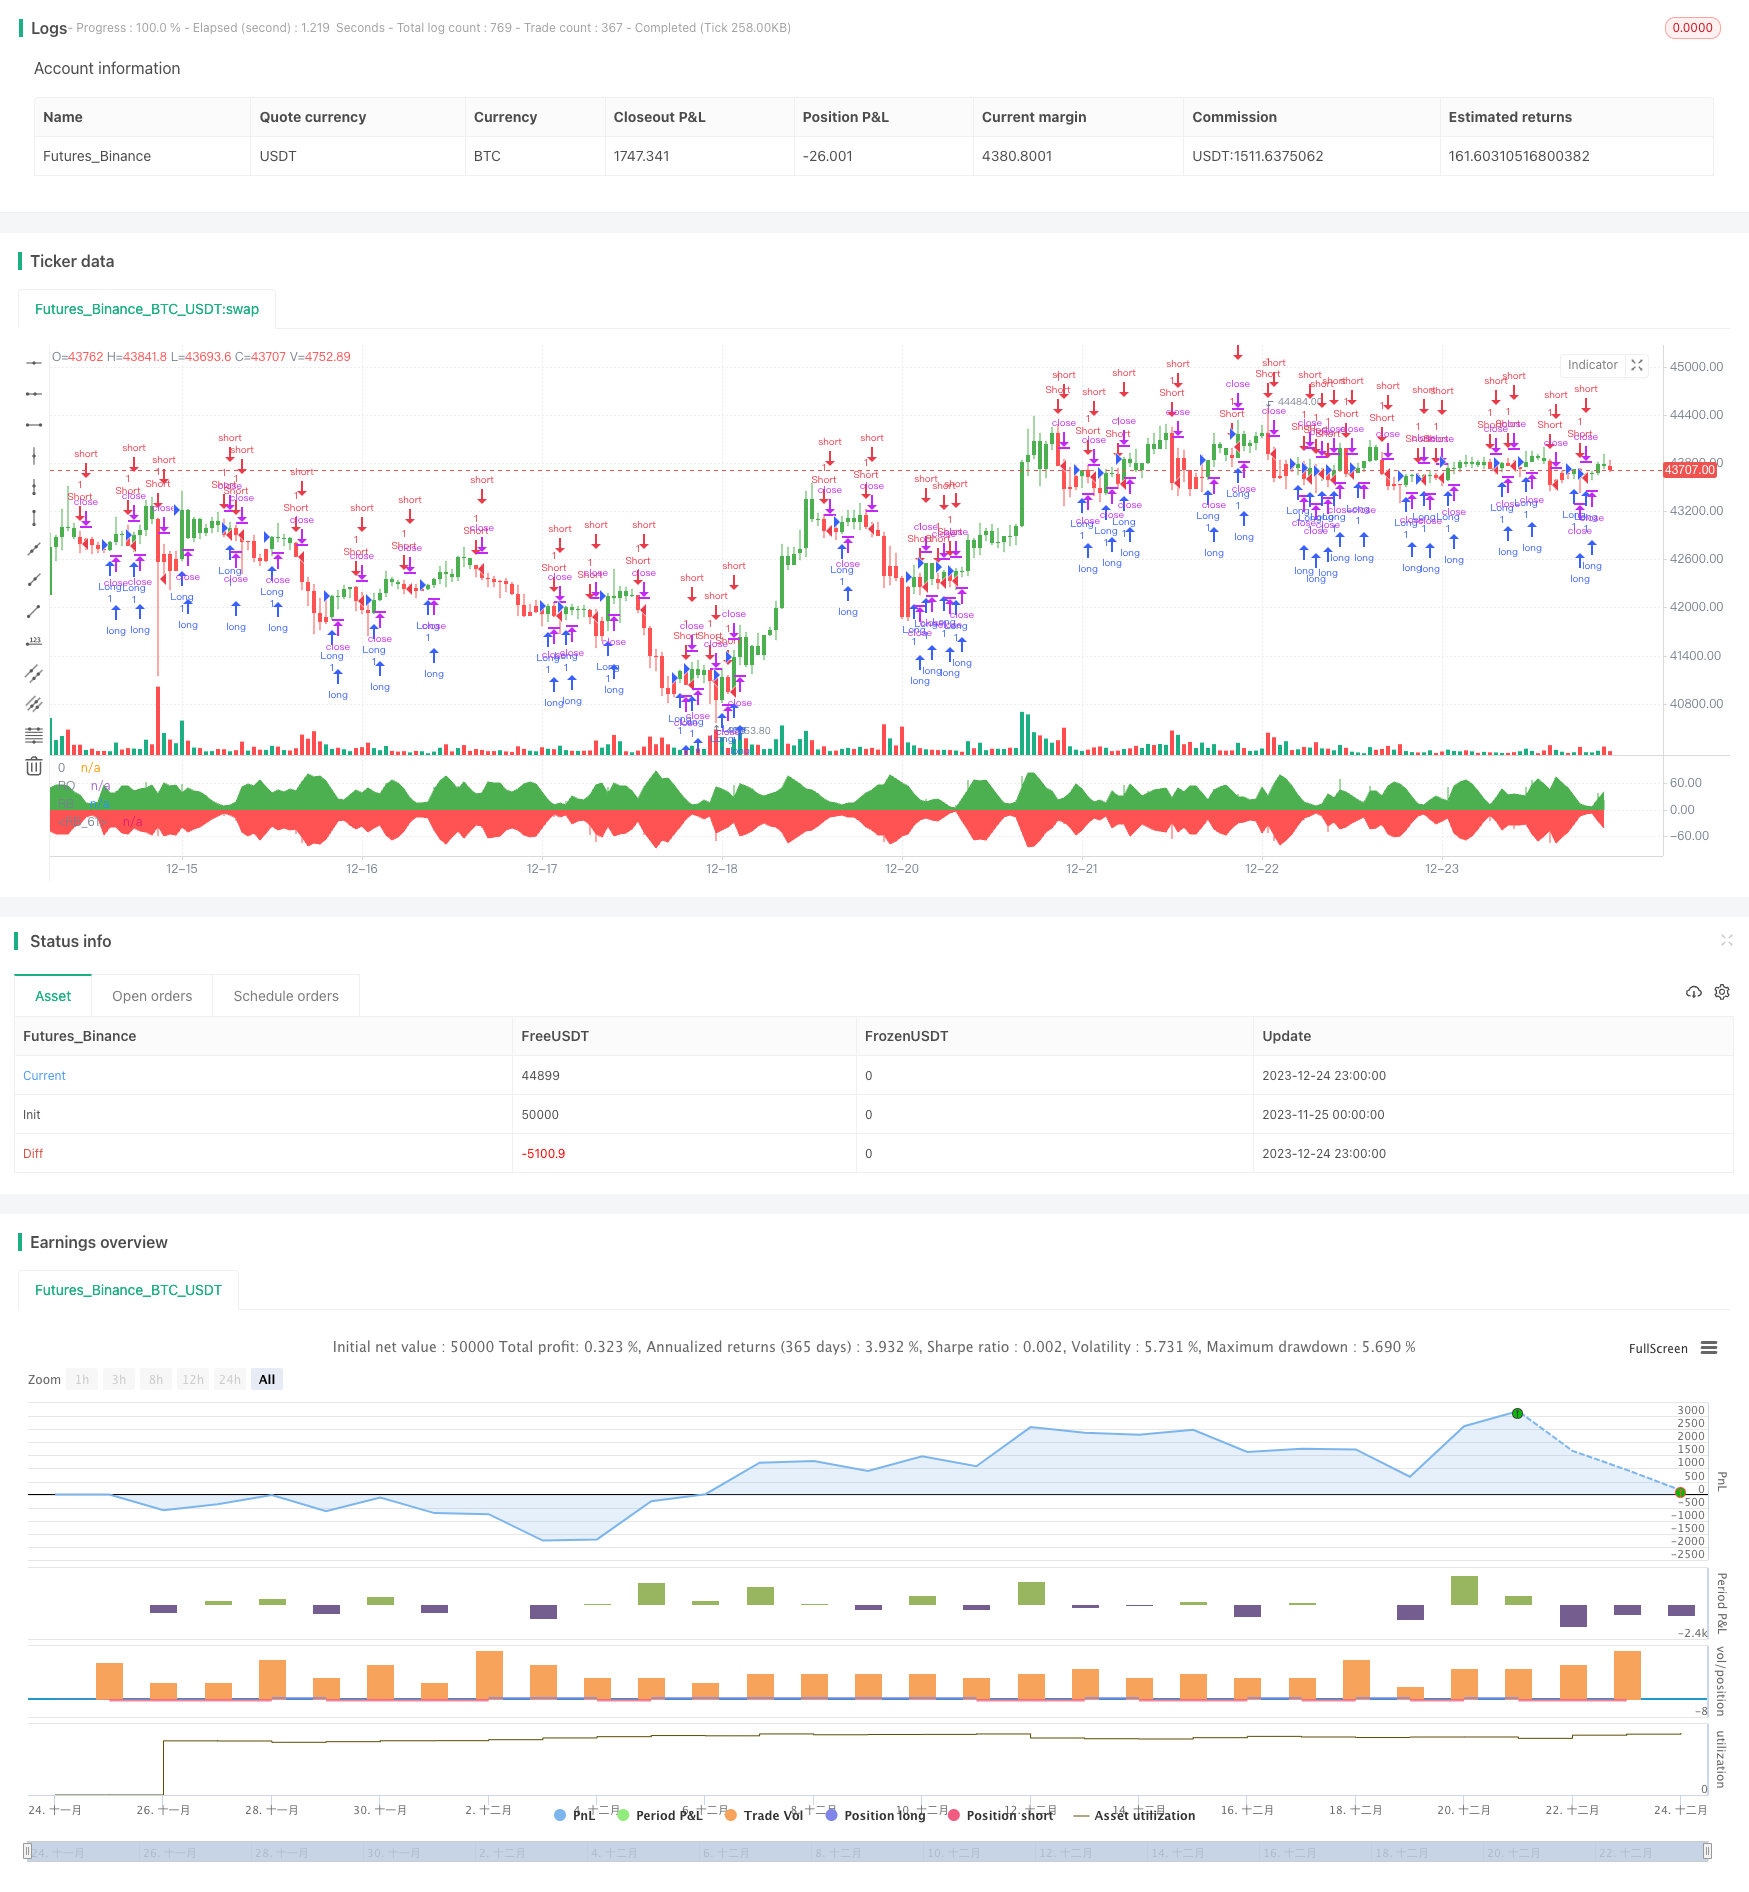
개요
무지개 흔들기 재측정 전략은 무지개 흔들기 지표에 기반한 정량 거래 전략이다. 이 전략은 주가와 평균선 사이의 오차 정도를 계산하여 시장의 추세 방향과 강도를 판단하여 장단 포지션 방향을 판단한다.
전략 원칙
이 전략의 핵심 지표는 Rainbow Oscillator (RO) 이며, 계산 공식은 다음과 같습니다.
RO = 100 * ((收盘价 - 10日移动平均线) / (最高价的最高值 - 最低价的最低值))
10일 이동 평균은 10주기 종점 가격의 간단한 이동 평균이다. 이 지표는 가격의 자기 평균선에 대한 편차를 반영한다. RO > 0일 때는 가격이 평균선 위에 있다는 것을 의미하며, 낙관적 신호이다. RO < 0일 때는 가격이 평균선 아래에 있다는 것을 의미하며, 낙관적 신호이다.
이 전략은 또한 Bandwidth, RB를 계산하는 보조 지표를 계산합니다. 계산 공식은 다음과 같습니다.
RB = 100 * ((均线的最高值 - 均线的最低值) / (最高价的最高值 - 最低价的最低值))
RB는 평균선 사이의 폭을 나타냅니다. RB가 클수록 가격의 변동성이 커지고 가격의 안정성이 나타납니다. RB 지표는 시장의 안정성을 판단하는 데 사용할 수 있습니다.
이 전략은 RO와 RB 지표의 값에 따라 가격의 편차 정도와 시장의 안정성을 판단하여 장점과 단점의 거래 신호를 발생시킵니다.
전략적 이점
이 전략은 다음과 같은 장점을 가지고 있습니다.
- 이중 지표 판단을 통해 단일 지표 판단의 한계를 피할 수 있습니다.
- 가격의 움직임과 시장의 안정성을 동시에 판단할 수 있다.
- 계산은 간단하고, 이해하기 쉽고, 구현하기 쉽습니다.
- 가시화 지표, 虹 효과를 형성, 직관적으로 읽기 쉽다.
전략적 위험
이 전략에는 몇 가지 위험도 있습니다.
- RO와 RB 지표 파라미터를 잘못 설정하면 거래 신호 오류가 발생할 수 있다.
- 이중 동선 전략은 잘못된 신호와 빈번한 거래를 초래할 수 있다.
- 재검토 주기와 잘못된 품종 선택은 전략의 효과에 영향을 미칩니다.
- 거래비용을 고려하지 않고서는 실디 효과가 좋지 않을 수 있습니다.
대책:
- RO 및 RB 지표의 최적화 파라미터를 .
- 필터링 조건을 추가하여 거래 빈도를 줄여줍니다.
- 적절한 재검토주기와 품종을 선택하세요.
- 거래 비용을 계산하고 고려하십시오.
전략 최적화
이 전략은 다음과 같은 부분에서 최적화될 수 있습니다.
- RO 지표에 Smooth 기능을 추가하여 지표의 급격한 변동을 방지한다.
- 단독 손실을 통제하기 위해 Stop Loss 전략에 참여하십시오.
- 다른 지표와 결합하여 포트폴리오 거래를 통해 수익률을 높일 수 있습니다.
- 기계학습 모델을 추가하여 예측하고, 지표의 효과를 판단한다.
- 다양한 품종의 파라미터를 최적화하여 적응력을 높인다.
요약하다
무지개 흔들기 재측정 전략은 가격과 평균선 사이의 편차 관계를 계산하여 시장의 추세와 안정성을 판단하여 장거리 거래를 한다. 이 전략은 직관적으로 읽기 쉽고, 구현하기 간단하며, 실용적인 가치가 있다. 그러나 또한 몇 가지 위험이 있으며, 매개 변수와 거래 규칙에 대한 최적화가 필요하며, 위험을 줄이고, 실전 효과를 높인다.
/*backtest
start: 2023-11-25 00:00:00
end: 2023-12-25 00:00:00
period: 1h
basePeriod: 15m
exchanges: [{"eid":"Futures_Binance","currency":"BTC_USDT"}]
*/

//@version=2
////////////////////////////////////////////////////////////
//  Copyright by HPotter v1.0 18/03/2018
// Ever since the people concluded that stock market price movements are not
// random or chaotic, but follow specific trends that can be forecasted, they
// tried to develop different tools or procedures that could help them identify
// those trends. And one of those financial indicators is the Rainbow Oscillator
// Indicator. The Rainbow Oscillator Indicator is relatively new, originally
// introduced in 1997, and it is used to forecast the changes of trend direction.
//
// As market prices go up and down, the oscillator appears as a direction of the
// trend, but also as the safety of the market and the depth of that trend. As
// the rainbow grows in width, the current trend gives signs of continuity, and
// if the value of the oscillator goes beyond 80, the market becomes more and more
// unstable, being prone to a sudden reversal. When prices move towards the rainbow
// and the oscillator becomes more and more flat, the market tends to remain more
// stable and the bandwidth decreases. Still, if the oscillator value goes below 20,
// the market is again, prone to sudden reversals. The safest bandwidth value where
// the market is stable is between 20 and 80, in the Rainbow Oscillator indicator value.
// The depth a certain price has on a chart and into the rainbow can be used to judge
// the strength of the move.
//
// You can change long to short in the Input Settings
// WARNING:
//  - For purpose educate only
//  - This script to change bars colors.
////////////////////////////////////////////////////////////
strategy(title="Rainbow Oscillator Backtest")
Length = input(2, minval=1)
LengthHHLL = input(10, minval=2, title="HHV/LLV Lookback")
reverse = input(false, title="Trade reverse")
xMA1 = sma(close, Length)
xMA2 = sma(xMA1, Length)
xMA3 = sma(xMA2, Length)
xMA4 = sma(xMA3, Length)
xMA5 = sma(xMA4, Length)
xMA6 = sma(xMA5, Length)
xMA7 = sma(xMA6, Length)
xMA8 = sma(xMA7, Length)
xMA9 = sma(xMA8, Length)
xMA10 = sma(xMA9, Length)
xHH = highest(close, LengthHHLL)
xLL = lowest(close, LengthHHLL)
xHHMAs = max(xMA1,max(xMA2,max(xMA3,max(xMA4,max(xMA5,max(xMA6,max(xMA7,max(xMA8,max(xMA9,xMA10)))))))))
xLLMAs = min(xMA1,min(xMA2,min(xMA3,min(xMA4,min(xMA5,min(xMA6,min(xMA7,min(xMA8,min(xMA9,xMA10)))))))))
xRBO = 100 * ((close - ((xMA1+xMA2+xMA3+xMA4+xMA5+xMA6+xMA7+xMA8+xMA9+xMA10) / 10)) / (xHH - xLL))
xRB = 100 * ((xHHMAs - xLLMAs) / (xHH - xLL))
clr = iff(xRBO >= 0, green, red)
pos = iff(xRBO > 0, 1,
       iff(xRBO < 0, -1, nz(pos[1], 0)))
possig = iff(reverse and pos == 1, -1,
          iff(reverse and pos == -1, 1, pos))
if (possig == 1)
    strategy.entry("Long", strategy.long)
if (possig == -1)
    strategy.entry("Short", strategy.short)
barcolor(possig == -1 ? red: possig == 1 ? green : blue )
plot(xRBO, color=clr, title="RO", style= histogram, linewidth=2)
p0 = plot(0, color = gray, title="0")
p1 = plot(xRB, color=green, title="RB")
p2 = plot(-xRB, color=red, title="RB")
fill(p1, p0, color=green)
fill(p2, p0, color=red)