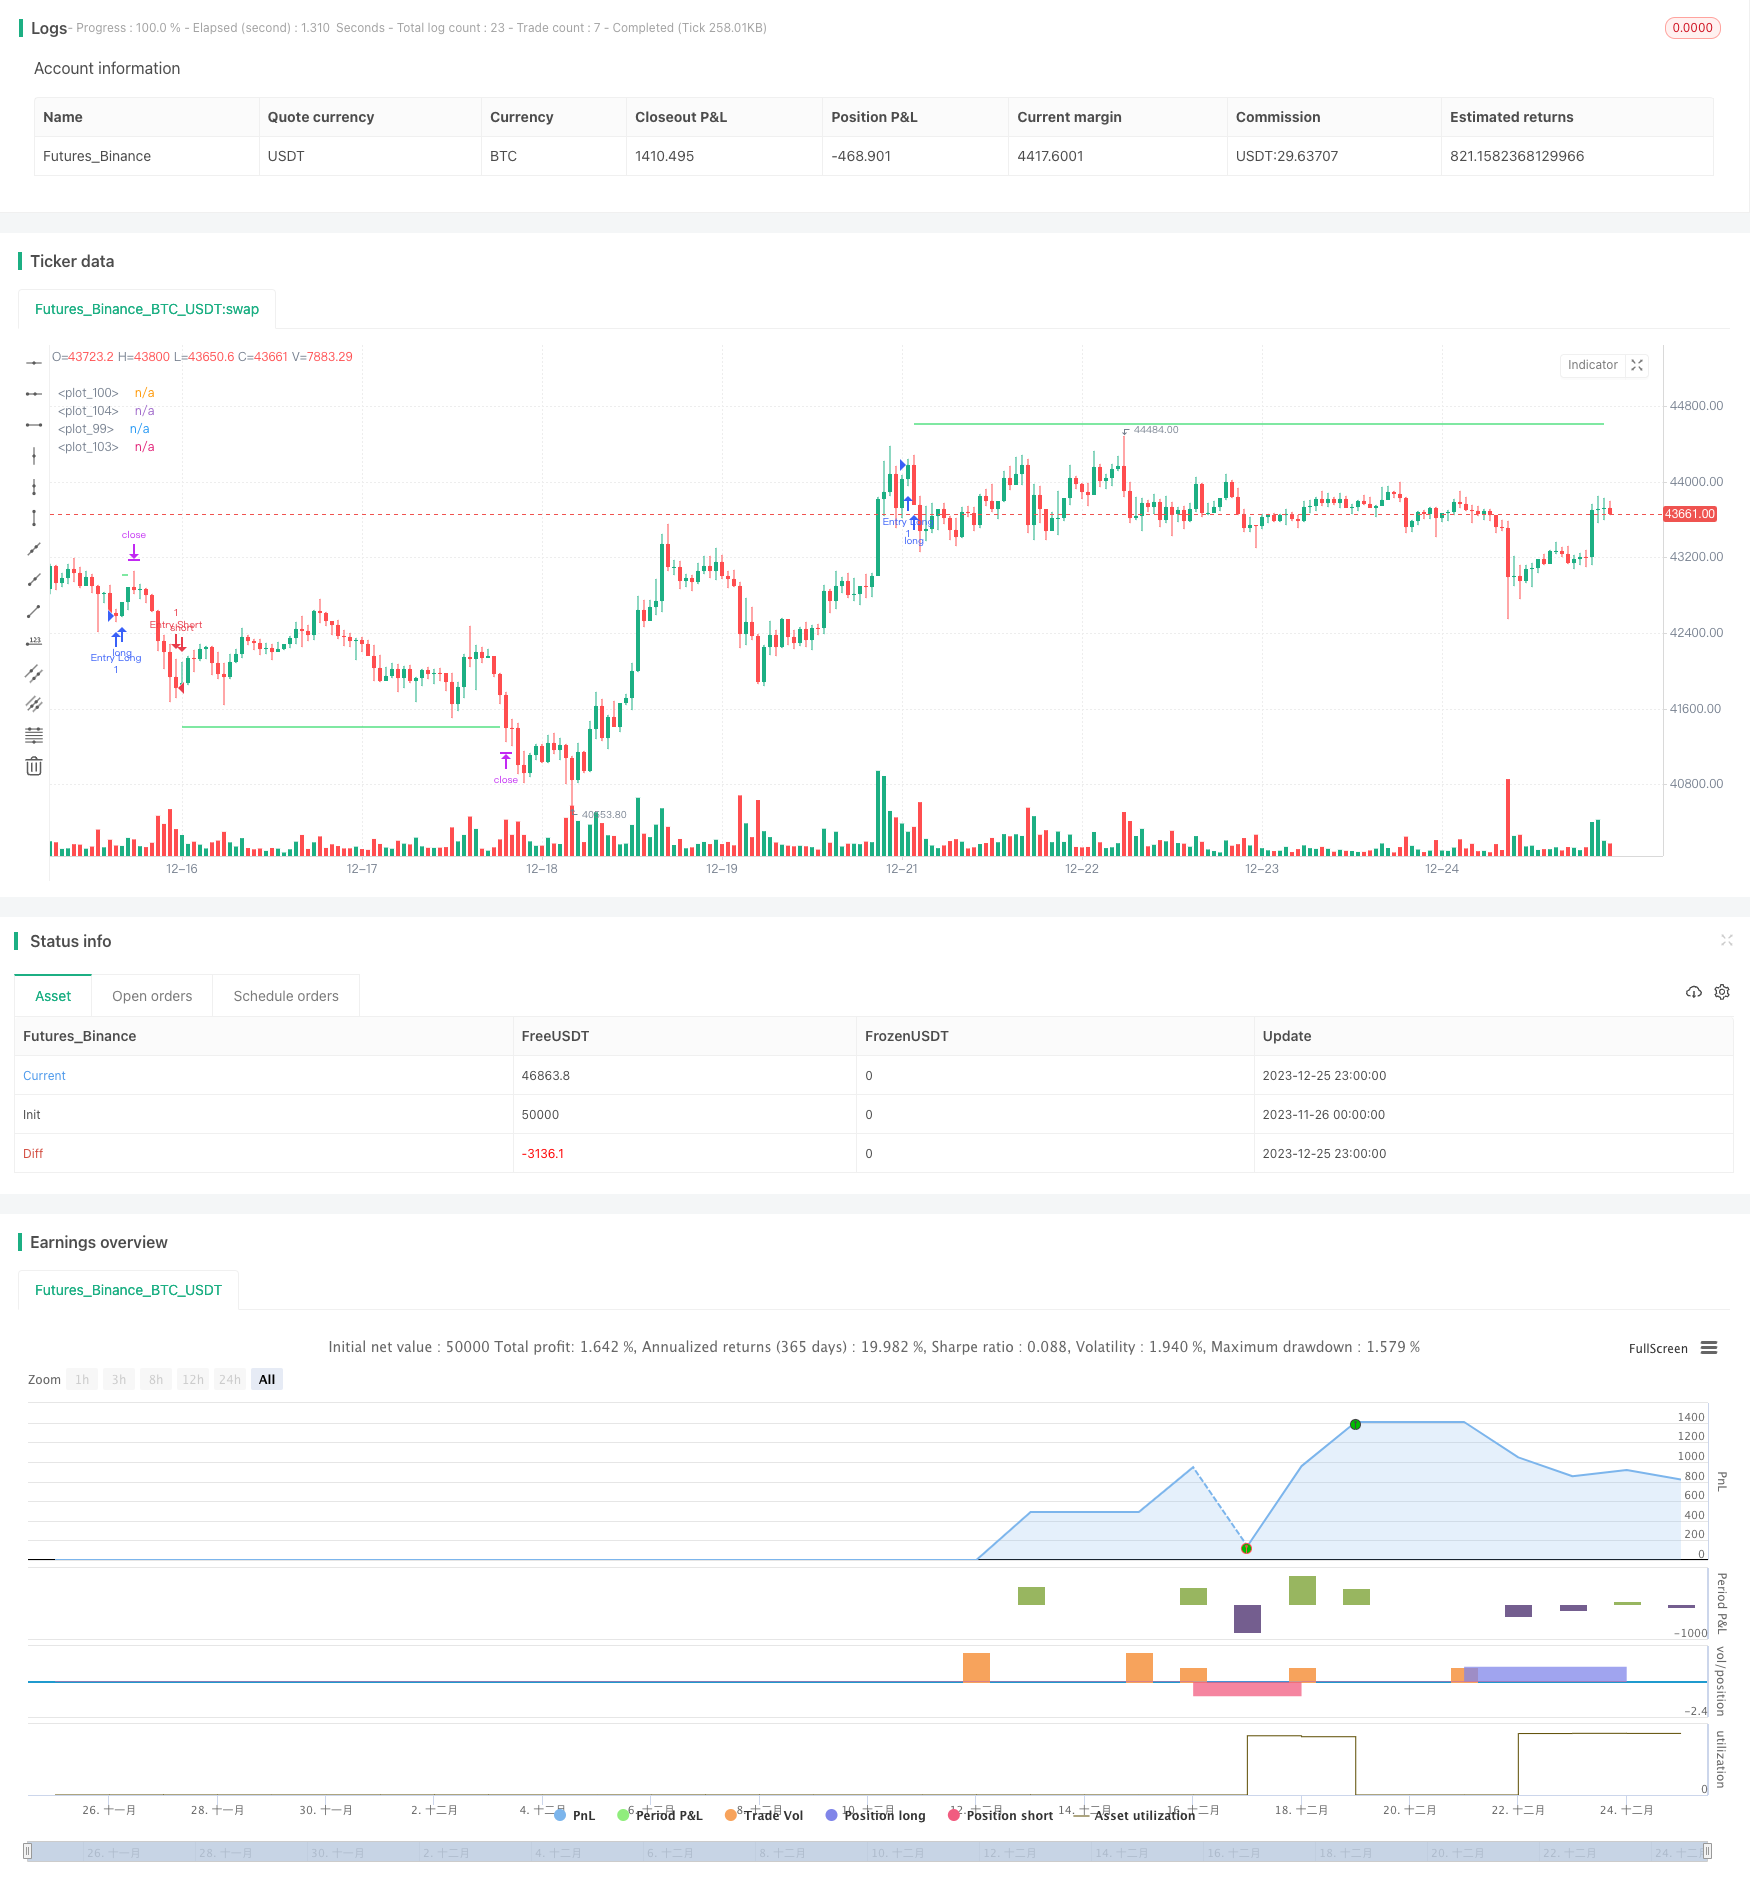
개요
이 전략은 MACD 지표의 빠른 선과 느린 선의 교차를 비교하여 구매 및 판매 신호를 생성한다. 구매 신호를 생성할 때, 계좌의 지분을 일정 비율로 차지하여 구매를 한다. 이후 특정 철수 지점에서 입장을 추가한다. 포지션 수익이 구성된 정지점에 도달했을 때, 모든 입장을 매각한다. 판매 신호와 구매 신호 논리는 비슷하다.
전략 원칙
이 전략의 핵심 논리는 트렌드를 판단하기 위해 MACD의 빠른 선과 느린 선의 교차점을 비교하는 것입니다. MACD는 이동 평균의 차원이며, 단기 및 장기 평균 사이의 차원을 계산하여 시장의 추세와 에너지를 판단합니다. 빠른 선과 느린 선의 교차는 금색과 사각지대입니다.
빠른 선에서 느린 선을 통과하면 골드 포크가 발생하여 시장이 부진한 경향에 있음을 나타냅니다. 이 때 전략은 더 많은 포지션을 열 것입니다. 빠른 선 아래에서 느린 선을 통과하면 죽은 포크가 발생하여 하락의 경향을 나타냅니다. 이 때 전략은 포지션을 열 것입니다.
포지션 개설 후, 전략은 특정 철수 지점에서 추가 상장 또는 상장한다. 이것은 마틴겔 원칙을 통해 수익 공간을 증가시킬 수 있다. 포지션의 누적 수익이配置의 정지 지점에 도달한 후, 전략은 모두 팔거나 평점 포지션을 구매한다.
우위 분석
이 전략은 다음과 같은 장점을 가지고 있습니다.
MACD 지표는 고전적이고 신뢰할 수 있는 기술 분석 지표로 시장의 흐름을 판단합니다.
한 거래의 위험을 통제하기 위해 포지션을 분할적으로 열 수 있습니다.
추가 상장 개설은 마틴겔 원칙을 통해 수익 공간을 확장할 수 있다.
손실을 제한하기 위해 정지점을 설정하십시오.
위험 분석
이 전략에는 몇 가지 위험도 있습니다.
MACD 지표는 시장의 움직임을 완벽하게 예측할 수 없으며, 잘못된 신호가 발생할 수 있다.
전체 포지션을 추가하는 포지션이 철회 확장의 위험이 있습니다. 추가된 포지션의 비율을 적절하게 조정할 수 있습니다.
막점 설정이 너무 작으면 수익 공간이 제한될 수 있다. 다양한 품종에 따라 조정할 수 있다.
개장금액의 비율을 합리적으로 배분해야 하며, 단일 품종 거래가 계좌 제한을 초과하지 않도록 해야 한다.
최적화 방향
이 전략은 다음과 같은 부분에서 최적화될 수 있습니다.
다양한 매개 변수의 MACD 지표를 테스트하여 특정 거래 품종에 더 적합한 지표 매개 변수를 찾습니다.
포지션을 추가할 때마다 투자금의 비율과 인출폭의 변수를 최적화하여 최적의 변수 조합을 찾습니다.
각각 긴 선과 짧은 선의 동작 정지점 파라미터를 테스트하여 최적의 정지 수준을 결정한다.
계정의 포지션 능력을 평가하고, 합리적인 단일 품종 최대 포지션 제한을 설정한다.
스톱 로직을 추가한다. 시장이 급격하게 변할 때 스톱 로직은 손실을 효과적으로 제어한다.
요약하다
이 전략은 전반적으로 전형적인 트렌드 추적 전략이다. 그것은 MACD 지표를 사용하여 시장의 경향 방향을 판단하고, 분기 상장 방식을 취하여 수익이 일정 수준에 도달 한 후 멈추고 퇴장한다. 이 전략은 간단하고 실용적이며, 구현하기 쉽고, 수량 거래 초보자에게 적합하다. 매개 변수 최적화 및 위트 컨트롤 논리 확장으로 전략을 더 튼튼하게 만들 수 있다.
/*backtest
start: 2023-11-26 00:00:00
end: 2023-12-26 00:00:00
period: 1h
basePeriod: 15m
exchanges: [{"eid":"Futures_Binance","currency":"BTC_USDT"}]
*/

// This source code is subject to the terms of the Mozilla Public License 2.0 at https://mozilla.org/MPL/2.0/
// © TradingSoft_tech

//@version=5
strategy("MAPM-V1", overlay=true, default_qty_value=10, max_bars_back=5000,default_qty_type = strategy.percent_of_equity, commission_value=0.1, initial_capital = 100, pyramiding=6, currency=currency.USD)

///////// Options
SignalFast = input.int(300, step=10)
SignalSlow = input.int(600, step=10)
StepAddPurchases = input.float(2.5, step=0.1)
VolumePurchases = input.int(6,step=1)
Buy = input(true)
Sell = input(true)
longProfitPerc = input.float(title="Long Take Profit (%)", minval=0.0, step=0.1, defval=1) * 0.01
shortProfitPerc = input.float(title="Short Take Profit (%)", minval=0.0, step=0.1, defval=1) * 0.01
Martingale = input.float(1.6, minval = 1, step = 0.1)
VolumeDepo = input.int(100, step=1)
PercentOfDepo = input.float(10, step=1)
Close = (close)
EnterVolume = VolumeDepo*PercentOfDepo*0.01/Close

///////// Calculation indicator
fastAverage = ta.ema(close, 8)
slowAverage = ta.ema(close, 49)
macd = fastAverage - slowAverage
macdSignalF = ta.ema(macd,SignalFast)
macdSignalS = ta.ema(macd,SignalSlow)

// Test Start
startYear = input(2005, "Test Start Year")
startMonth = input(1, "Test Start Month")
startDay = input(1, "Test Start Day")
startTest = timestamp(startYear,startMonth,startDay,0,0)

//Test End
endYear = input(2050, "Test End Year")
endMonth = input(12, "Test End Month")
endDay = input(30, "Test End Day")
endTest = timestamp(endYear,endMonth,endDay,23,59)

timeRange = time > startTest and time < endTest ? true : false

///////// Plot Data
//plot(macd, style = plot.style_histogram)
//plot(macdSignalF*10000, style = plot.style_line, color=color.red)
//plot(macdSignalS*10000, style = plot.style_line, color=color.blue)
//plot(fastAverage, style = plot.style_line, color=color.red)
//plot(slowAverage, style = plot.style_line, color=color.blue)

///////// Calculation of the updated value
var x = 0.0
if strategy.opentrades>strategy.opentrades[1]
    x := x + 1
else if strategy.opentrades==0
    x := 0
y = x+1

///////// Calculation of reference price data
entryPrice = strategy.opentrades==0? 0 : strategy.opentrades.entry_price(0)
limitLong = strategy.position_avg_price * (1 + longProfitPerc)
limitShort = strategy.position_avg_price * (1 - shortProfitPerc)
SteplimitLong = entryPrice[0]*(1-StepAddPurchases*y/100)
SteplimitShort = entryPrice[0]*(1+StepAddPurchases*y/100)

///////// Conditions for a long
bool EntryLong = ta.crossover(macdSignalF, macdSignalS) and Buy and strategy.opentrades==0 and strategy.position_size==0
bool PurchasesLong = Buy and strategy.opentrades==x and strategy.position_size>0 and x<=VolumePurchases
bool CancelPurchasesLong = strategy.position_size==0 and strategy.opentrades==0
bool TPLong = strategy.position_size>0 and strategy.opentrades!=0
///////// Entry Long + add.purchases + cancel purchases + Take profit Long
switch
    EntryLong => strategy.entry("Entry Long", strategy.long, qty = EnterVolume)
    PurchasesLong => strategy.entry("PurchasesLong", strategy.long, qty = EnterVolume*math.pow(Martingale,y), limit = SteplimitLong)
    CancelPurchasesLong => strategy.cancel("PurchasesLong")
switch
    TPLong => strategy.exit("TPLong", qty_percent = 100, limit = limitLong)

///////// Conditions for a Short
bool EntryShort = ta.crossunder(macdSignalF, macdSignalS) and Sell and strategy.opentrades==0 and strategy.position_size==0
bool PurchasesShort = Sell and strategy.opentrades==x and strategy.position_size<0 and x<=VolumePurchases
bool CancelPurchasesShort = strategy.position_size==0 and strategy.opentrades==0
bool TPShort = strategy.position_size<0 and strategy.opentrades!=0

///////// Entry Short + add.purchases + cancel purchases + Take profit Short
switch
    EntryShort => strategy.entry("Entry Short", strategy.short, qty = EnterVolume)
    PurchasesShort => strategy.entry("PurchasesShort", strategy.short, qty = EnterVolume*math.pow(Martingale,y), limit = SteplimitShort)
    CancelPurchasesShort => strategy.cancel("PurchasesShort")
switch
    TPShort => strategy.exit("TPShort", qty_percent = 100, limit = limitShort)

/////////Calculation of conditions and reference data for level drawing
InTradeLong = strategy.position_size<0
InTradeShort = strategy.position_size>0
PickInLong = strategy.opentrades.entry_price(0)*(1-StepAddPurchases*y/100)
PickInShort = strategy.opentrades.entry_price(0)*(1+StepAddPurchases*y/100)

/////////Displaying the level of Take Profit
plot(InTradeLong ? na : limitLong, color=color.new(#00d146, 0), style=plot.style_linebr, linewidth=1)
plot(InTradeShort ? na : limitShort, color=color.new(#00d146, 0), style=plot.style_linebr, linewidth=1)

/////////Displaying the level of add.purchases
plot(InTradeLong ? na : PickInLong, color=color.white, style=plot.style_linebr, linewidth=1)
plot(InTradeShort ? na : PickInShort, color=color.white, style=plot.style_linebr, linewidth=1)