개요
느린 RSI 과잉 구매 과잉 판매 전략은 RSI의 회귀 주기를 연장하여 RSI 곡선의 변동성을 줄여 새로운 거래 기회를 열어줍니다. 이 전략은 MACD와 같은 다른 기술 지표에도 적용됩니다.
전략 원칙
이 전략의 핵심 아이디어는 RSI의 회귀 주기의 길이를 연장하여 500 주기를 기본으로하고 SMA를 통해 RSI 곡선을 평형화하여 기본 주기는 250 니다. 이것은 RSI 곡선의 변동성을 크게 줄이고 RSI의 반응 속도를 느리게하여 새로운 거래 기회를 창출합니다.
지나치게 긴 회귀 주기는 RSI 곡선의 변동성을 약화시키므로, 과매매를 판단하는 기준도 조정할 필요가 있다. 전략은 사용자 정의된 과매선52과 과매선48을 설정한다. 과중된 RSI가 아래에서 과매선을 돌파할 때 더 많은 신호를 생성하고, 위에서 과매선에서 넘어갈 때 더 적은 신호를 생성한다.
전략적 이점
- 혁신적이고, 연장된 주기를 통해 새로운 거래 방법을 개척합니다.
- 가짜 신호를 크게 줄이고 안정성을 높일 수 있습니다.
- 다양한 시장에 맞게 사용자 정의 가능한 오버 바이 오버 세일 값
- 을 심어서 수익률을 높일 수 있습니다.
전략적 위험
- 너무 긴 주기는 단선 기회를 놓칠 수 있습니다.
- 입학 기회를 기다려야 합니다.
- 오버 바이 오버 세일 미지수 설정이 손실을 증가시킬 수 있습니다.
- 리베이트의 위험
해결책:
- 거래 주기를 적절히 단축하고 거래 빈도를 늘리십시오.
- “그곳에 있는 모든 사람들은 이 곳에 있는 모든 사람들을 알고 있습니다”.
- 다른 시장 환경에 적응하기 위해 절감 매개 변수를 최적화
- 막대한 손실을 방지하기 위해 스톱포인트를 설정하세요.
전략 최적화 방향
- RSI의 변수를 최적화하여 최적의 주기 조합을 찾습니다.
- 다양한 SMA 평준화 주기 변수를 테스트합니다.
- 시장에 맞는 과매매의 최적화
- 단편적 손실을 통제하기 위한 전략
요약하다
느린 RSI 과잉 구매 과잉 판매 전략은 주기를 연장하고 평행선을 사용하여 변동성을 억제하는 방식으로 새로운 거래 아이디어를 성공적으로 개척했습니다. 이 전략은 파라미터를 최적화하고 위험을 통제하는 경우 안정적이고 효율적인 초과 수익을 얻을 것으로 예상됩니다.
전략 소스 코드
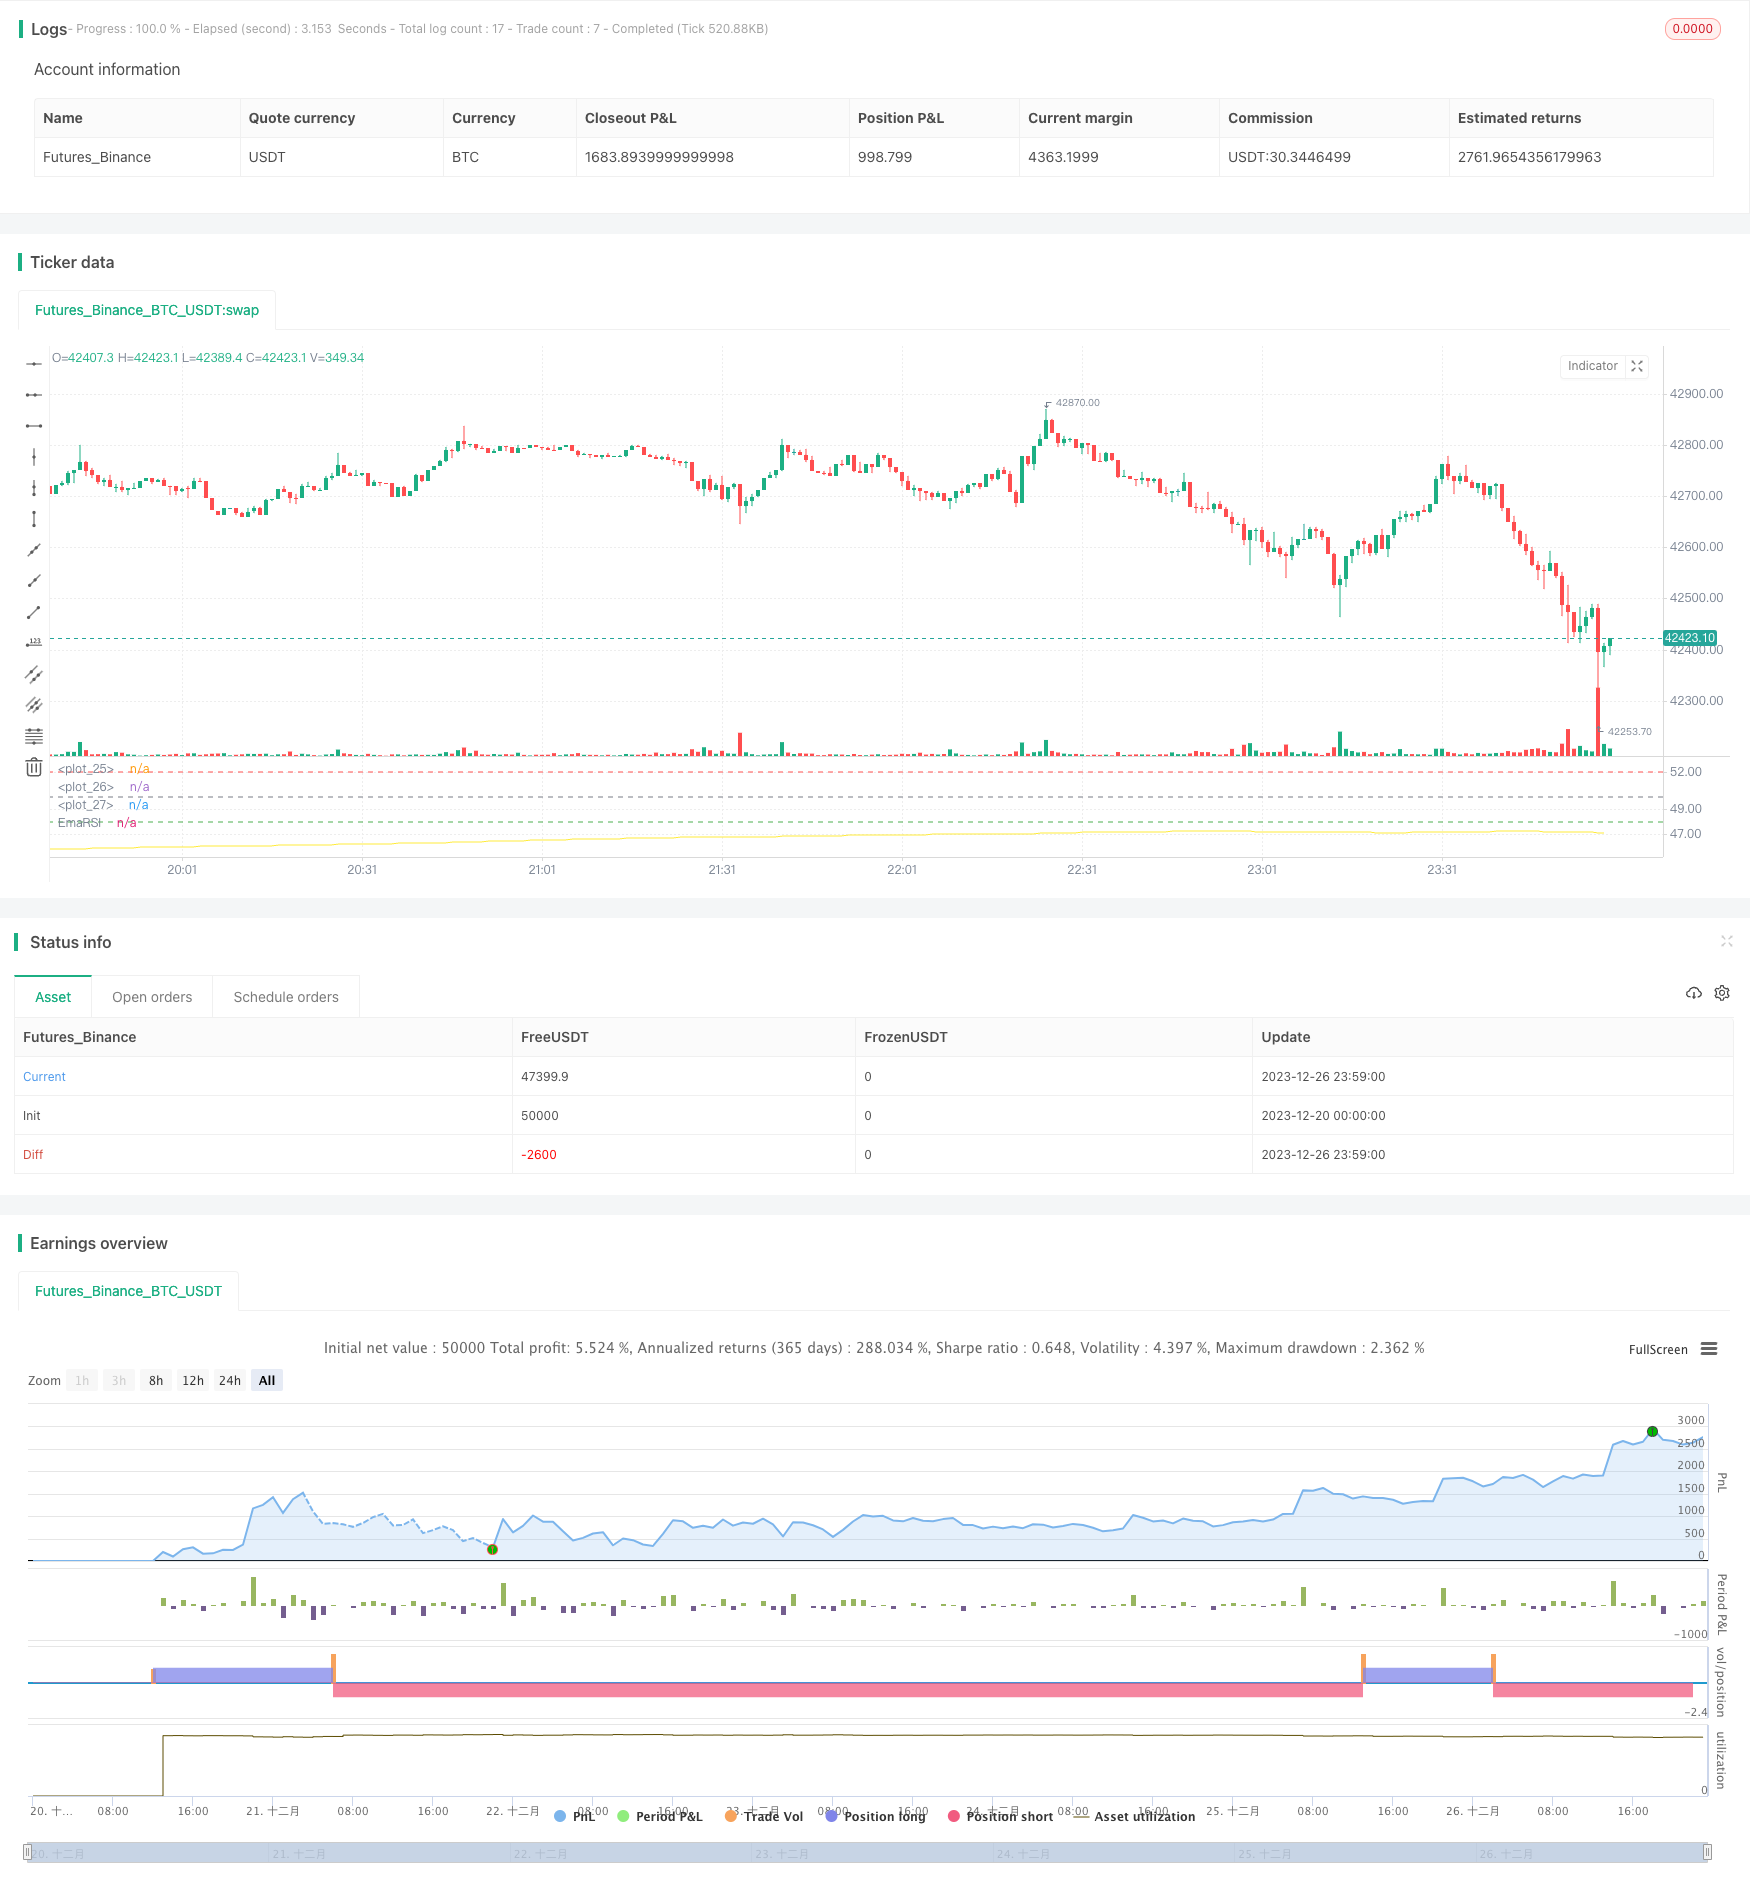
/*backtest
start: 2023-12-20 00:00:00
end: 2023-12-27 00:00:00
period: 1m
basePeriod: 1m
exchanges: [{"eid":"Futures_Binance","currency":"BTC_USDT"}]
*/


// Wilder was a very influential man when it comes to TA. However, I'm one to always try to think outside the box.
// While Wilder recommended that the RSI be used only with a 14 bar lookback period, I on the other hand think there is a lot to learn from RSI if one simply slows down the lookback period
// Same applies for MACD.
// Every market has its dynmaics. So don't narrow your mind by thinking my source code input levels are the only levels that work.
// Since the long lookback period weakens the plot volatility, again, one must think outside the box when trying to guage overbought and oversold levels.

// Good luck and don't bash me if some off-the-wall FA spurned divergence causes you to lose money.
// And NO this doesn't repaint and I won't answer those who ask.
//@version=4

strategy("SLOW RSI OB/OS Strategy", overlay=false)
price = input(ohlc4, title="Price Source")
len = input(500, minval=1, step=5,  title="RSI Length")
smoother = input(250, minval=1, step=5, title="RSI SMA")
up = rma(max(change(price), 0), len)
down = rma(-min(change(price), 0), len)
rsi = down == 0 ? 100 : up == 0 ? 0 : 100 - (100 / (1 + up / down))
EmaRSI = ema(rsi,smoother)
plot(EmaRSI, title="EmaRSI", style=line, linewidth=1, color=yellow)


OB = input(52, step=0.1)
OS = input(48, step=0.1)
hline(OB, linewidth=1, color=red)
hline(OS,linewidth=1, color=green)
hline(50,linewidth=1, color=gray)


long = change(EmaRSI) > 0 and EmaRSI <= 50 and crossover(EmaRSI, OS)
short = change(EmaRSI) < 0 and EmaRSI >= 50 and crossunder(EmaRSI, OB)


strategy.entry("Long", strategy.long, when=long) //_signal or long) //or closeshort_signal)
strategy.entry("Short", strategy.short, when=short) //_signal or short) // or closelong_signal)

// If you want to try to play with exits you can activate these!

//closelong = crossunder(EmaRSI, 0) //or crossunder(EmaRSI, OS)
//closeshort = crossover(EmaRSI, 0) //or crossover(EmaRSI, OB)

//strategy.close("Long", when=closelong)
//strategy.close("Short", when=closeshort)