개요
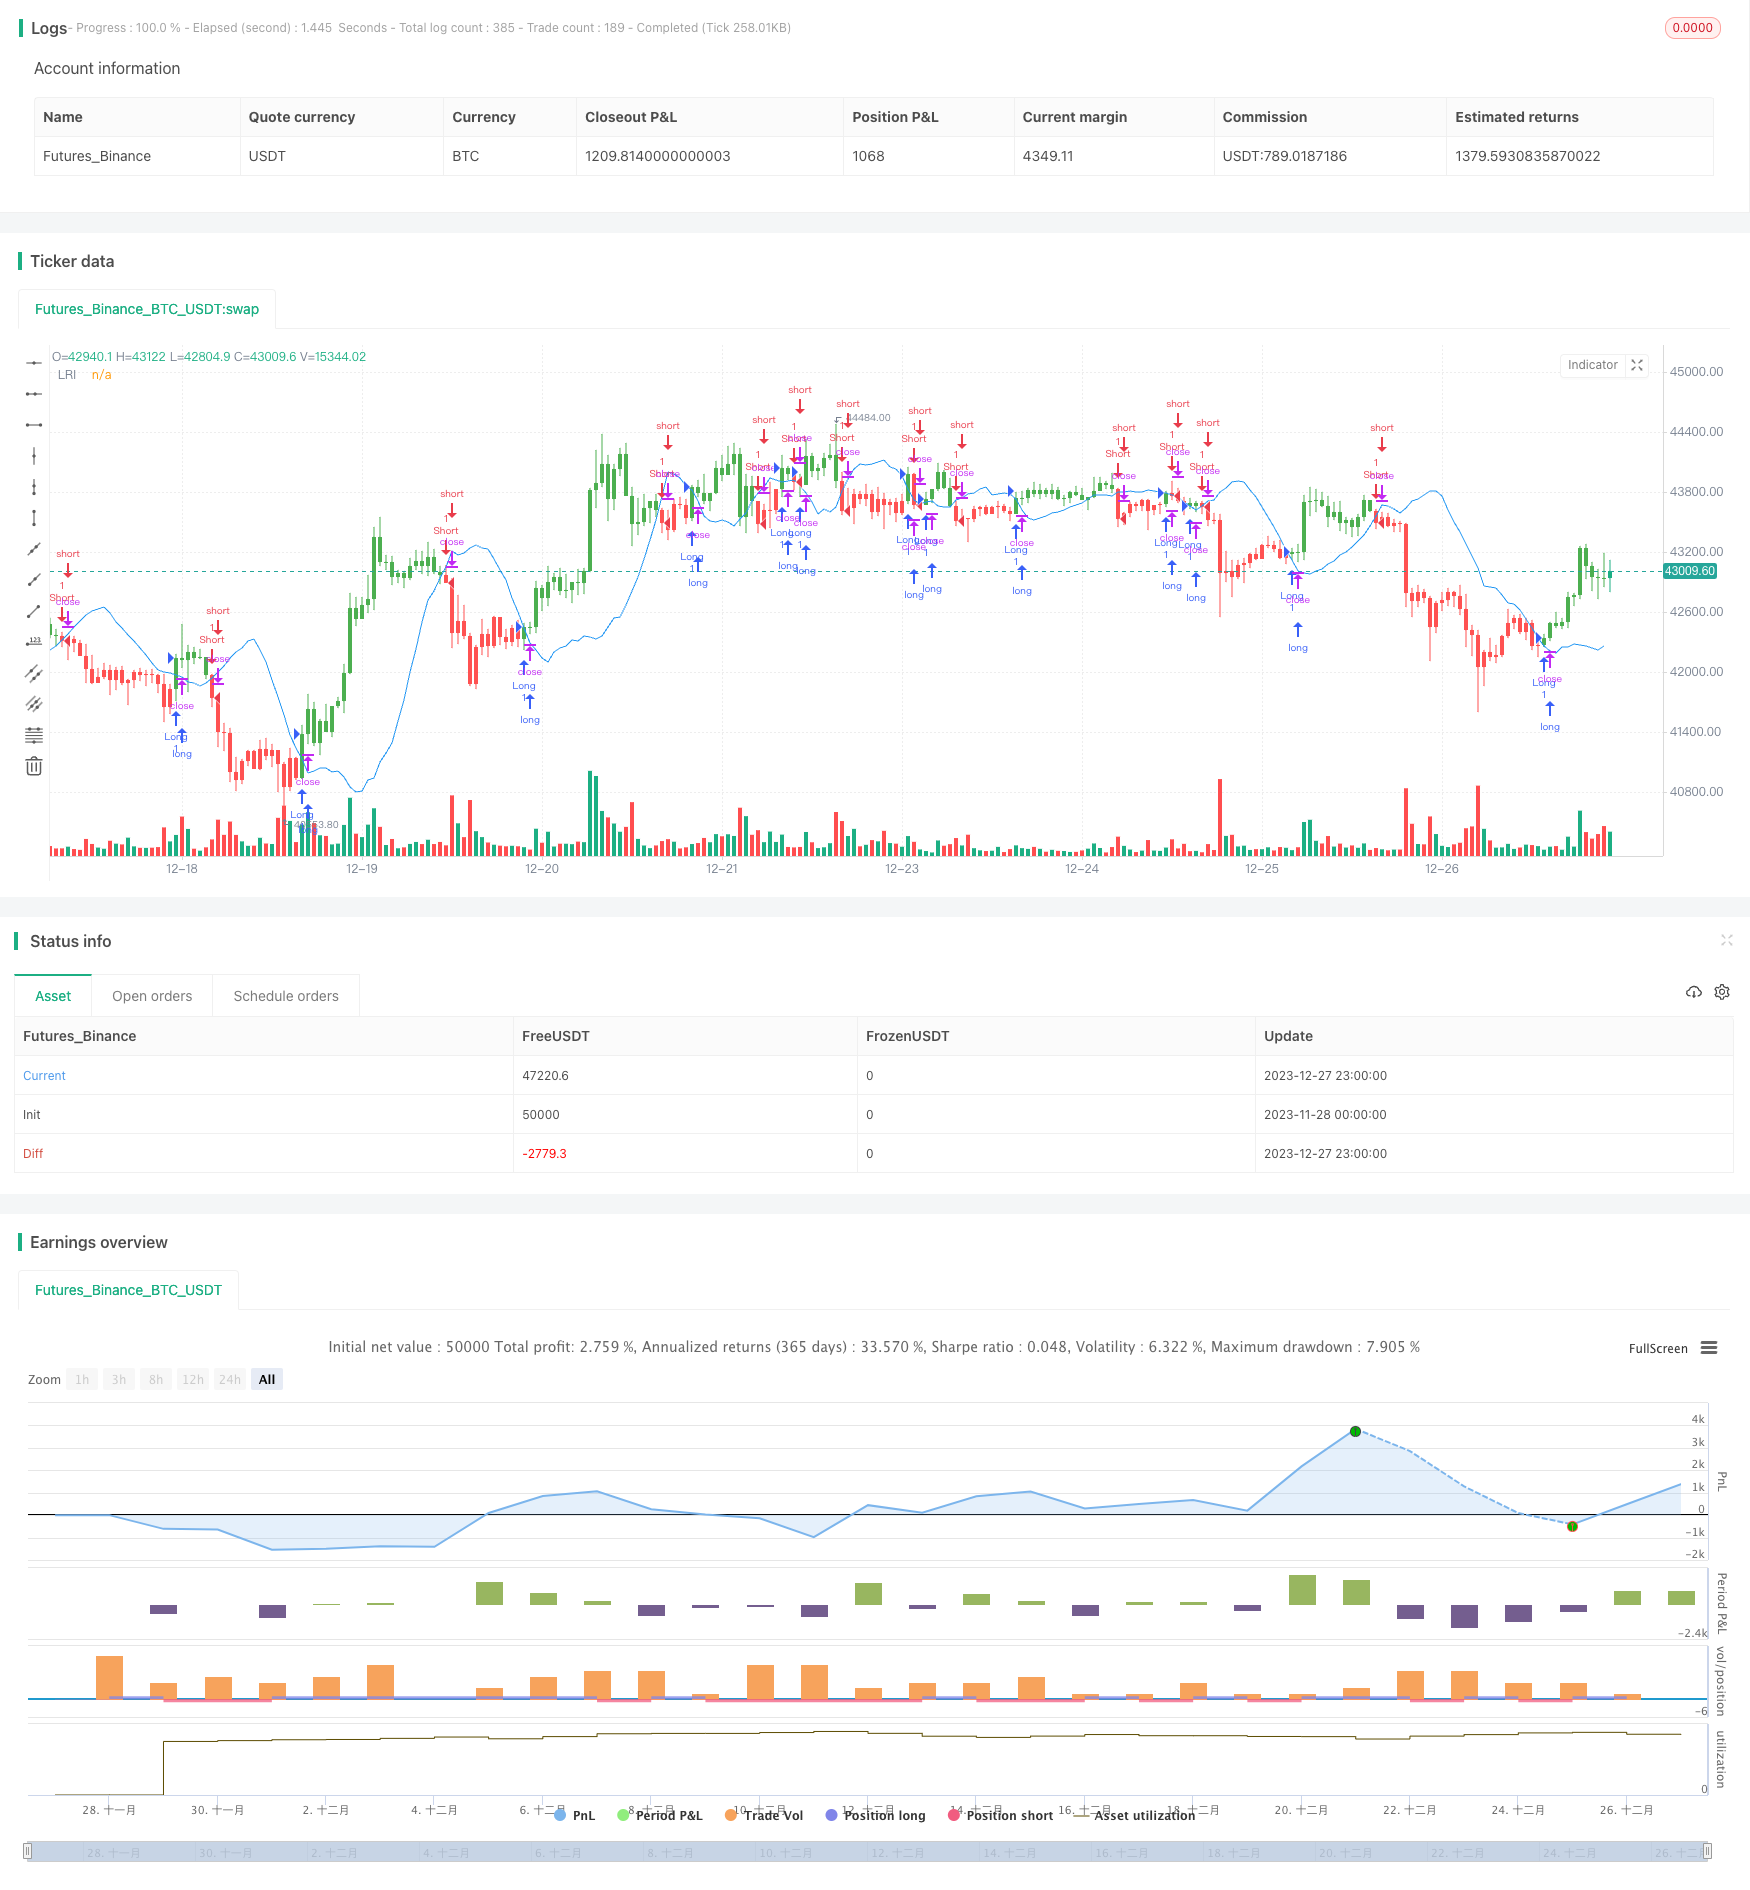
이 전략은 선형 회귀 기술을 사용하여 선형 회귀 차단점을 계산하고 그것을 구매/판매 신호로 사용하여 양적 거래 전략을 구축한다. 이 전략은 주식 가격의 시간 순서를 분석하여 선형 회귀 트렌드 라인을 조립하고, 선형 회귀 차단점을 사용하여 가격이 과대 평가되거나 과소 평가되었는지 판단하여 신호 거래를 생성한다.
전략 원칙
선형 회귀 차단점은 시간 시리즈 X값이 0일 때 Y값 (일반적으로 가격) 의 예측값을 나타냅니다. 이 전략은 종결값을 소스 서열로 사용하여 Langth 파라미터를 미리 설정하여 가장 최근의 Length 날의 선형 회귀 차단점을 계산합니다. 종결값이 xLRI보다 높을 때 더하고, 종결값이 xLRI보다 낮을 때 공백합니다.
구체적인 계산 공식은 다음과 같습니다:
xX = Length *(Length - 1)* 0.5
xDivisor = xX *xX - Length* Length *(Length - 1) *(2 * Length - 1) / 6
xXY = Σ(i *收盘价[i]),i从0到Length-1
xSlope = (Length *xXY - xX* Σ(收盘价, Length))/ xDivisor
xLRI = (Σ(收盘价, Length) - xSlope * xX) / Length
이러한 계산을 통해, 가장 최근의 트일 (Length day) 의 선형 회귀 차단점 xLRI를 얻을 수 있다. 전략은 가격의 상승과 하락을 판단하여 거래 신호를 생성한다.
전략적 이점
이 전략은 다음과 같은 장점을 가지고 있습니다.
- 선형 회귀 기술을 사용하여 가격에 대한 예측 능력과 추세를 판단하는 능력을 갖는다.
- 파라미터가 적고, 모델은 단순하고, 이해하기 쉽고, 구현하기 쉽다.
- 사용자 정의 변수 Length adaptive 정책 유연성을 조정한다.
위험과 해결책
이 전략에는 몇 가지 위험도 있습니다.
- 선형 회귀 모형은 단지 역사적 데이터에 기반한 통계적 모형이며, 미래의 가격 움직임을 예측할 수 있는 능력이 제한되어 있다.
- 만약 회사의 기본이 크게 변하면, 선형 회귀 적합성의 결과는 무효가 될 수 있다.
- 변수 Length가 잘못 설정되면 과복합이 발생할 수 있습니다.
대책:
- 알맞게 줄여서 LENGTH 파라미터를 사용해서 오버피칭을 방지한다.
- 회사의 근본적인 변화에 주의를 기울이고, 필요한 경우 인적 개입으로 지점을 폐쇄한다.
- 자율변수인 Length를 사용하여 시장 상황에 따라 동적으로 조정한다.
전략 최적화 방향
이 정책은 다음과 같은 부분에서 최적화 될 수 있습니다.
- 단독 손실을 통제하기 위해 손해 방지 장치를 추가하십시오.
- 다른 지표와 결합하여 포트폴리오 전략을 수립하여 안정성을 높인다.
- 추가된 변수는 최적화 모듈에 적응하여 Length 변수가 동적으로 변하도록 한다.
- 포지션 제어 모듈을 추가하여 과잉 거래를 방지합니다.
요약하다
이 전략은 선형 회귀 차단점을 기반으로 간단한 양적 거래 전략을 구축한다. 전반적으로 이 전략은 경제적 가치가 있지만 주의해야 할 위험도 있다. 지속적인 최적화를 통해 전략의 안정성과 수익성을 더욱 높일 수 있다.
전략 소스 코드
/*backtest
start: 2023-11-28 00:00:00
end: 2023-12-28 00:00:00
period: 1h
basePeriod: 15m
exchanges: [{"eid":"Futures_Binance","currency":"BTC_USDT"}]
*/

//@version=2
////////////////////////////////////////////////////////////
//  Copyright by HPotter v1.0 21/03/2018
// Linear Regression Intercept is one of the indicators calculated by using the
// Linear Regression technique. Linear regression indicates the value of the Y
// (generally the price) when the value of X (the time series) is 0. Linear
// Regression Intercept is used along with the Linear Regression Slope to create
// the Linear Regression Line. The Linear Regression Intercept along with the Slope
// creates the Regression line.
//
// You can change long to short in the Input Settings
// WARNING:
//  - For purpose educate only
//  - This script to change bars colors.
////////////////////////////////////////////////////////////
strategy(title="Line Regression Intercept Backtest", overlay = true)
Length = input(14, minval=1)
xSeria = input(title="Source", defval=close)
reverse = input(false, title="Trade reverse")
xX = Length * (Length - 1) * 0.5
xDivisor = xX * xX - Length * Length * (Length - 1) * (2 * Length - 1) / 6
xXY = 0
for i = 0 to Length-1
	xXY := xXY + (i * xSeria[i])
xSlope = (Length * xXY - xX * sum(xSeria, Length)) / xDivisor
xLRI = (sum(xSeria, Length) - xSlope * xX) / Length
pos = iff(close > xLRI, 1,
       iff(close < xLRI, -1, nz(pos[1], 0)))
possig = iff(reverse and pos == 1, -1,
          iff(reverse and pos == -1, 1, pos))
if (possig == 1)
    strategy.entry("Long", strategy.long)
if (possig == -1)
    strategy.entry("Short", strategy.short)
barcolor(possig == -1 ? red: possig == 1 ? green : blue )
plot(xLRI, color=blue, title="LRI")