개요
이 전략은 두 개의 EMA 지표의 금 포크 사다 포크를 사용하여 현재 트렌드 방향을 판단하고 RSI 지표와 결합하여 매매 기회를 놓치지 않도록하는 전형적인 트렌드 추적 전략입니다.
전략 원칙
- 10기 및 20기 EMA 평균선을 계산하고, 각각 ma00 및 ma01으로 명명
- ma00 위에 ma01을 입으면 구매 신호가 발생
- 마00 아래 마01을 통과할 때 팔기 신호를 생성
- 또한, ma00이 ma01보다 높을 때, 구매 신호가 생성됩니다.
- 마찬가지로, ma00이 ma01보다 낮으면 팔라는 신호가 발생합니다.
- 이 두 가지 판단으로, 일부 매매점을 놓치지 않도록 할 수 있습니다.
- 스톱 로즈와 스톱 스 가격을 설정하여 리스크를 제어합니다.
우위 분석
- 이중 EMA 판단을 사용하여 가짜 돌파구를 효과적으로 필터링할 수 있습니다.
- 이중 조건 판단
- 손해 차단 설정은 위험 관리에 도움이 됩니다.
위험 분석
- 이중 EMA 평행선 전략은 트렌드 추적 전략으로, 변동 상황에서는 자주 거래되며, 손실이 쉽다.
- 트렌드 전환점을 정확하게 파악하지 못해 손실이 발생할 수 있습니다.
- 부적절한 스톱포인트 설정으로 손실이 커질 수 있습니다.
최적화 방향
- 적절한 EMA 주기를 최적화하여 최적의 변수 조합을 찾을 수 있습니다.
- 다른 지표로 판단하여 전략의 안정성을 높일 수 있습니다.
- 동적 스톱로드를 설정하여 시장의 변동에 따라 실시간으로 스톱로드를 조정할 수 있습니다.
전략 소스 코드
/*backtest
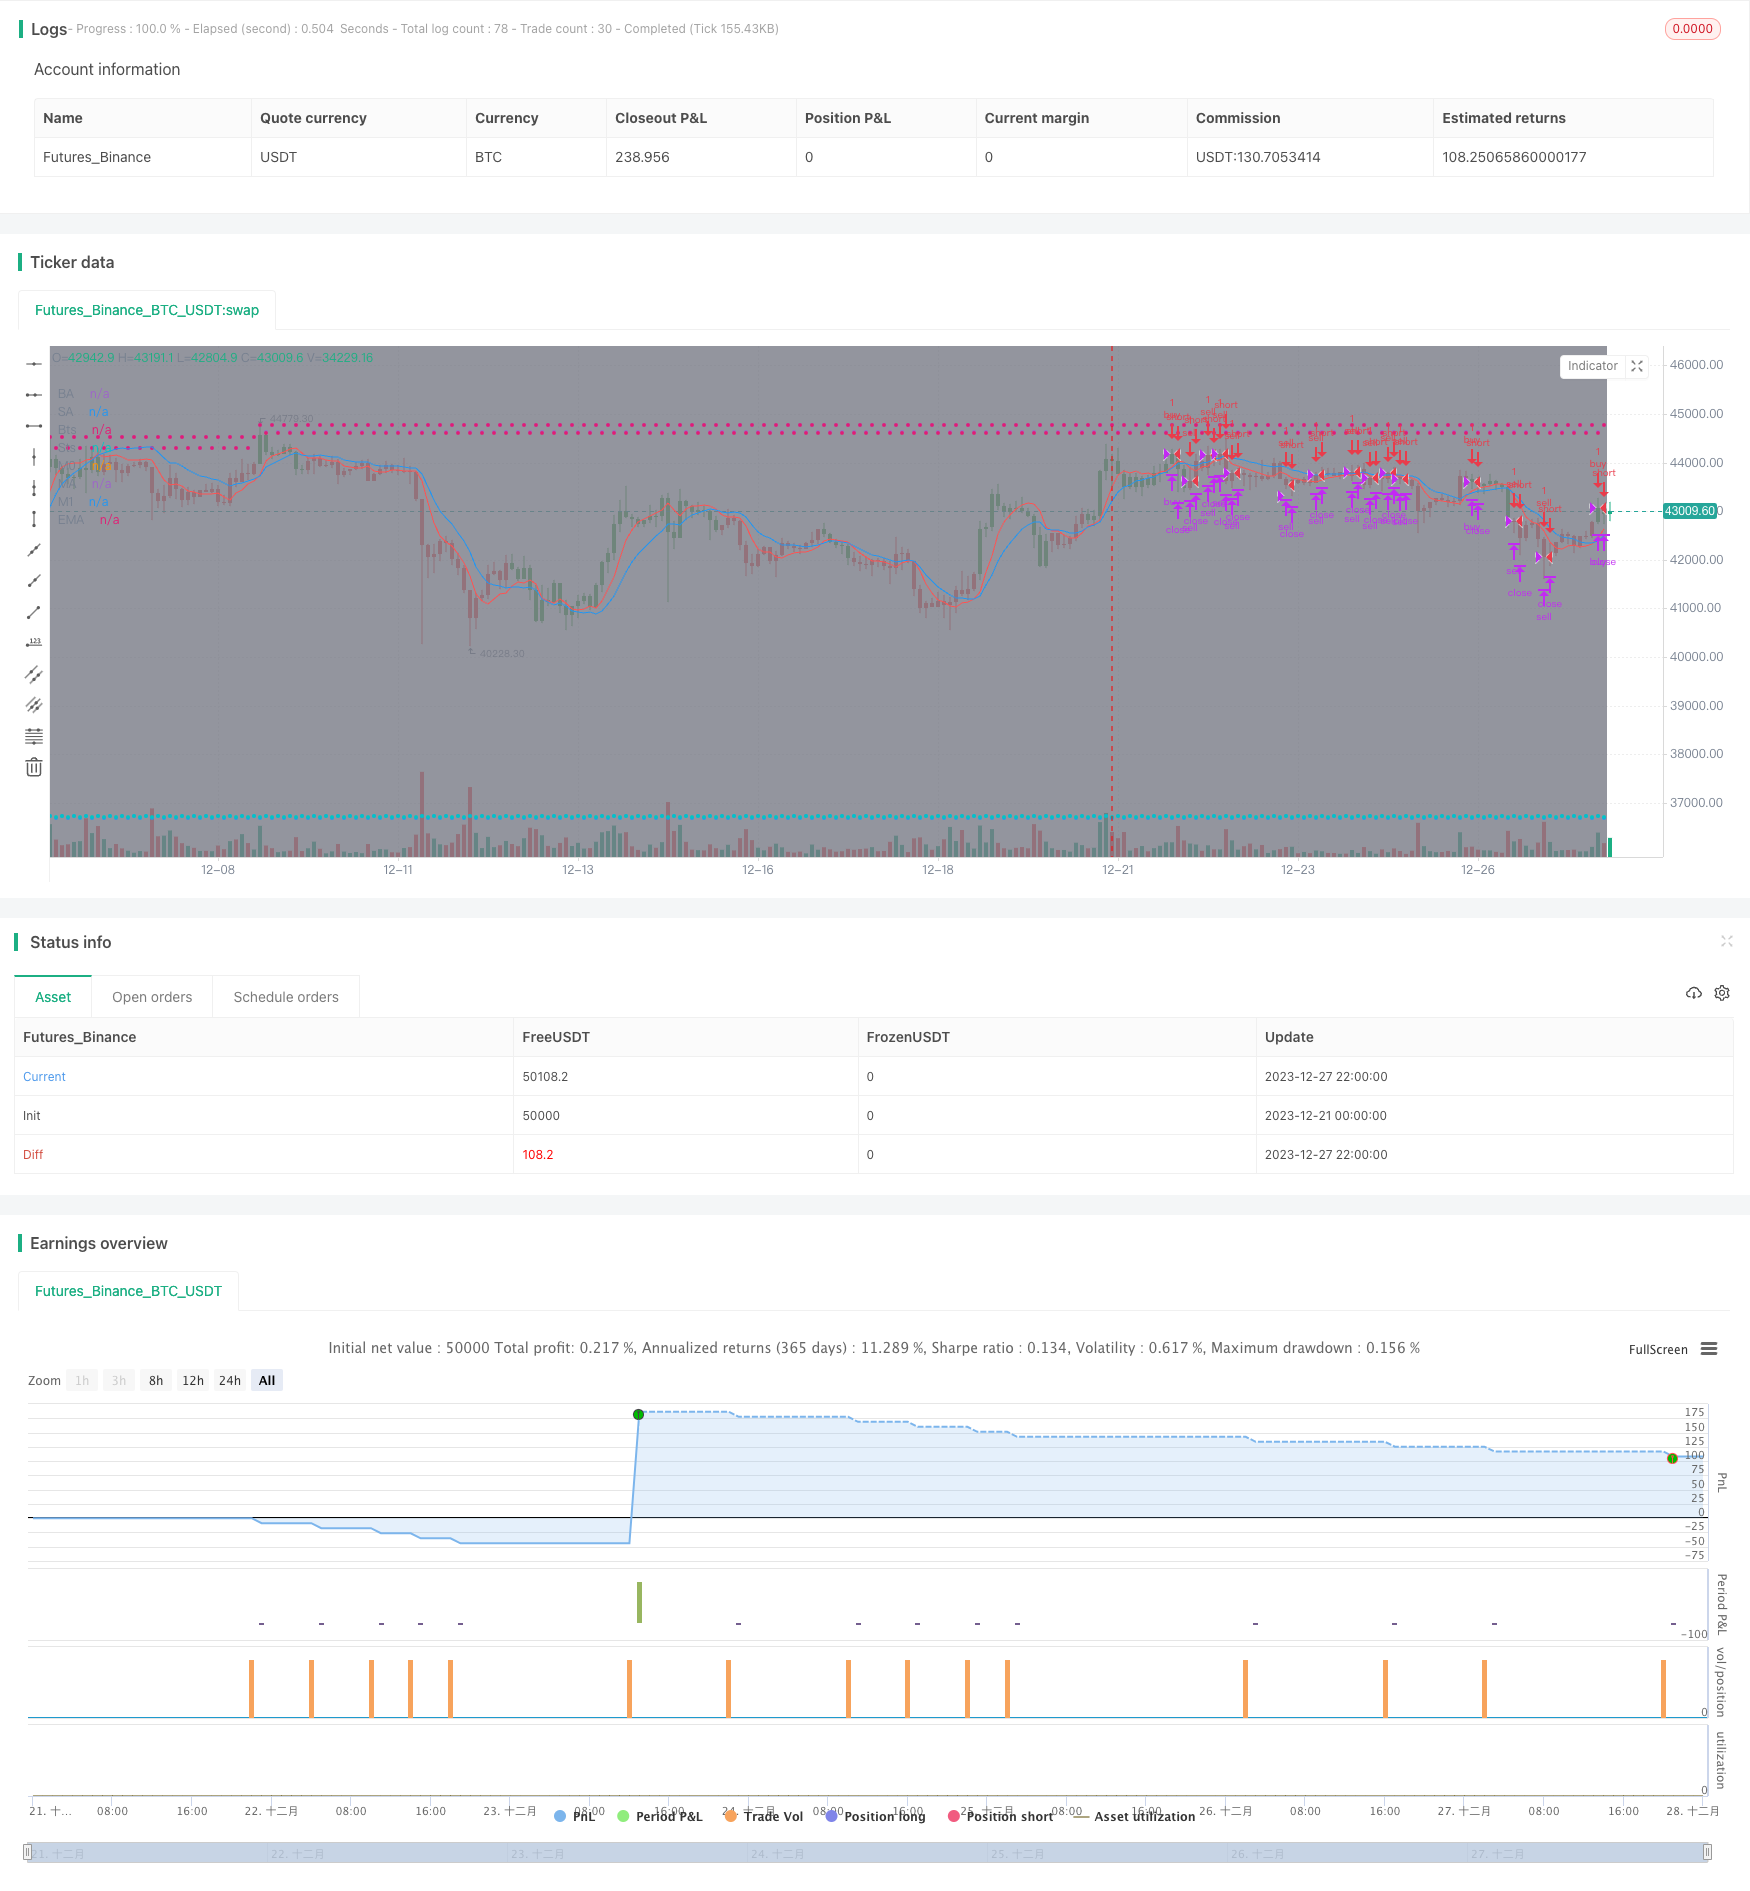
start: 2023-12-21 00:00:00
end: 2023-12-28 00:00:00
period: 2h
basePeriod: 15m
exchanges: [{"eid":"Futures_Binance","currency":"BTC_USDT"}]
*/
//@version=4
strategy(title='[STRATEGY][RS]MicuRobert EMA cross V1', shorttitle='S', overlay=true, pyramiding=0, initial_capital=100000)
USE_TRADESESSION = input(title='Use Trading Session?', type=bool, defval=true)
USE_TRAILINGSTOP = input(title='Use Trailing Stop?', type=bool, defval=true)
trade_session = input(title='Trade Session:', defval='0400-1500', confirm=false)
istradingsession = not USE_TRADESESSION ? false : not na(time('1', trade_session))
bgcolor(istradingsession?color.gray:na)
trade_size = input(title='Trade Size:', type=float, defval=1)
tp = input(title='Take profit in pips:', type=float, defval=55.0) * (syminfo.mintick*10)
sl = input(title='Stop loss in pips:', type=float, defval=11.0) * (syminfo.mintick*10)
ma_length00 = input(title='EMA length:', defval=10)
ma_length01 = input(title='DEMA length:', defval=20)
price = input(title='Price source:', defval=open)
// ||--- NO LAG EMA, Credit LazyBear: ---||
f_LB_zlema(_src, _length)=>
_ema1=ema(_src, _length)
_ema2=ema(_ema1, _length)
_d=_ema1-_ema2
_zlema=_ema1+_d
// ||-------------------------------------||
ma00 = f_LB_zlema(price, ma_length00)
ma01 = f_LB_zlema(price, ma_length01)
plot(title='M0', series=ma00, color=black)
plot(title='M1', series=ma01, color=black)
isnewbuy = change(strategy.position_size)>0 and change(strategy.opentrades)>0
isnewsel = change(strategy.position_size)<0 and change(strategy.opentrades)>0
buy_entry_price = isnewbuy ? price : buy_entry_price[1]
sel_entry_price = isnewsel ? price : sel_entry_price[1]
plot(title='BE', series=buy_entry_price, style=circles, color=strategy.position_size <= 0 ? na : aqua)
plot(title='SE', series=sel_entry_price, style=circles, color=strategy.position_size >= 0 ? na : aqua)
buy_appex = na(buy_appex[1]) ? price : isnewbuy ? high : high >= buy_appex[1] ? high : buy_appex[1]
sel_appex = na(sel_appex[1]) ? price : isnewsel ? low : low <= sel_appex[1] ? low : sel_appex[1]
plot(title='BA', series=buy_appex, style=circles, color=strategy.position_size <= 0 ? na : teal)
plot(title='SA', series=sel_appex, style=circles, color=strategy.position_size >= 0 ? na : teal)
buy_ts = buy_appex - sl
sel_ts = sel_appex + sl
plot(title='Bts', series=buy_ts, style=circles, color=strategy.position_size <= 0 ? na : red)
plot(title='Sts', series=sel_ts, style=circles, color=strategy.position_size >= 0 ? na : red)
buy_cond1 = crossover(ma00, ma01) and (USE_TRADESESSION ? istradingsession : true)
buy_cond0 = crossover(price, ma00) and ma00 > ma01 and (USE_TRADESESSION ? istradingsession : true)
buy_entry = buy_cond1 or buy_cond0
buy_close = (not USE_TRAILINGSTOP ? false : low <= buy_ts) or high>=buy_entry_price+tp//high>=last_traded_price + tp or low<=last_traded_price - sl //high >= hh or
sel_cond1 = crossunder(ma00, ma01) and (USE_TRADESESSION ? istradingsession : true)
sel_cond0 = crossunder(price, ma00) and ma00 < ma01 and (USE_TRADESESSION ? istradingsession : true)
sel_entry = sel_cond1 or sel_cond0
sel_close = (not USE_TRAILINGSTOP ? false : high >= sel_ts) or low<=sel_entry_price-tp//low<=last_traded_price - tp or high>=last_traded_price + sl //low <= ll or
strategy.entry('buy', long=strategy.long, qty=trade_size, comment='buy', when=buy_entry)
strategy.close('buy', when=buy_close)
strategy.entry('sell', long=strategy.short, qty=trade_size, comment='sell', when=sel_entry)
strategy.close('sell', when=sel_close)
//What i add .!
pos = iff(ma01 < ma00 , 1,
iff(ma01 > ma00 , -1, nz(pos[1], 0)))
barcolor(pos == -1 ? red: pos == 1 ? green : blue)
plot(ma00, color=red, title="MA")
plot(ma01, color=blue, title="EMA")