개요
이 전략은 트리플 확인 메커니즘을 사용하여 거래 신호를 생성합니다. 즉, 동력 지표는 시장 추세가 강하다는 것을 확인하고, 슈퍼 트렌드 지표는 트렌드 방향을 확인하고, EMA 지표는 트렌드 방향을 확인하는 추가 검증입니다. 이 전략은 이 세 가지 지표가 조건을 충족하면만 거래 신호를 생성합니다.
전략 원칙
동력 지표 (Momentum RSI)
동력 RSI 지표는 시장 추세의 강도를 판단하는 데 사용됩니다. 60보다 큰 판독은 시장 추세가 강하다는 것을 나타냅니다.
거래 신호는 격렬한 황소 시장과 곰 시장에서만 발생한다.
슈퍼 트렌드 분석
슈퍼 트렌드 라인은 시장의 추세를 나타냅니다. 가격이 슈퍼 트렌드 라인을 돌파했을 때만 포지션을 고려하십시오.
가격이 아래에서 위로 슈퍼 트렌드 라인을 돌파 할 때, 다목적 트렌드로 변환; 가격이 위에서 아래로 돌파 할 때, 허공 트렌드로 변환.
EMA 전략
- EMA와 그 보조 트렌드 라인은 트렌드 방향을 확인하는 데 사용됩니다. 구매 신호는 EMA가 보조 트렌드 라인을 상향으로 돌파했을 때만 나타납니다. 공중 신호는 반대로 납니다.
이 세가지 지표가 동시에 포지션 구축 조건에 부합하는 경우에만 진정한 거래 신호가 발송됩니다. 이것은 가짜 신호의 수를 크게 줄이고 전략의 안정성을 향상시킵니다.
우위 분석
이 전략은 매우 높은 안정성과 수익률을 가지고 있다. 주요 장점은 다음과 같다:
다중 확인 메커니즘, 효율적인 소음 필터링, 높은 확률 거래만 선택한다.
슈퍼 트렌드 라인 동적 추적 스톱 로즈, 효과적인 위험 제어
트렌드 강도를 판단하고, 강한 트렌드에서만 거래하여 추가적인 위험을 피하십시오.
EMA 지표 추가 검증은 거래 방향이 올바른지 확인합니다.
완전히 파라미터화되어 있으며, 모든 거래자가 필요에 따라 사용자 정의 할 수 있습니다.
위험 분석
이 전략의 주요 위험은 비정상적 돌파구로 인한 잘못된 거래 신호이다. 주요 위험과 해결 방법은 다음과 같다:
가짜 침입 위험: 침입 검증 메커니즘을 강화한다.
진동 범위가 커질 위험: 적절히 조정된 막상 범위.
트렌드 리버스 위험: 지주 기간을 단축하고 적시에 손실을 막는다.
최적화 방향
이 전략은 다음과 같은 방향으로 최적화될 수 있습니다.
최적화 매개 변수: 지표 매개 변수를 조정하여 더 많은 품종에 적합하도록 한다.
필터를 추가: 더 많은 지표와 함께 신호 품질을 향상 시키십시오.
복합 전략: 다른 전략과 결합하여 장점을 활용한다.
동적 조정: 시장 환경에 따라 매개 변수를 자동으로 조정한다.
기계 학습: 알고리즘을 사용하여 최적의 변수를 자동으로 찾습니다.
요약하다
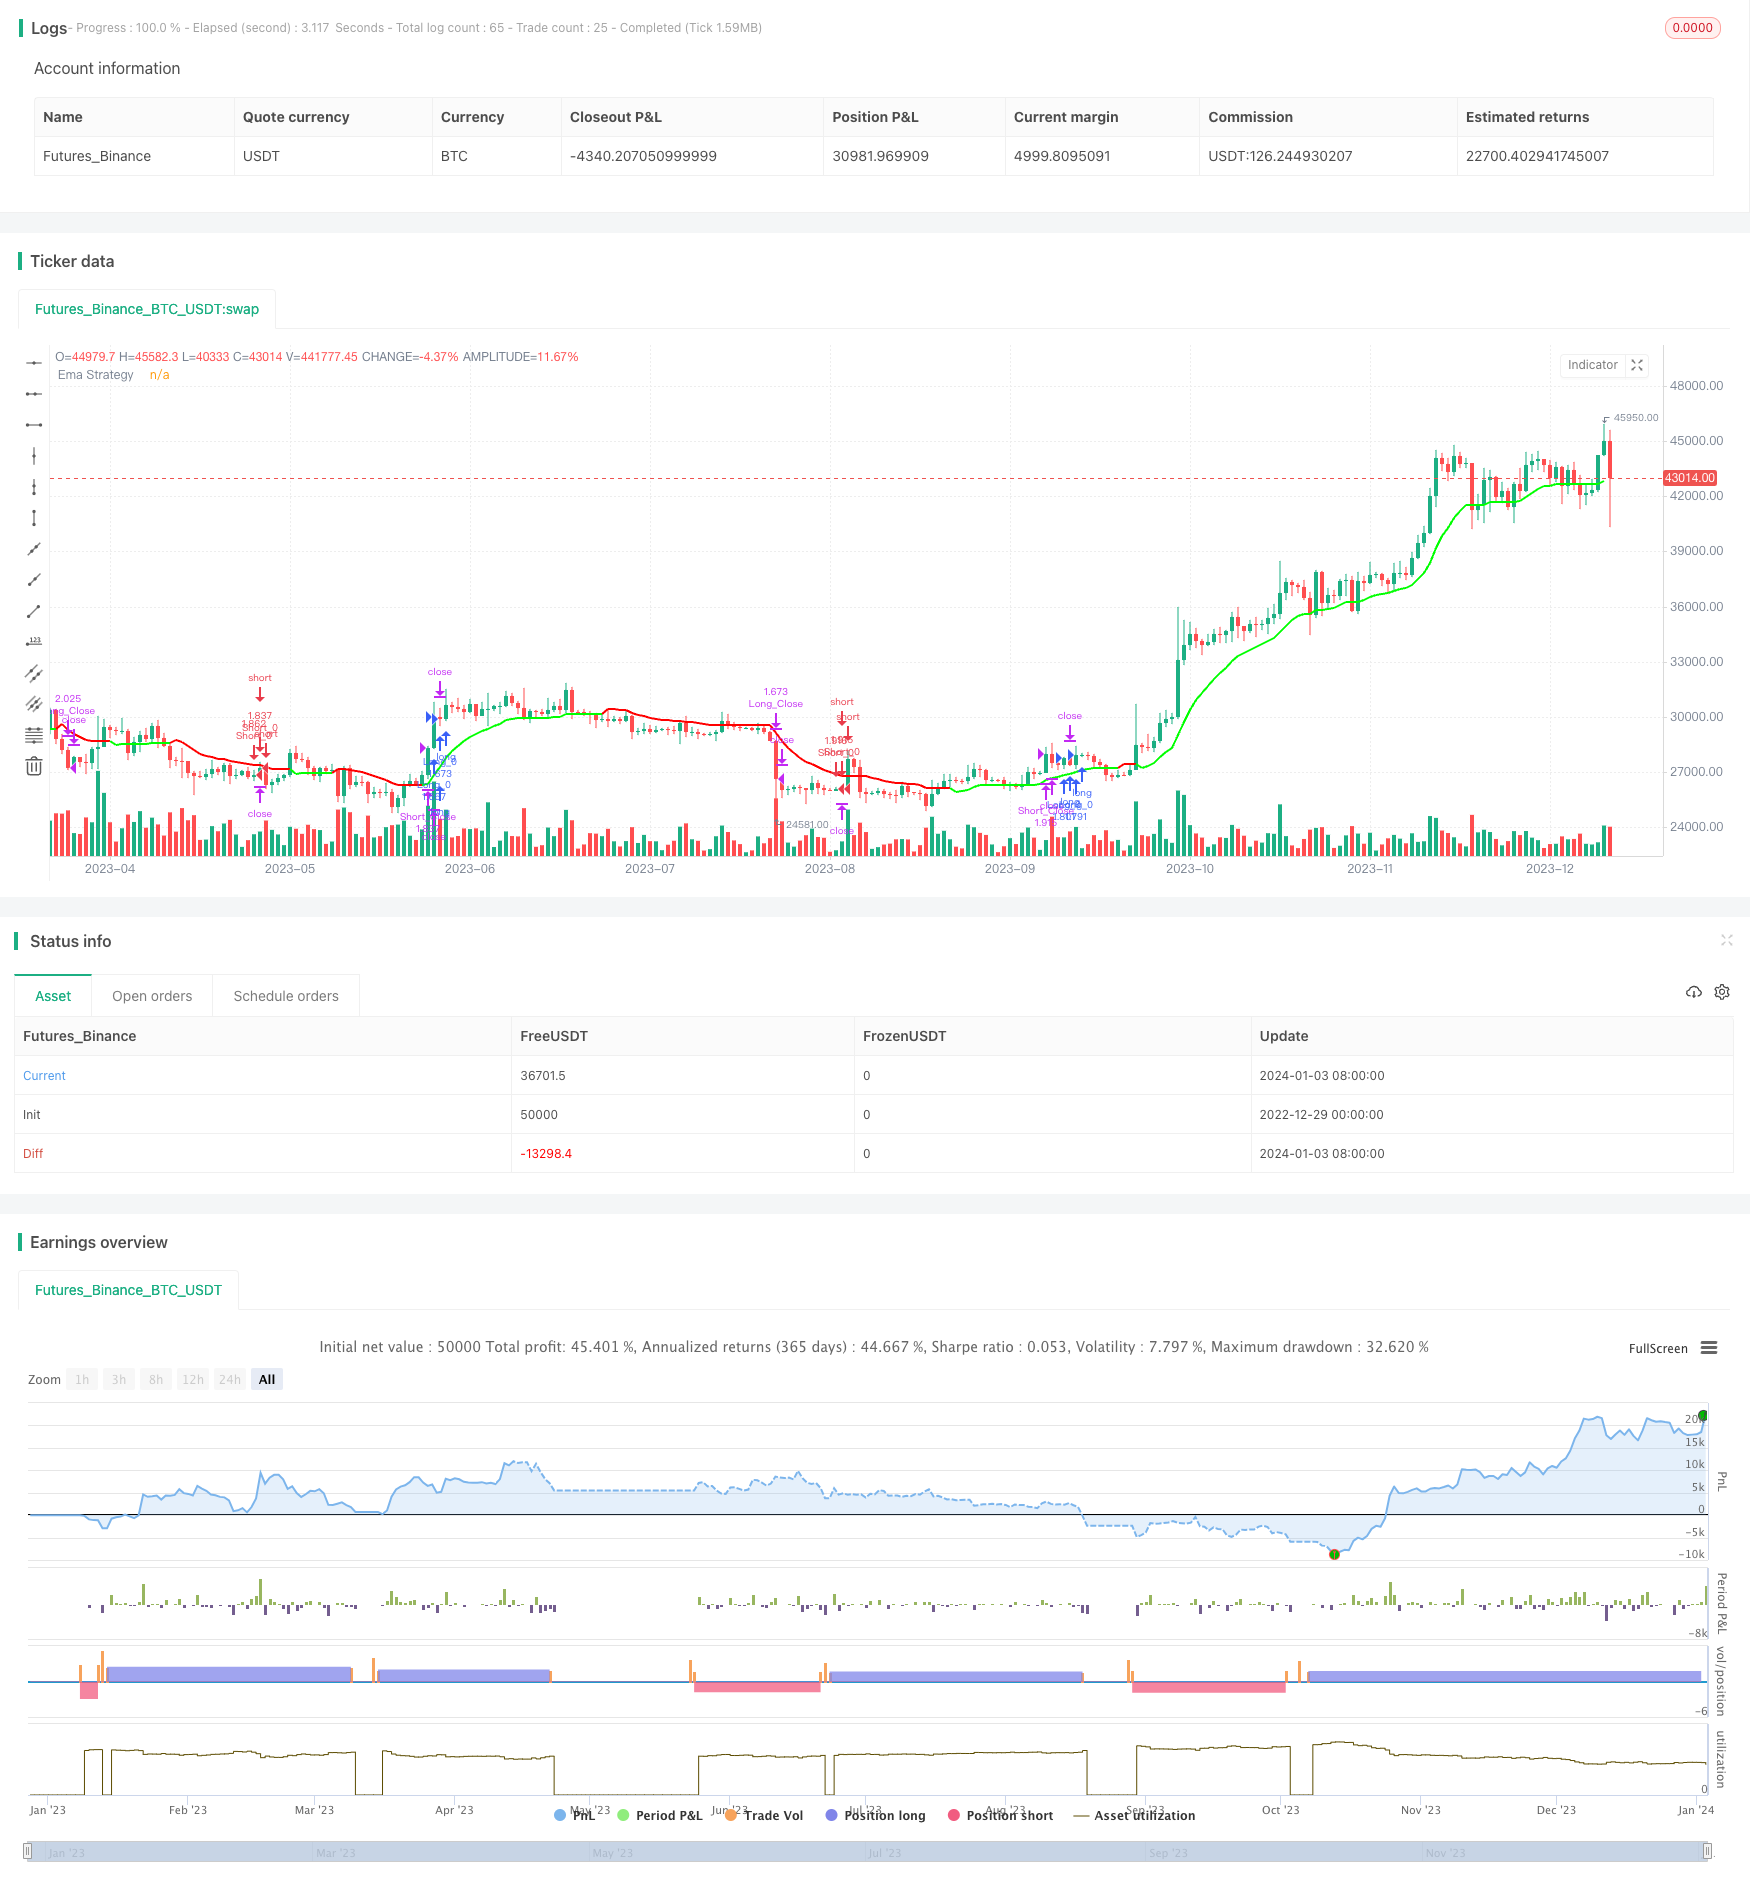
이 전략은 동적 지표, 슈퍼 트렌드 및 EMA를 효과적으로 결합하여 여러 번 확인 된 높은 확률 거래 전략을 구현합니다. 엄격한 브레이크 검증 메커니즘은 또한 매우 강력한 안정성을 갖습니다. 또한 매우 높은 사용자 정의 및 최적화 공간을 갖추고 있습니다.
/*backtest
start: 2022-12-29 00:00:00
end: 2024-01-04 00:00:00
period: 1d
basePeriod: 1h
exchanges: [{"eid":"Futures_Binance","currency":"BTC_USDT"}]
*/

//@version=5
strategy('The Flash-Strategy (Momentum-RSI, EMA-crossover, ATR)', shorttitle='The Flash-Strategy (Momentum-RSI, EMA-crossover, ATR)', overlay=true,initial_capital = 1000)
//// author -  Baby_whale_to_moon

// MOM Rsi indicator
group_mom_rsi = "Rsi Of Momentum "
len = input.int(10, minval=1, title="Length Mom-Rsi", group =group_mom_rsi ,tooltip = 'This ind calculate Rsi value of Momentum we use this ind to determine power of trend')
src2 = close
mom = src2 - src2[len]
rsi_mom = ta.rsi(mom, len)
mom_rsi_val = input.int(60, minval=1, title="Mom-Rsi Limit Val", group =group_mom_rsi, tooltip = "When our Mom-Rsi value more then this we open LONG or Short, with help of this indicator we we determine the status of the trend")

// Super Trend Ind
group_supertrend = "SuperTrend indicator"
atrPeriod = input(10, "ATR Length SuperTrend", group = group_supertrend)
factor = input.float(3.0, "Factor SuperTrend", step = 0.01, group = group_supertrend)

[supertrend, direction] = ta.supertrend(factor, atrPeriod)

// Ema Indicator
group_most = "Ema indicator"
src = input(close, 'Source Ema Ind',group = group_most)
AP2 = input.int(defval=12, title='Length Ema Ind', minval=1,group = group_most)
Trail1 = ta.ema(src, AP2) //Ema func
AF2 = input.float(defval=1, title='Percent Ema Ind', minval=0.1,group = group_most) / 100
SL2 = Trail1 * AF2  // Stoploss Ema
Trail2 = 0.0
iff_1 = Trail1 > nz(Trail2[1], 0) ? Trail1 - SL2 : Trail1 + SL2
iff_2 = Trail1 < nz(Trail2[1], 0) and Trail1[1] < nz(Trail2[1], 0) ? math.min(nz(Trail2[1], 0), Trail1 + SL2) : iff_1
Trail2 := Trail1 > nz(Trail2[1], 0) and Trail1[1] > nz(Trail2[1], 0) ? math.max(nz(Trail2[1], 0), Trail1 - SL2) : iff_2

//Bull = ta.barssince(Trail1 > Trail2 and close > Trail2 and low > Trail2) < ta.barssince(Trail2 > Trail1 and close < Trail2 and high < Trail2)

//TS1 = plot(Trail1, 'ExMov', style=plot.style_line, color=Trail1 > Trail2 ? color.rgb(33, 149, 243, 100) : color.rgb(255, 235, 59, 100), linewidth=2)
//TS2 = plot(Trail2, 'ema', style=plot.style_line, color=Trail1 > Trail2 ? color.rgb(76, 175, 79, 30) : color.rgb(255, 82, 82, 30), linewidth=2)
//fill(TS1, TS2, Bull  ? color.green : color.red, transp=90)


// Strategy Sett
group_strategy = "Settings of Strategy"
Start_Time = input(defval=timestamp('01 January 2000 13:30 +0000'), title='Start Time of BackTest', group =group_strategy)
End_Time = input(defval=timestamp('30 April 2030 19:30 +0000'), title='End Time of BackTest', group =group_strategy)
dollar = input.float(title='Dollar Cost Per Position* ', defval=50000, group =group_strategy)
trade_direction = input.string(title='Trade_direction', group =group_strategy, options=['LONG', 'SHORT', 'BOTH'], defval='BOTH')
v1 = input(true, title="Version 1 - Uses SL/TP Dynamically ", group =group_strategy ,tooltip = 'With this settings our stoploss price increase or decrease with price to get better PNL score')

v2 = input(false, title="Version 2 -  Uses SL/TP Statically", group =group_strategy)
v2stoploss_input = input.float(5, title='Static Stop.Loss % Val', minval=0.01, group =group_strategy)/100
v2takeprofit_input = input.float(10, title='Static Take.Prof % Val', minval=0.01, group =group_strategy)/100

v2stoploss_level_long = strategy.position_avg_price * (1 - v2stoploss_input)
v2takeprofit_level_long = strategy.position_avg_price * (1 + v2takeprofit_input)

v2stoploss_level_short = strategy.position_avg_price * (1 + v2stoploss_input)
v2takeprofit_level_short = strategy.position_avg_price * (1 - v2takeprofit_input)

group_line = "Line Settings"
show_sl_tp = input.bool(title='  Show StopLoss - TakeProf Lines',inline = "1", defval=true, group =group_line)
show_trend_line = input.bool(title='  Show Trend Line',inline = '3' ,defval=true, group =group_line)
stoploss_colour = input.color(title='StopLoss Line Colour',inline = '2' ,defval=color.rgb(255, 255, 0), group =group_line)
up_trend_line_colour = input.color(title='Up Trend line Colour',inline = '4' ,defval=color.rgb(0, 255, 0, 30), group =group_line)
down_trend_line_colour = input.color(title='Down Trend line Colour',inline = '4' ,defval=color.rgb(255, 0, 0, 30), group =group_line)

//plot(supertrend ,color = strategy.position_size > 0 and show_sl_tp ? color.rgb(255, 0, 0) :show_sl_tp ? color.rgb(0, 255, 0) : na , style = plot.style_steplinebr,linewidth = 2)
// plot(supertrend ,color = show_sl_tp and v1 ? stoploss_colour : na , style = plot.style_steplinebr,linewidth = 2)

// plot(v2stoploss_level_long ,color = strategy.position_size > 0 and show_sl_tp and v2 ? stoploss_colour : na , style = plot.style_steplinebr,linewidth = 2)
// plot(v2stoploss_level_short ,color = strategy.position_size < 0 and show_sl_tp and v2 ? stoploss_colour : na , style = plot.style_steplinebr,linewidth = 2)
// plot(v2takeprofit_level_long  ,color = strategy.position_size > 0 and show_sl_tp and v2 ? up_trend_line_colour : na , style = plot.style_steplinebr,linewidth = 2)
// plot(v2takeprofit_level_short ,color = strategy.position_size < 0 and show_sl_tp and v2 ? up_trend_line_colour : na , style = plot.style_steplinebr,linewidth = 2)


TS2 = plot(Trail2, 'Ema Strategy', style=plot.style_line, color=show_trend_line and Trail1 < Trail2 ? down_trend_line_colour : show_trend_line ? up_trend_line_colour  : na, linewidth=2)

// bgcolor(buy_signal ? color.rgb(0, 230, 119, 80) : na)
// bgcolor(sell_signal ? color.rgb(255, 82, 82, 80) : na)

Time_interval = true
buy_signal = Trail1 > Trail2 and direction < 0 and rsi_mom > mom_rsi_val and Time_interval
sell_signal =Trail1 < Trail2 and direction > 0 and rsi_mom > mom_rsi_val and Time_interval


// Strategy entries
if strategy.opentrades == 0 and buy_signal and ( trade_direction == 'LONG' or trade_direction == 'BOTH')
    strategy.entry('Long_0', strategy.long, qty=dollar / close)

if strategy.opentrades == 0 and sell_signal and ( trade_direction == 'SHORT' or trade_direction == 'BOTH')
    strategy.entry('Short_0', strategy.short, qty=dollar / close)


if close < supertrend and v1
    strategy.exit('Long_Close',from_entry = "Long_0", stop=supertrend, qty_percent=100)
if  v2 and strategy.position_size > 0
    strategy.exit('Long_Close',from_entry = "Long_0", stop=v2stoploss_level_long,limit= v2takeprofit_level_long  , qty_percent=100)

if close > supertrend and v1
    strategy.exit('Short_Close',from_entry = "Short_0", stop=supertrend, qty_percent=100)
if  v2 and strategy.position_size < 0
    strategy.exit('Short_Close',from_entry = "Short_0", stop=v2stoploss_level_short,limit= v2takeprofit_level_short ,qty_percent=100)