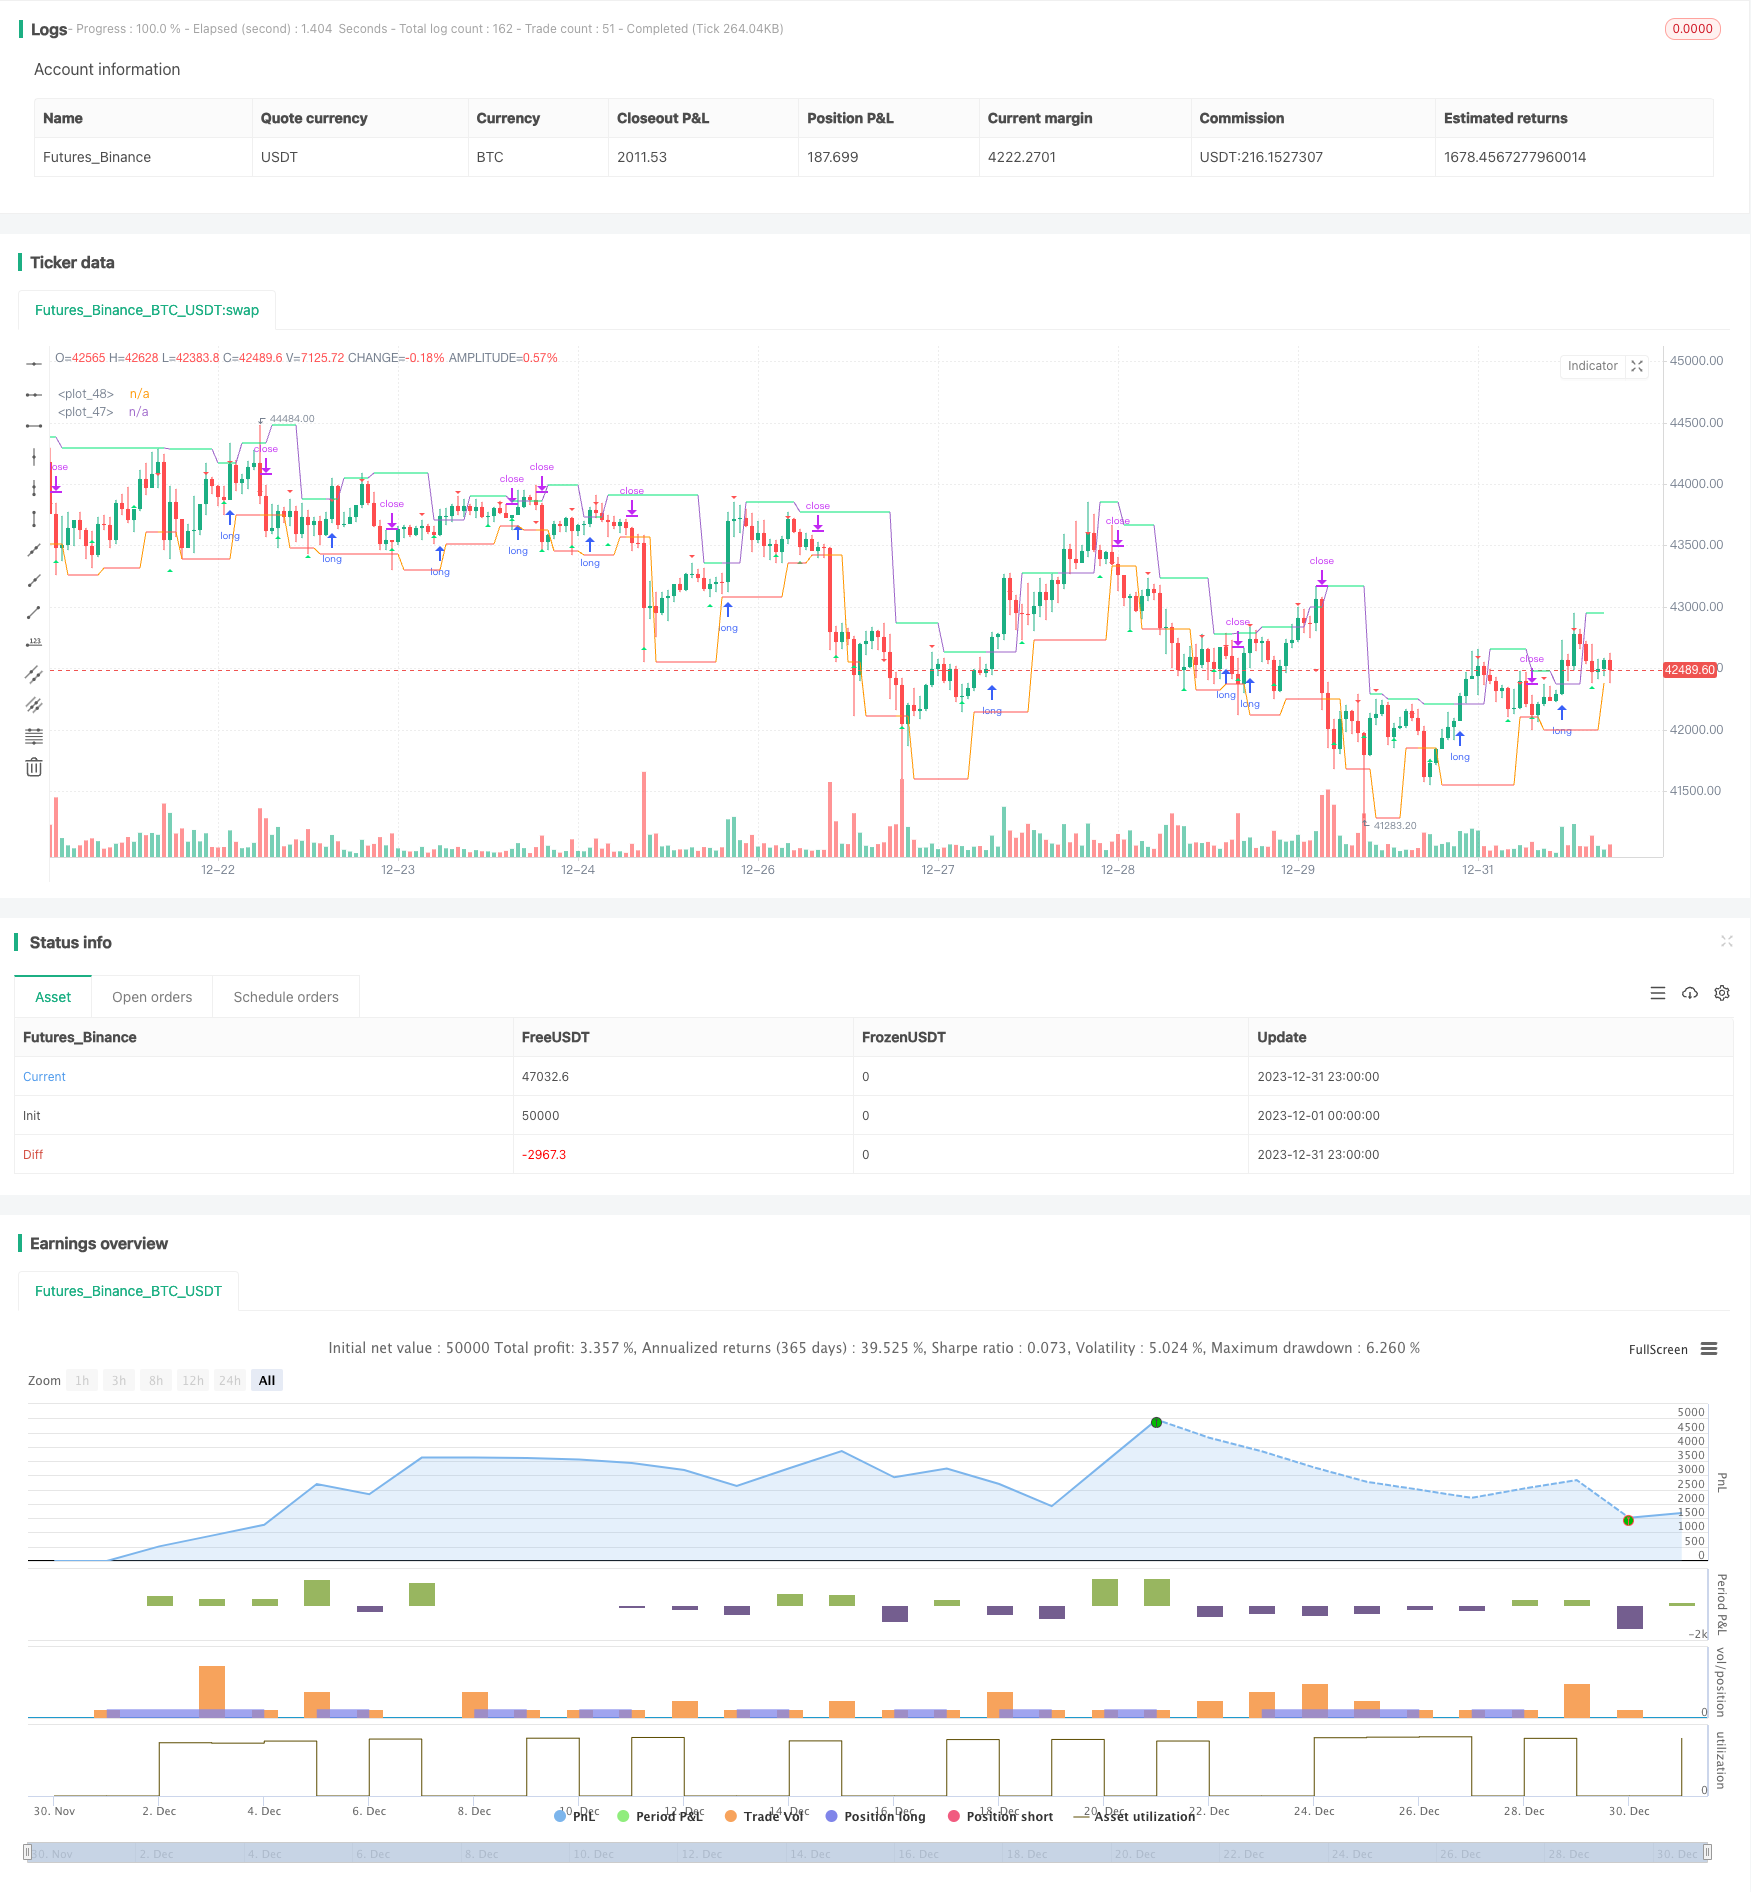
개요
이것은 빌 윌리엄스의 분화 이론과 ZZ 지표를 이용한 양적 거래 전략이다. 이 전략은 윌리엄스 분화를 계산하여 시장의 흐름을 판단하고, ZZ 지표와 결합하여 잠재적인 돌파구를 발견하기 위해 지지 저항선을 그리는 것으로 트렌드 추적 거래를 가능하게 한다.
전략 원칙
이 전략은 먼저 윌리엄스 분형을 계산하여 현재 상승 분기인지 하향 분기인지 판단한다. 상승 분기라면 현재 상승 추세에 있다고 생각하며, 하향 분기라면 현재 하향 추세에 있다고 생각한다.
다음으로 분화 지점에 따라 ZZ 지표의 지지선과 저항선을 그리십시오. 가격이 상향 분화 대응의 저항선을 뚫면 더 많은 것을하십시오. 가격이 하향 분화 대응의 지지선을 뚫면 공백을하십시오.
이러한 조합을 통해 트렌드가 변할 때 트렌드 추적 거래가 가능해집니다.
전략적 강점 분석
이 전략은 윌리엄스 분화와 ZZ 지표의 두 가지 다른 기술 분석 방법을 사용하여 더 많은 거래 기회를 탐색합니다.
그것은 시장의 경향의 전환을 시기적으로 판단하고 좋은 중지 상쇄 조건을 설정하여 주요 경향의 방향을 파악하는 데 도움이됩니다. 또한, ZZ 지표는 일부 가짜 돌파구를 필터링하여 불필요한 손실을 방지 할 수 있습니다.
전체적으로, 이 전략은 추세 판단과 특정 입구 선택에 대해 고려하여 위험과 수익의 균형을 맞추고 있습니다.
전략적 위험 분석
이 전략의 가장 큰 위험은 분형 판단과 ZZ 지표가 잘못된 거래 신호를 발산하여 불필요한 손실을 초래할 수 있다는 것입니다. 예를 들어, 저항선을 뚫은 후 가격이 빨리 떨어질 수 있으며 지속적으로 상승할 수 없습니다.
또한, 분형의 계산 방식은 시간 주기 설정이 부적절하기 때문에 판단에 오류가 있을 수 있다. 시간 주기가 너무 짧다면, 허위 돌파의 확률이 증가한다.
이러한 위험을 줄이기 위해, 분형의 계산 파라미터를 적절히 조정할 수 있으며, 필터링 조건을 추가하여 잘못된 신호를 줄일 수 있다. 또한, 단기 손실을 제어하기 위해 더 큰 스톱 손실을 설정할 수 있다.
전략 최적화 방향
이러한 전략은 다음과 같은 몇 가지 측면에서 더욱 개선될 수 있습니다.
동력 지표 필터를 추가하여 MACD 또는 브린 밴드 지표와 같이 일부 가짜 돌파구를 피할 수 있다.
분모 변수 설정을 최적화하고, 높은 낮은 점에 대한 계산 방법을 조정하고, 더 정확한 추세 판단을 위해 시간 주기를 축소합니다.
기계 학습 알고리즘의 트렌드 판단 정확도를 높이고, 인공지능의 판단력을 사용하여 인공적으로 설정된 제한을 피할 수 있습니다.
시장의 변동에 따라 조정할 수 있는 자율적 손해 차단 메커니즘을 추가한다.
딥러닝 알고리즘을 사용하여 전체적인 파라미터 설정을 최적화한다.
요약하다
이 전략은 윌리엄스 분화 이론과 ZZ 지표의 교묘한 결합을 통해 시장 추세 변화에 대한 신속한 판단과 포착을 가능하게 한다. 그것은 높은 승률을 유지하고 있으며 장기적으로 안정적인 초과 수익을 얻을 것으로 보인다. 다음 단계는 더 많은 필터링 수단과 AI 판단을 도입하여 전략의 안정성과 수익률을 더욱 향상시킬 것으로 보인다.
/*backtest
start: 2023-12-01 00:00:00
end: 2023-12-31 23:59:59
period: 1h
basePeriod: 15m
exchanges: [{"eid":"Futures_Binance","currency":"BTC_USDT"}]
*/

//@version=4
strategy(title = "robotrading ZZ-8 fractals", shorttitle = "ZZ-8", overlay = true, default_qty_type = strategy.percent_of_equity, initial_capital = 100, default_qty_value = 100, commission_value = 0.1)

//Settings
needlong  = input(true, defval = true, title = "Long")
needshort = input(false, defval = true, title = "Short")
filterBW = input(false, title="filter Bill Williams Fractals")
showll = input(true, title = "Show levels")
showff = input(true, title = "Show fractals (repaint!)")
showdd = input(true, title = "Show dots (repaint!)")
showbg = input(false, title = "Show background")
showlb = input(false, title = "Show drawdown")
startTime = input(defval = timestamp("01 Jan 2000 00:00 +0000"), title = "Start Time", type = input.time, inline = "time1")
finalTime = input(defval = timestamp("31 Dec 2099 23:59 +0000"), title = "Final Time", type = input.time, inline = "time1")

//Variables
loss = 0.0
maxloss = 0.0
equity = 0.0
truetime = true

//Fractals
isRegularFractal(mode) =>
    ret = mode == 1 ? high[4] < high[3] and high[3] < high[2] and high[2] > high[1] and high[1] > high[0] : mode == -1 ? low[4] > low[3] and low[3] > low[2] and low[2] < low[1] and low[1] < low[0] : false
isBWFractal(mode) =>
    ret = mode == 1 ? high[4] < high[2] and high[3] <= high[2] and high[2] >= high[1] and high[2] > high[0] : mode == -1 ? low[4] > low[2] and low[3] >= low[2] and low[2] <= low[1] and low[2] < low[0] : false
filteredtopf = filterBW ? isRegularFractal(1) : isBWFractal(1)
filteredbotf = filterBW ? isRegularFractal(-1) : isBWFractal(-1)

//Triangles
plotshape(filteredtopf and showff, title='Filtered Top Fractals', style=shape.triangledown, location=location.abovebar, color= color.red, offset=-2)
plotshape(filteredbotf and showff, title='Filtered Bottom Fractals', style=shape.triangleup, location=location.belowbar, color= color.lime, offset=-2)

//Levels
hh = 0.0
ll = 0.0
hh := filteredtopf ? high[2] : hh[1]
ll := filteredbotf ? low[2] : ll[1]

//Trend
trend = 0
trend := high >= hh[1] ? 1 : low <= ll[1] ? -1 : trend[1]

//Lines
hcol = showll and hh == hh[1] and close < hh ? color.lime : na
lcol = showll and ll == ll[1] and close > ll ? color.red : na
plot(hh, color = hcol)
plot(ll, color = lcol)

//Dots
// var line hline = na
// if hh != hh[1] and showdd
//     hline := line.new(bar_index - 0, hh[0], bar_index - 2, hh[0], xloc = xloc.bar_index, extend = extend.none, style = line.style_dotted, color = color.lime, width = 1)
// var line lline = na
// if ll != ll[1] and showdd
//     lline := line.new(bar_index - 0, ll[0] - syminfo.mintick, bar_index - 2, ll[0] - syminfo.mintick, xloc = xloc.bar_index, extend = extend.none, style = line.style_dotted, color = color.red, width = 1)

//Background
bgcol = showbg == false ? na : trend == 1 ? color.lime : trend == -1 ? color.red : na
bgcolor(bgcol, transp = 80)

//Orders
if hh > 0 and needlong
    strategy.entry("Long", strategy.long, na, stop = hh, when = needlong and truetime)
    strategy.exit("Exit Long", "Long", stop = ll, when = needshort == false)
if ll > 0 and startTime
    strategy.entry("Short", strategy.short, na, stop = ll, when = needshort and truetime)
    strategy.exit("Exit Short", "Short", stop = hh, when = needlong == false)
if time > finalTime
    strategy.close_all()
    strategy.cancel("Long")
    strategy.cancel("Short")

if showlb

    //Drawdown
    max = 0.0
    max := max(strategy.equity, nz(max[1]))
    dd = (strategy.equity / max - 1) * 100
    min = 100.0
    min := min(dd, nz(min[1]))

    //Max loss size
    equity := strategy.position_size != strategy.position_size[1] ? strategy.equity : equity[1]
    loss := equity < equity[1] ? ((equity / equity[1]) - 1) * 100 : 0
    maxloss := min(nz(maxloss[1]), loss)

    //Label
    min := round(min * 100) / 100
    maxloss := round(maxloss * 100) / 100
    labeltext = "Drawdown: " + tostring(min) + "%" + "\nMax.loss " + tostring(maxloss) + "%"
    var label la = na
    label.delete(la)
    tc = min > -100 ? color.white : color.red
    osx = timenow + round(change(time)*50)
    osy = highest(100)
    la := label.new(x = osx, y = osy, text = labeltext, xloc = xloc.bar_time, yloc = yloc.price, color = color.black, style = label.style_labelup, textcolor = tc)