개요
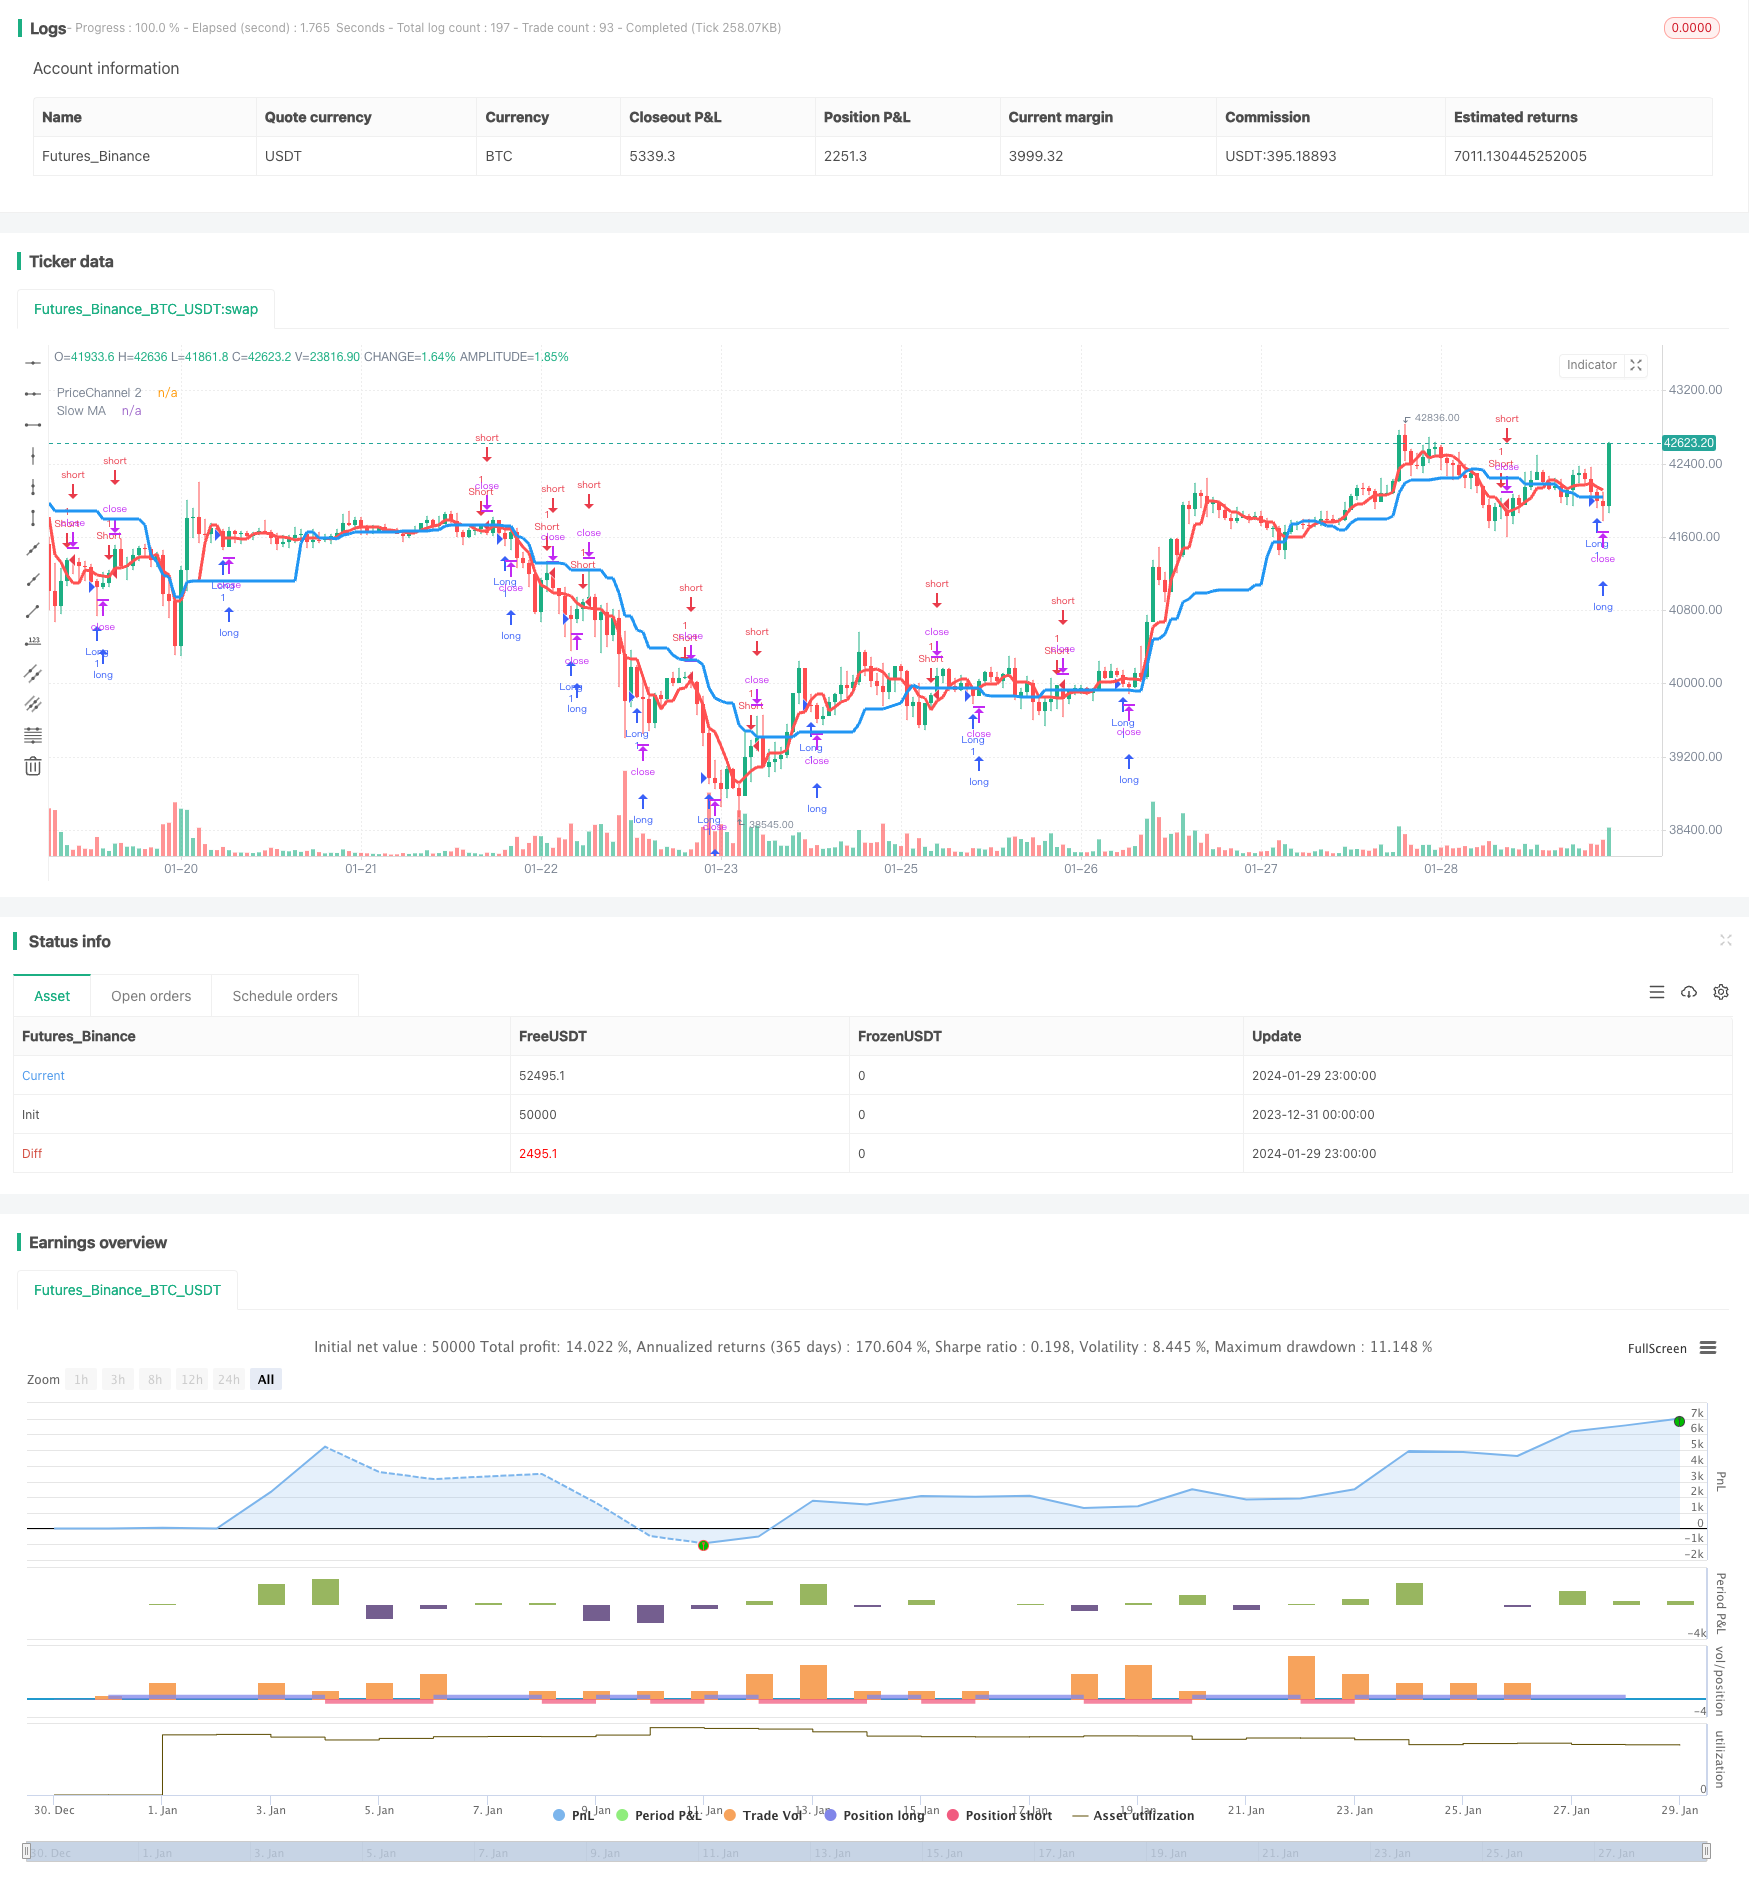
이 전략은 트렌드 방향과 더 많은 코스 시간을 식별하기 위해 두 개의 평평선 지표를 사용합니다. 그 중 느린 평균선 (파란 선) 은 전체 트렌드 방향을 판단하기 위해 사용되며, 빠른 평균선 (빨간 선) 은 가격 통로와 결합하여 더 많은 코스 시간을 발견하기 위해 사용됩니다.
전략 원칙
두 개의 평균선을 천천히 계산한다. 느린 평균선은 21번의 주기로 전체적인 추세를 판단한다. 빠른 평균선은 5번의 주기로 가격 통로와 결합하여 거래 시기를 발견한다.
현재 가격이 지난 주기의 가격 통로를 뚫었는지 계산합니다. 가격이 통로를 뚫면 거래 기회로 간주합니다.
K선의 방향과 수를 계산한다. 마지막 N근 K선이 모두 음선이라면, 더 많은 시간을 할애할 수 있다. 마지막 N근 K선이 모두 양선이라면, 공백 시간을 할애할 수 있다.
위의 몇 가지 요소를 종합하여 다중 하위 신호를 발송한다. 거래가 느린 평균선 방향과 일치하고 빠른 평균선 또는 가격 채널이 신호를 발송하고 K선도 조건이 충족되면 거래 신호를 발송한다.
전략적 이점
트렌드 방향을 효과적으로 추적할 수 있는 이중 일률적인 시스템을 사용한다.
급속한 평균선과 가격 통로가 결합되어, 돌파구를 조기에 발견하고 거래 시간을 파악할 수 있다.
K선 방향과 수를 고려하여 신호를 발송하는 것은 반전 시장에 갇히지 않도록 합니다.
자유로이 조정할 수 있는 평균선 변수, 다른 품종과 주기에 적용된다.
전략적 위험과 해결 방법
쌍평균선은 가로판에 있을 때 잘못된 신호를 발산하기 쉽다. 가격차이 지표 또는 ATR 지표를 통해 보조 판단을 할 수 있으며, 흔들림 상황에서 거래하는 것을 피한다.
특이한 상황에서도 설정될 수 있다. 적절한 스톱포인트를 설정하여 단편적 손실을 줄일 수 있다.
우리는 계속해서 메커니즘과 매개 변수를 최적화하여 전략을 더욱 안정화시킬 것입니다.
전략 최적화 방향
ADX, MACD 등과 같은 보조 지표 판단을 추가하여 충격적인 거래의 잘못된 거래를 피하십시오.
동적으로 조정되는 스톱로스 점. ATR에 따라 위험 예상을 계산하여 합리적인 스톱로스 비율을 설정할 수 있다.
최적화 매개 변수의 자기 적응력. 기계 학습 방법을 사용하여 시스템이 자동으로 매개 변수를 최적화 할 수 있습니다.
품종 특성에 따라 파라미터를 조정한다. 예를 들어, 암호화폐는 더 짧은 기간에 적합하다.
요약하다
이 전략은 전체적으로 트렌드 상황을 추적하기 위해 매우 적합하다. 또한, 몇 가지 돌파구 거래 기회를 추가했다. 합리적인 최적화를 통해 전략은 더 많은 시장에서 안정적으로 작동 할 수 있습니다. 우리는 계속 개선하여 상급의 고품질의 양성 전략으로 만들기 위해 노력할 것입니다.
/*backtest
start: 2023-12-31 00:00:00
end: 2024-01-30 00:00:00
period: 1h
basePeriod: 15m
exchanges: [{"eid":"Futures_Binance","currency":"BTC_USDT"}]
*/

//@version=2
strategy(title = "Noro's Trend MAs Strategy v1.9 Extreme", shorttitle = "Trend MAs str 1.9 extreme", overlay=true, default_qty_type = strategy.percent_of_equity, default_qty_value=100.0, pyramiding=0)

//Settings
needlong = input(true, "long")
needshort = input(true, "short")
needstops = input(false, "stops")
stoppercent = input(5, defval = 5, minval = 1, maxval = 50, title = "Stop, %")
useohlc4 = input(false, defval = false, title = "Use OHLC4")
usefastsma = input(true, "Use fast MA Filter")
fastlen = input(5, defval = 5, minval = 1, maxval = 50, title = "fast MA Period")
slowlen = input(21, defval = 20, minval = 2, maxval = 200, title = "slow MA Period")
bars = input(2, defval = 2, minval = 0, maxval = 3, title = "Bars Q")
needbg = input(false, defval = false, title = "Need trend Background?")
needarr = input(false, defval = false, title = "Need entry arrows?")
needex = input(true, defval = true, title = "Need extreme? (crypto/fiat only!!!)")

src = useohlc4 == true ? ohlc4 : close

//PriceChannel 1
lasthigh = highest(src, slowlen)
lastlow = lowest(src, slowlen)
center = (lasthigh + lastlow) / 2

//PriceChannel 2
lasthigh2 = highest(src, fastlen)
lastlow2 = lowest(src, fastlen)
center2 = (lasthigh2 + lastlow2) / 2

//Trend
trend = low > center and low[1] > center[1] ? 1 : high < center and high[1] < center[1] ? -1 : trend[1]

//Bars
bar = close > open ? 1 : close < open ? -1 : 0
redbars = bars == 0 ? 1 : bars == 1 and bar == -1 ? 1 : bars == 2 and bar == -1 and bar[1] == -1 ? 1 : bars == 3 and bar == -1 and bar[1] == -1 and bar[2] == -1 ? 1 : 0
greenbars = bars == 0 ? 1 : bars == 1 and bar == 1 ? 1 : bars == 2 and bar == 1 and bar[1] == 1 ? 1 : bars == 3 and bar == 1 and bar[1] == 1 and bar[2] == 1 ? 1 : 0

//Signals
up = trend == 1 and (low < center2 or usefastsma == false) and (redbars == 1) ? 1 : 0
dn = trend == -1 and (high > center2 or usefastsma == false) and (greenbars == 1) ? 1 : 0

up2 = high < center and high < center2 and bar == -1 ? 1 : 0
dn2 = low > center and low > center2 and bar == 1 ? 0 : 0

//Lines
plot(center, color = blue, linewidth = 3, transp = 0, title = "Slow MA")
plot(center2, color = red, linewidth = 3, transp = 0, title = "PriceChannel 2")

//Arrows
plotarrow(up == 1 and needarr == true ? 1 : 0, colorup = black, colordown = black, transp = 0)
plotarrow(dn == 1 and needarr == true ? -1 : 0, colorup = black, colordown = black, transp = 0)

//Background
col = needbg == false ? na : trend == 1 ? lime : red
bgcolor(col, transp = 90)

//Alerts
alertcondition(up == 1, title='buy', message='Uptrend')
alertcondition(dn == 1, title='sell', message='Downtrend')

//Trading
stoplong = up == 1 and needstops == true ? close - (close / 100 * stoppercent) : stoplong[1]
stopshort = dn == 1 and needstops == true ? close + (close / 100 * stoppercent) : stopshort[1]

longCondition = up == 1 or (up2 == 1 and needex == true)
if (longCondition)
    strategy.entry("Long", strategy.long, needlong == false ? 0 : na)
    strategy.exit("Stop Long", "Long", stop = stoplong)

shortCondition = dn == 1
if (shortCondition)
    strategy.entry("Short", strategy.short, needshort == false ? 0 : na)
    strategy.exit("Stop Short", "Short", stop = stopshort)