개요
오징어 동력 압축 전략은 부린띠, 켈트너 채널, 동력 지표를 결합한 양적 거래 전략이다. 부린띠와 켈트너 채널을 사용하여 현재 시장이 압축 상태에 있는지 판단한 다음 동력 지표와 결합하여 거래 신호를 생성한다.
이 전략의 주요 장점은 트렌드적 행동의 시작을 자동으로 식별할 수 있고 동력 지표와 함께 진출 시점을 판단할 수 있다는 것입니다. 그러나 또한 다양한 품종에 대한 파라미터 최적화를 필요로하는 특정 위험이 있습니다.
전략 원칙
베르의 동력 압축 전략은 다음의 세 가지 지표에 따라 결정됩니다.
- 브린 밴드 (Bollinger Bands): 중간, 상단, 하단
- 켈트너 채널 (Keltner Channels): 중철, 상철 및 하철을 포함한다
- 운동 지표 (Momentum Indicator): 현재 가격과 n일 전 가격의 차
부린이 케લ્ટ너 채널의 오프라인보다 낮고 부린이 케ルト너 채널의 오프라인보다 높을 때, 우리는 시장이 압축 상태에 있다고 생각합니다. 이것은 일반적으로 현재 트렌드적인 행동이 시작될 것을 의미합니다.
진입 시기를 결정하기 위해, 우리는 동력 지표를 사용하여 가격 변화의 속도를 판단합니다. 동력이 상향으로 평균을 돌파 할 때 구매 신호를 생성합니다. 동력이 하향으로 평균을 넘어서는 경우 판매 신호를 생성합니다.
전략적 강점 분석
베어 동력 압축 전략의 주요 장점은 다음과 같습니다.
- 트렌드가 시작되는 시점을 자동으로 인식하고, 일찍 가입할 수 있는
- 여러 지표를 조합하여 판단하여 잘못된 신호를 피하십시오.
- 트렌드를 고려하고 두 가지 방식의 거래를 반전하는 방법
- 사용자 정의 가능한 매개 변수, 다양한 품종에 최적화
위험 분석
하지만, 베르의 동력 압축 전략에는 위험도 있습니다.
- 브린 벨트와 켈트너 채널에서 가짜 신호가 나올 가능성이 높습니다.
- 동력 지표가 불안정하여 최적의 입점 지점을 놓칠 수 있습니다.
- 변수를 최적화해야 합니다. 그렇지 않으면 효과가 좋지 않습니다.
- 거래 품종에 대한 효과의 연관성이 높다
위험을 줄이기 위해, 부린 벨트와 켈트너 채널의 길이 파라미터를 최적화하고, 스톱포트를 조정하고, 유동성이 좋은 거래 품종을 선택하며, 다른 지표와 함께 검증하는 것이 좋습니다.
전략 최적화 방향
베어 동력 압축 전략의 효과를 더욱 강화하기 위해, 주요 최적화 방향은 다음과 같습니다:
- 다양한 품종과 주기별로 테스트하는 파라미터 조합
- 브린 벨트와 켈트너 통로의 길이를 최적화
- 동력 지표의 길이를 최적화
- 다중 헤드 및 빈 헤드에 대해 다른 상쇄 전략
- 신호 검증을 위한 다른 지표를 추가합니다.
다방면 테스트와 최적화를 통해 이 전략의 성공률과 수익성을 크게 높일 수 있다.
요약하다
곰 동력 엑스트레이션 전략은 여러 지표의 판단력을 통합하여 트렌드가 시작되는 시점을 효과적으로 식별할 수 있다. 그러나 또한 특정 위험이 있으며, 다른 거래 품종에 대한 파라미터 최적화를 필요로 한다. 지속적인 테스트와 최적화를 통해 이 전략은 효율적인 알고리즘 거래 시스템으로 될 수 있다.
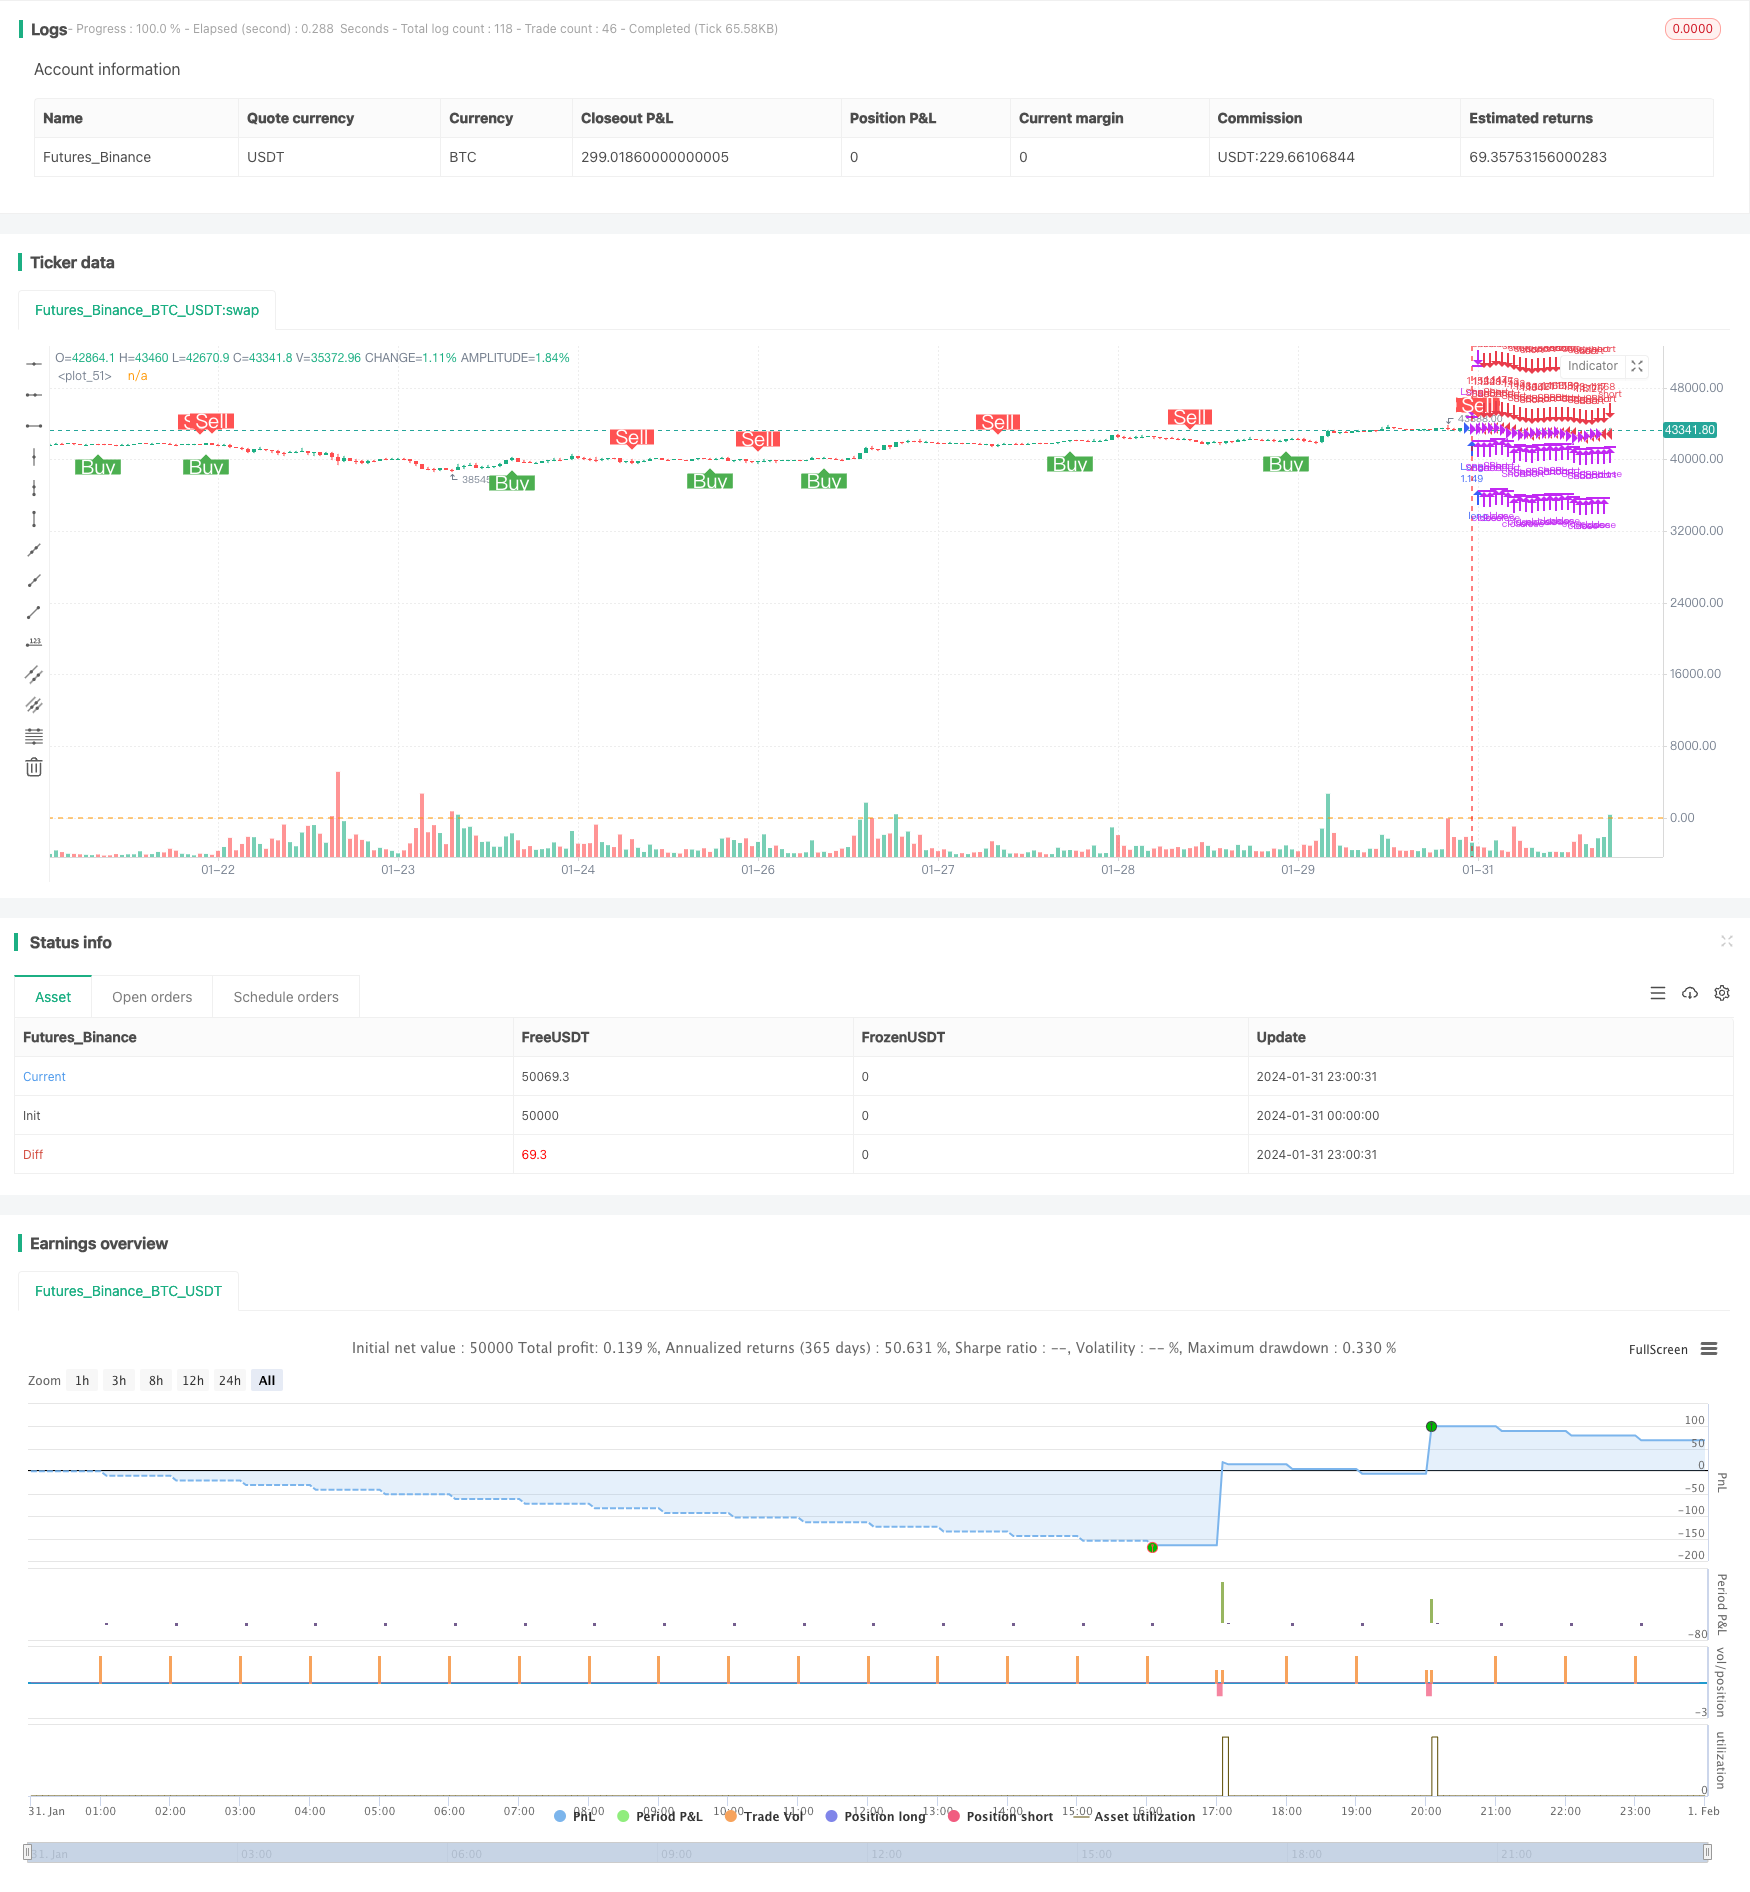
/*backtest
start: 2024-01-31 00:00:00
end: 2024-02-01 00:00:00
period: 1h
basePeriod: 15m
exchanges: [{"eid":"Futures_Binance","currency":"BTC_USDT"}]
*/

//@version=5
// This source code is subject to the terms of the Mozilla Public License 2.0 at https://mozilla.org/MPL/2.0/
// © mtahreemalam original strategy by LazyBear

strategy(title = 'SQM Strategy, TP & SL',
         shorttitle = 'Squeeze.M Strat',
         overlay = true,
         pyramiding = 0,
         default_qty_type = strategy.percent_of_equity,
         default_qty_value = 100,
         initial_capital = 1000,
         commission_type=strategy.commission.percent,
         commission_value=0.0,
         process_orders_on_close=true,
         use_bar_magnifier=true)
//Strategy logic
strategy_logic = input.string("Cross above 0", "Strategy Logic", options = ["LazyBear", "Cross above 0"])

// Date Range
testPeriodSwitch = input(false, "Custom Backtesting Date Range",group="Backtesting Date Range")
i_startTime = input(defval = timestamp("01 Jan 2022 00:01 +0000"), title = "Backtesting Start Time",group="Backtesting Date Range")
i_endTime = input(defval = timestamp("31 Dec 2022 23:59 +0000"), title = "Backtesting End Time",group="Backtesting Date Range")
timeCond = true
isPeriod = testPeriodSwitch == true ? timeCond : true

//// Stoploss and Take Profit Parameters
// Enable Long Strategy
enable_long_strategy = input.bool(true, title='Enable Long Strategy', group='SL/TP For Long Strategy', inline='1')
long_stoploss_value = input.float(defval=5, title='Stoploss %', minval=0.1, group='SL/TP For Long Strategy', inline='2')
long_stoploss_percentage = close * (long_stoploss_value / 100) / syminfo.mintick
long_takeprofit_value = input.float(defval=5, title='Take Profit %', minval=0.1, group='SL/TP For Long Strategy', inline='2')
long_takeprofit_percentage = close * (long_takeprofit_value / 100) / syminfo.mintick

// Enable Short Strategy
enable_short_strategy = input.bool(true, title='Enable Short Strategy', group='SL/TP For Short Strategy', inline='3')
short_stoploss_value = input.float(defval=5, title='Stoploss %', minval=0.1, group='SL/TP For Short Strategy', inline='4')
short_stoploss_percentage = close * (short_stoploss_value / 100) / syminfo.mintick
short_takeprofit_value = input.float(defval=5, title='Take Profit %', minval=0.1, group='SL/TP For Short Strategy', inline='4')
short_takeprofit_percentage = close * (short_takeprofit_value / 100) / syminfo.mintick

//// Inputs
//SQUEEZE MOMENTUM STRATEGY
length = input(20, title='BB Length', group = "Squeeze Momentum Settings")
mult = input(2.0, title='BB MultFactor', group = "Squeeze Momentum Settings")
source = close
lengthKC = input(20, title='KC Length', group = "Squeeze Momentum Settings")
multKC = input(1.5, title='KC MultFactor', group = "Squeeze Momentum Settings")
useTrueRange = input(true, title='Use TrueRange (KC)', group = "Squeeze Momentum Settings")
signalPeriod=input(5, title="Signal Length", group = "Squeeze Momentum Settings")
show_labels_sqm = input(title='Show Buy/Sell SQM Labels', defval=true, group = "Squeeze Momentum Settings")
h0 = hline(0)

// Defining MA
ma = ta.sma(source, length)

// Calculate BB
basis = ma
dev = mult * ta.stdev(source, length)
upperBB = basis + dev
lowerBB = basis - dev

// Calculate KC
range_1 = useTrueRange ? ta.tr : high - low
rangema = ta.sma(range_1, lengthKC)
upperKC = ma + rangema * multKC
lowerKC = ma - rangema * multKC


// SqzON | SqzOFF | noSqz
sqzOn = lowerBB > lowerKC and upperBB < upperKC
sqzOff = lowerBB < lowerKC and upperBB > upperKC
noSqz = sqzOn == false and sqzOff == false

// Momentum
val = ta.linreg(source - math.avg(math.avg(ta.highest(high, lengthKC), ta.lowest(low, lengthKC)), ta.sma(close, lengthKC)), lengthKC, 0)

red_line = ta.sma(val,signalPeriod)
blue_line = val

// lqm = if val > 0
//         if val > nz(val[1])
        // long_sqm_custom
        // if val < nz(val[1])
        // short_sqm_custom
// Plots
//plot(val, style = plot.style_line, title = "blue line", color= color.blue, linewidth=2)
//plot(ta.sma(val,SignalPeriod), style = plot.style_line, title = "red line",color = color.red, linewidth=2)

//plot(val, color=blue, linewidth=2)
//plot(0, color=color.gray, style=plot.style_cross, linewidth=2)
//plot(red_line, color=red, linewidth=2)

//LOGIC
//momentum filter
//filterMom = useMomAverage ? math.abs(val) > MomentumMin / 100000 ? true : false : true
//}

////SQM Long Short Conditions
//Lazy Bear Buy Sell Condition
// long_sqm_lazy = (blue_line>red_line)
// short_sqm_lazy = (blue_line<red_line)

long_sqm_lazy = ta.crossover(blue_line,red_line)
short_sqm_lazy = ta.crossunder(blue_line,red_line)


//Custom Buy Sell Condition
dir_sqm = val < 0 ? -1 : 1
long_sqm_custom = dir_sqm == 1 //and dir_sqm[1] == -1
short_sqm_custom = dir_sqm == -1 //and dir_sqm[1] == 1

long_sqm = strategy_logic == "LazyBear" ? long_sqm_lazy : long_sqm_custom
short_sqm = strategy_logic == "LazyBear" ? short_sqm_lazy : short_sqm_custom


// Plot Stoploss & Take Profit Levels
long_stoploss_price = strategy.position_avg_price * (1 - long_stoploss_value / 100)
long_takeprofit_price = strategy.position_avg_price * (1 + long_takeprofit_value / 100)
short_stoploss_price = strategy.position_avg_price * (1 + short_stoploss_value / 100)
short_takeprofit_price = strategy.position_avg_price * (1 - short_takeprofit_value / 100)
plot(enable_long_strategy and not enable_short_strategy ? long_stoploss_percentage : na, color=color.red, style=plot.style_linebr, linewidth=2, title='Long SL Level')
plot(enable_long_strategy and not enable_short_strategy ? long_takeprofit_percentage : na, color=color.green, style=plot.style_linebr, linewidth=2, title='Long TP Level')
plot(enable_short_strategy and not enable_long_strategy ? short_stoploss_price : na, color=color.red, style=plot.style_linebr, linewidth=2, title='Short SL Level')
plot(enable_short_strategy and not enable_long_strategy ? short_takeprofit_price : na, color=color.green, style=plot.style_linebr, linewidth=2, title='Short TP Level')


// Long Strategy
if long_sqm and enable_long_strategy == true
    strategy.entry('Long', strategy.long)
    strategy.exit('Long  SL/TP', from_entry='Long', loss=long_stoploss_percentage, profit=long_takeprofit_percentage)
    strategy.close('Long', comment = "L. CL")

// Short Strategy
if short_sqm and enable_short_strategy == true
    strategy.entry('Short', strategy.short)
    strategy.exit('Short SL/TP', from_entry='Short', loss=short_stoploss_percentage, profit=short_takeprofit_percentage)
    strategy.close('Short', comment = "S.Cl")

plot_sqm_long = long_sqm and not long_sqm[1]
plot_sqm_short = short_sqm and not short_sqm[1]

plotshape(plot_sqm_long and show_labels_sqm, title='Buy', style=shape.labelup, location=location.belowbar, size=size.normal, text='Buy', textcolor=color.new(color.white, 0), color=color.new(color.green, 0))
plotshape(plot_sqm_short and show_labels_sqm, title='Sell', style=shape.labeldown, location=location.abovebar, size=size.normal, text='Sell', textcolor=color.new(color.white, 0), color=color.new(color.red, 0))

// Date Range EXIT
if (not isPeriod)
    strategy.cancel_all()
    strategy.close_all()