개요
동적 삼중선 트렌드 추적 전략은 시장의 추세를 식별하기 위해 여러 시간 주기 동안의 동적 평평한 이동 평균을 사용하며, 다른 시간 주기 간의 추세 일관성 필터를 구현하여 거래 신호의 신뢰성을 향상시킵니다.
전략 원칙
이 전략은 3개의 다른 파라미터 세트의 동적으로 평평한 이동 평균을 사용한다. 첫 번째 이동 평균은 현재 주기 가격의 트렌드 방향을 계산한다. 두 번째 이동 평균은 더 높은 시간 주기 가격의 트렌드 방향을 계산한다. 세 번째 이동 평균은 더 높은 단계의 시간 주기 가격의 트렌드 방향을 계산한다. 첫 번째 이동 평균이 두 번째 이동 평균을 상향으로 가로지르면 구매 신호가 발생하고 세 번째 이동 평균은 상승 추세도 나타냅니다.
이동 평균은 동적 평준화 기능을 사용하여 자동으로 계산하고 다른 시간 주기 사이에 적절한 평준화 인자를 적용하여 높은 시간 주기 이동 평균이 낮은 시간 주기 차트에서 휘어진 선이 아닌 부드러운 트렌드 라인을 나타낼 수 있습니다. 이러한 동적 평준화는 전략이 높은 시간 주기에서 전반적인 트렌드 방향을 판단 할 수있게하고 낮은 시간 주기에서 거래를 실행 할 수있게하여 효율적인 트렌드 추적을 가능하게합니다.
전략적 이점
이 전략의 가장 큰 장점은 다중 시간 프레임의 트렌드 필터링 메커니즘에 있다. 다른 시간 주기 가격의 평균 트렌드 방향을 계산하고 다른 주기 사이에 일관성을 요구함으로써, 거래 신호에 대한 vieleity의 단기 가격 변동의 간섭을 효과적으로 필터링하여, 각 거래 신호가 큰 트렌드에 놓인 것을 보장하여, 수익률을 크게 높일 수 있다.
또 다른 장점은 동적 평준화 기능의 적용이다. 이것은 전략이 동시에 높은 시간 주기에서 전체적인 추세와 낮은 시간 주기에서 특정 거래점을 식별할 수 있게 한다. 전략은 높은 시간 주기에서 큰 추세 방향을 결정하면서, 낮은 시간 주기에서 특정 거래를 실행할 수 있다. 이러한 다중 시간 프레임의 사용은 시장 기회를 파악하면서 거래 위험을 제어하는 데 도움이 된다.
위험과 최적화
이 전략의 주요 위험은 거래 신호가 적다는 것이다. 엄격한 추세 필터링 조건은 거래 기회의 수를 줄여주며, 이는 고주파 거래를 추구하는 일부 투자자에게는 적합하지 않을 수 있다. 필터링 조건의 엄격성을 낮추는 것으로 더 많은 거래 기회를 얻을 수 있다.
또한, 변수 설정은 신중한 테스트 최적화, 특히 이동 평균의 주기 길이를 필요로 한다. 다른 시장은 최적의 효과를 얻기 위해 다른 주기 변수를 설정해야 한다.
미래 최적화 방향은 더 많은 기술 지표를 필러링하거나 기계 학습 알고리즘의 자동 최적화 매개 변수를 추가하는 것도 고려할 수 있습니다.
요약하다
이 전략은 전체적으로 매우 실용적인 트렌드 추적 전략이다. 다중 시간 프레임 트렌드 필터링 메커니즘은 각 거래 결정에 좋은 대 방향 지원을 제공하고 거래 위험을 효과적으로 줄인다. 동적 평준화 기능의 추가는 이러한 다중 시간 프레임 방법을 효율적으로 구현 할 수 있도록 한다. 전체 전략 프레임은 합리적이고 효율적으로 작동하며 학습하고 적용할 가치가 있다.
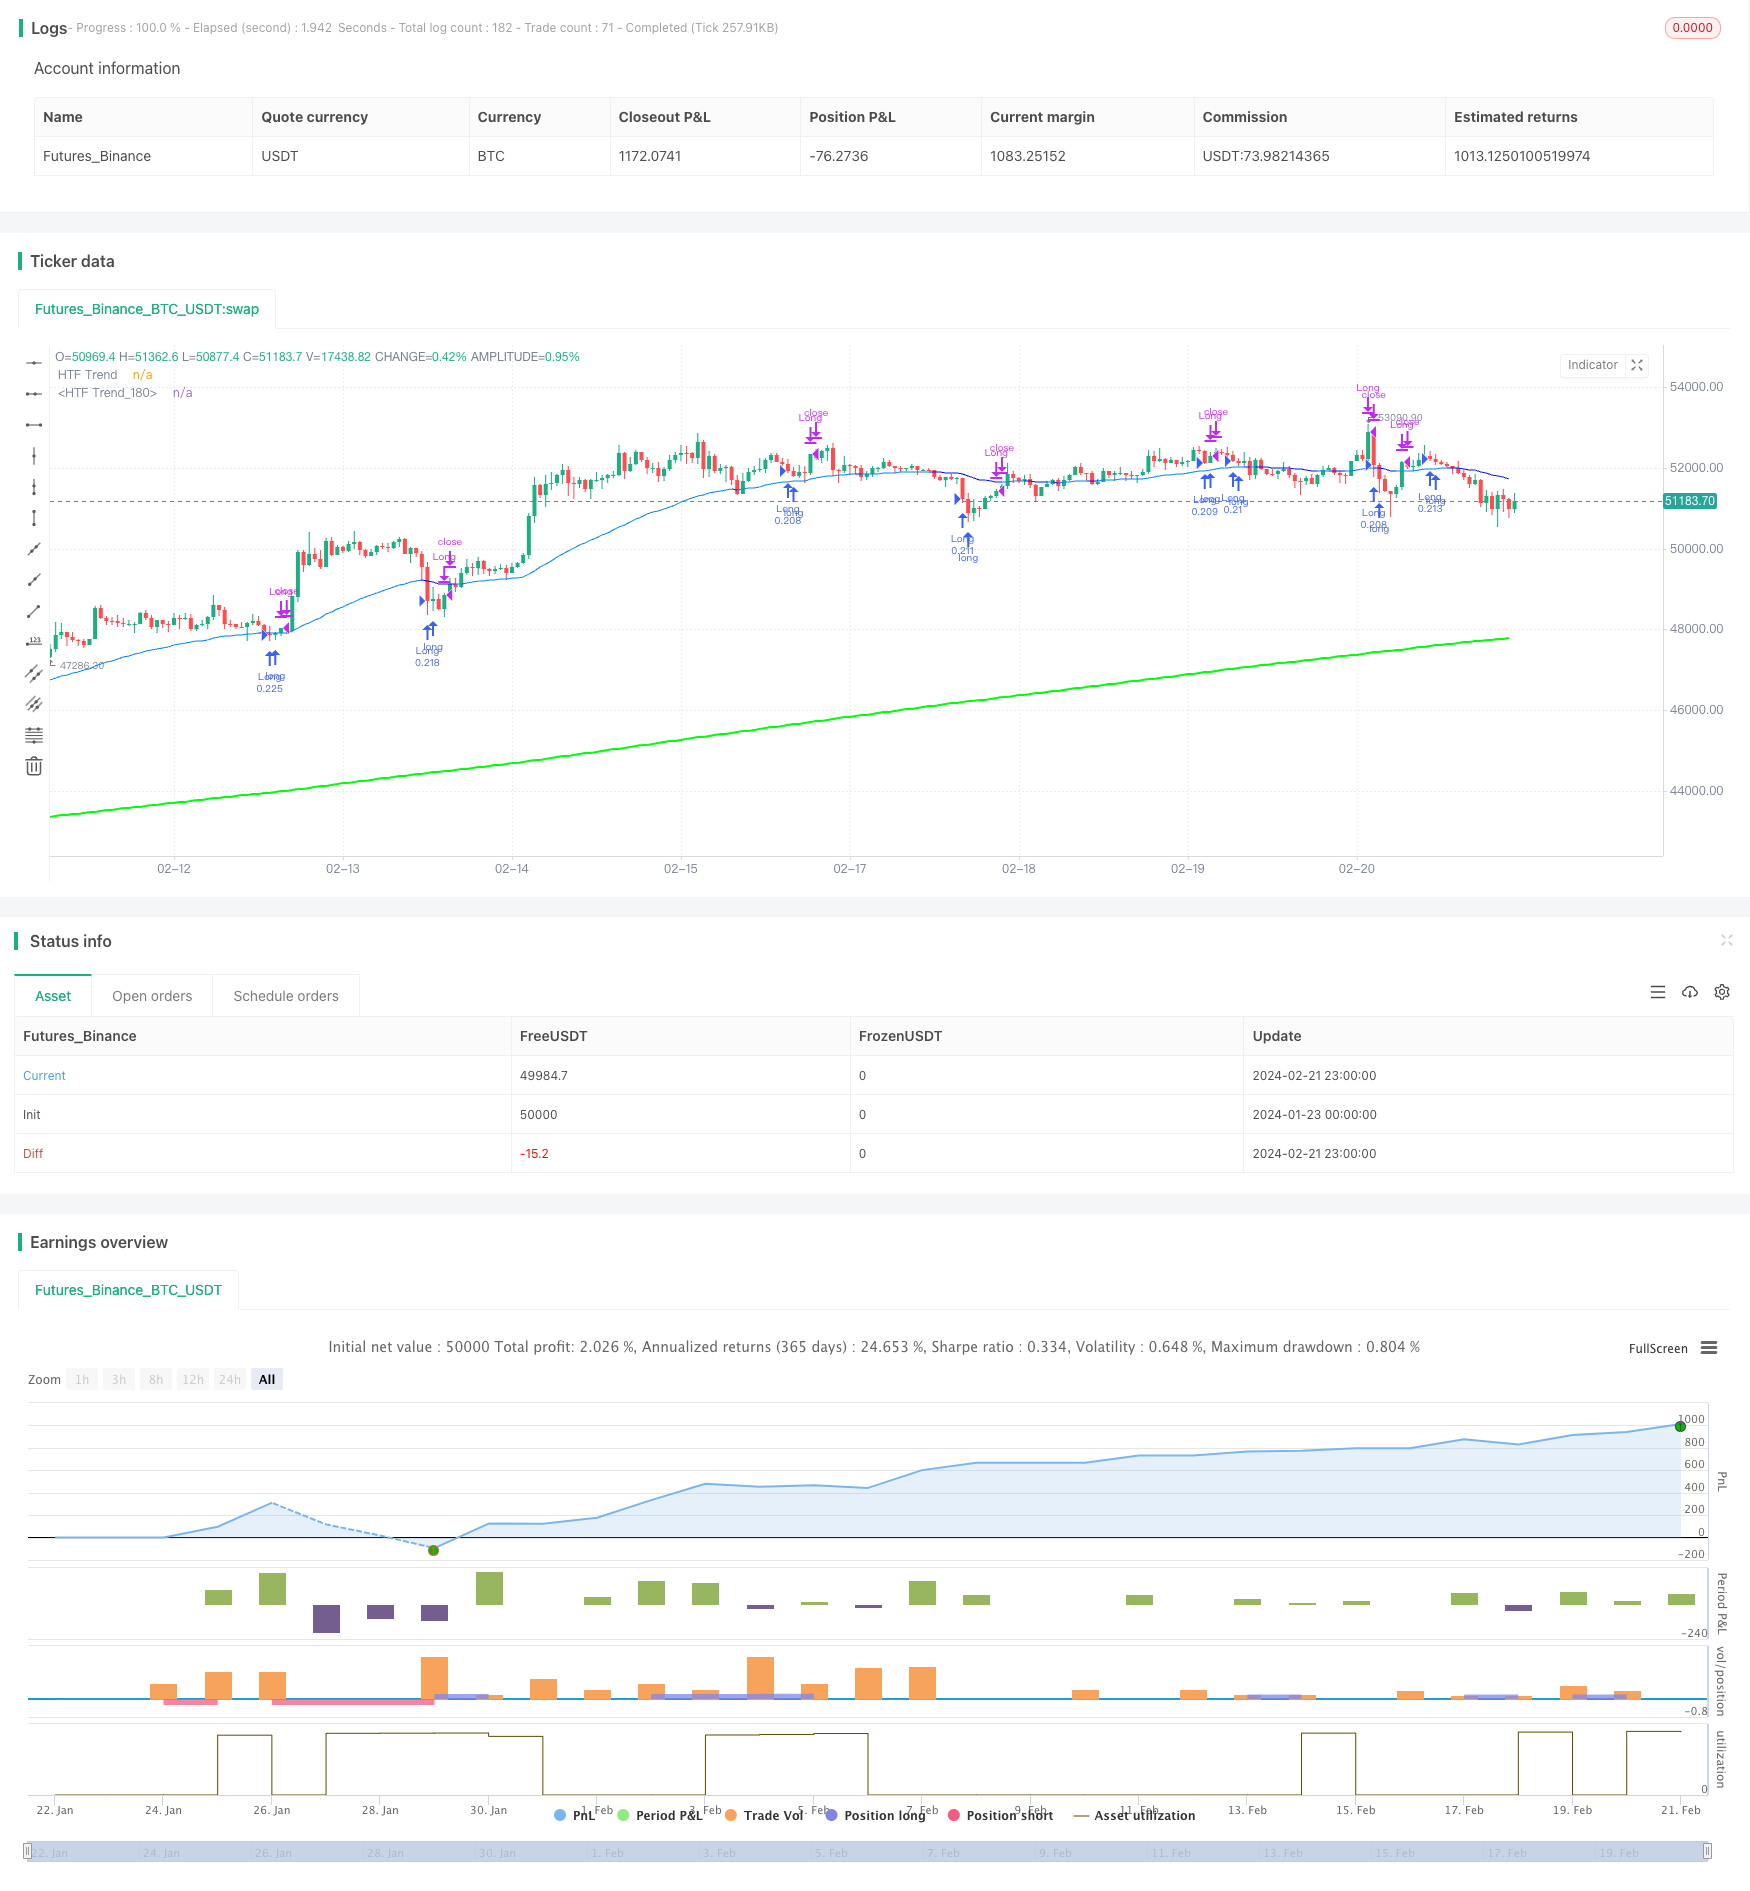
/*backtest
start: 2024-01-23 00:00:00
end: 2024-02-22 00:00:00
period: 1h
basePeriod: 15m
exchanges: [{"eid":"Futures_Binance","currency":"BTC_USDT"}]
*/

// This Pine Script™ code is subject to the terms of the Mozilla Public License 2.0 at https://mozilla.org/MPL/2.0/
// © Harrocop

//@version=5
strategy(title = "Triple MA HTF strategy - Dynamic Smoothing", shorttitle = "Triple MA strategy", overlay=true,
         pyramiding=5, initial_capital = 10000,
         calc_on_order_fills=false,
         slippage = 0,
         commission_type=strategy.commission.percent, commission_value=0.05)

//////////////////////////////////////////////////////
//////////         Risk Management        ////////////
//////////////////////////////////////////////////////
RISKM = "-------------------- Risk Management  --------------------"
InitialBalance = input.float(defval = 10000, title = "Initial Balance", minval = 1, maxval = 1000000, step = 1000, tooltip = "starting capital", group = RISKM)
LeverageEquity = input.bool(defval = true, title = "qty based on equity %", tooltip = "true turns on MarginFactor based on equity, false gives fixed qty for positionsize", group = RISKM)
MarginFactor = input.float(0, minval = - 0.9, maxval = 100, step = 0.1, tooltip = "Margin Factor, meaning that 0.5 will add 50% extra capital to determine ordersize quantity, 0.0 means 100% of equity is used to decide quantity of instrument", inline = "qty", group = RISKM)
QtyNr = input.float(defval = 3.5, title = "Quantity Contracts", minval = 0, maxval = 1000000, step = 0.01,  tooltip = "Margin Factor, meaning that 0.5 will add 50% extra capital to determine ordersize quantity, 0.0 means 100% of equity is used to decide quantity of instrument", inline = "qty", group = RISKM)
EquityCurrent = InitialBalance + strategy.netprofit[1]
QtyEquity = EquityCurrent * (1 + MarginFactor) / close[1]
QtyTrade = LeverageEquity ? QtyEquity : QtyNr

/////////////////////////////////////////////////////
//////////       MA Filter Trend         ////////////
/////////////////////////////////////////////////////
TREND = "-------------------- Moving Average 1 --------------------"
Plot_MA = input.bool(true, title = "Plot MA trend?", inline = "Trend1", group = TREND)
TimeFrame_Trend = input.timeframe(title='Higher Time Frame', defval='15', inline = "Trend1", group = TREND)
length = input.int(21, title="Length MA", minval=1, tooltip = "Number of bars used to measure trend on higher timeframe chart", inline = "Trend2", group = TREND)
MA_Type  = input.string(defval="McGinley" , options=["EMA","DEMA","TEMA","SMA","WMA", "HMA", "McGinley"], title="MA type:", inline = "Trend2", group = TREND)

ma(type, src, length) =>
    float result = 0
    if type == 'TMA' // Triangular Moving Average
        result := ta.sma(ta.sma(src, math.ceil(length / 2)), math.floor(length / 2) + 1)
        result
    if type == 'LSMA' // Least Squares Moving Average
        result := ta.linreg(src, length, 0)
        result
    if type == 'SMA'  // Simple Moving Average
        result := ta.sma(src, length)
        result
    if type == 'EMA'  // Exponential Moving Average
        result := ta.ema(src, length)
        result
    if type == 'DEMA'  // Double Exponential Moving Average
        e = ta.ema(src, length)
        result := 2 * e - ta.ema(e, length)
        result
    if type == 'TEMA'  // Triple Exponentiale
        e = ta.ema(src, length)
        result := 3 * (e - ta.ema(e, length)) + ta.ema(ta.ema(e, length), length)
        result
    if type == 'WMA'  // Weighted Moving Average
        result := ta.wma(src, length)
        result
    if type == 'HMA'  // Hull Moving Average
        result := ta.wma(2 * ta.wma(src, length / 2) - ta.wma(src, length), math.round(math.sqrt(length)))
        result
    if type == 'McGinley' // McGinley Dynamic Moving Average
        mg = 0.0
        mg := na(mg[1]) ? ta.ema(src, length) : mg[1] + (src - mg[1]) / (length * math.pow(src / mg[1], 4))
        result := mg
        result
    result

// Moving Average
MAtrend = ma(MA_Type, close, length)
MA_Value_HTF = request.security(syminfo.tickerid, TimeFrame_Trend, MAtrend)

// Get minutes for current and higher timeframes
// Function to convert a timeframe string to its equivalent in minutes
timeframeToMinutes(tf) =>
    multiplier = 1
    if (str.endswith(tf, "D"))
        multiplier := 1440
    else if (str.endswith(tf, "W"))
        multiplier := 10080
    else if (str.endswith(tf, "M"))
        multiplier := 43200
    else if (str.endswith(tf, "H"))
        multiplier := int(str.tonumber(str.replace(tf, "H", "")))
    else
        multiplier := int(str.tonumber(str.replace(tf, "m", "")))
    multiplier

// Get minutes for current and higher timeframes
currentTFMinutes = timeframeToMinutes(timeframe.period)
higherTFMinutes = timeframeToMinutes(TimeFrame_Trend)

// Calculate the smoothing factor
dynamicSmoothing = math.round(higherTFMinutes / currentTFMinutes)
MA_Value_Smooth = ta.sma(MA_Value_HTF, dynamicSmoothing)

// Trend HTF
UP = MA_Value_Smooth > MA_Value_Smooth[1] // Use "UP" Function to use as filter in combination with other indicators
DOWN = MA_Value_Smooth < MA_Value_Smooth[1] // Use "Down" Function to use as filter in combination with other indicators

/////////////////////////////////////////////////////
//////////       Second MA Filter Trend   ///////////
/////////////////////////////////////////////////////
TREND2 = "-------------------- Moving Average 2 --------------------"
Plot_MA2 = input.bool(true, title = "Plot Second MA trend?", inline = "Trend3", group = TREND2)
TimeFrame_Trend2 = input.timeframe(title='HTF', defval='60', inline = "Trend3", group = TREND2)
length2 = input.int(21, title="Length Second MA", minval=1, tooltip = "Number of bars used to measure trend on higher timeframe chart", inline = "Trend4", group = TREND2)
MA_Type2  = input.string(defval="McGinley" , options=["EMA","DEMA","TEMA","SMA","WMA", "HMA", "McGinley"], title="MA type:", inline = "Trend4", group = TREND2)

// Second Moving Average
MAtrend2 = ma(MA_Type2, close, length2)
MA_Value_HTF2 = request.security(syminfo.tickerid, TimeFrame_Trend2, MAtrend2)

// Get minutes for current and higher timeframes
higherTFMinutes2 = timeframeToMinutes(TimeFrame_Trend2)

// Calculate the smoothing factor for the second moving average
dynamicSmoothing2 = math.round(higherTFMinutes2 / currentTFMinutes)
MA_Value_Smooth2 = ta.sma(MA_Value_HTF2, dynamicSmoothing2)

// Trend HTF for the second moving average
UP2 = MA_Value_Smooth2 > MA_Value_Smooth2[1]
DOWN2 = MA_Value_Smooth2 < MA_Value_Smooth2[1]

/////////////////////////////////////////////////////
//////////       Third MA Filter Trend    ///////////
/////////////////////////////////////////////////////
TREND3 = "-------------------- Moving Average 3 --------------------"
Plot_MA3 = input.bool(true, title = "Plot third MA trend?", inline = "Trend5", group = TREND3)
TimeFrame_Trend3 = input.timeframe(title='HTF', defval='240', inline = "Trend5", group = TREND3)
length3 = input.int(50, title="Length third MA", minval=1, tooltip = "Number of bars used to measure trend on higher timeframe chart", inline = "Trend6", group = TREND3)
MA_Type3  = input.string(defval="McGinley" , options=["EMA","DEMA","TEMA","SMA","WMA", "HMA", "McGinley"], title="MA type:", inline = "Trend6", group = TREND3)

// Second Moving Average
MAtrend3 = ma(MA_Type3, close, length3)
MA_Value_HTF3 = request.security(syminfo.tickerid, TimeFrame_Trend3, MAtrend3)

// Get minutes for current and higher timeframes
higherTFMinutes3 = timeframeToMinutes(TimeFrame_Trend3)

// Calculate the smoothing factor for the second moving average
dynamicSmoothing3 = math.round(higherTFMinutes3 / currentTFMinutes)
MA_Value_Smooth3 = ta.sma(MA_Value_HTF3, dynamicSmoothing3)

// Trend HTF for the second moving average
UP3 = MA_Value_Smooth3 > MA_Value_Smooth3[1]
DOWN3 = MA_Value_Smooth3 < MA_Value_Smooth3[1]

/////////////////////////////////////////////////////
//////////         Entry Settings        ////////////
/////////////////////////////////////////////////////
BuySignal = ta.crossover(MA_Value_HTF, MA_Value_HTF2) and UP3 == true
SellSignal = ta.crossunder(MA_Value_HTF, MA_Value_HTF2) and DOWN3 == true
ExitBuy = ta.crossunder(MA_Value_HTF, MA_Value_HTF2)
ExitSell = ta.crossover(MA_Value_HTF, MA_Value_HTF2)

/////////////////////////////////////////////////
///////////       Strategy       ////////////////
///////////      Entry & Exit    ////////////////
///////////         logic        ////////////////
/////////////////////////////////////////////////
// Long
if BuySignal
    strategy.entry("Long", strategy.long, qty = QtyTrade)

if (strategy.position_size > 0 and ExitBuy == true)
    strategy.close(id = "Long", comment = "Close Long")

// Short
if SellSignal
    strategy.entry("Short", strategy.short, qty = QtyTrade)

if (strategy.position_size < 0 and ExitSell == true)
    strategy.close(id = "Short", comment = "Close Short")

/////////////////////////////////////////////////////
//////////         Visuals Chart         ////////////
/////////////////////////////////////////////////////
// Plot Moving Average HTF
p1 = plot(Plot_MA ? MA_Value_Smooth : na, "HTF Trend", color = UP ? color.rgb(238, 255, 0) : color.rgb(175, 173, 38), linewidth = 1, style = plot.style_line)
p2 = plot(Plot_MA2 ? MA_Value_Smooth2 : na, "HTF Trend", color = UP2 ? color.rgb(0, 132, 255) : color.rgb(0, 17, 255), linewidth = 1, style = plot.style_line)
plot(Plot_MA3 ? MA_Value_Smooth3 : na, "HTF Trend", color = UP3 ? color.rgb(0, 255, 8) : color.rgb(255, 0, 0), linewidth = 2, style = plot.style_line)
fill(p1, p2, color = color.rgb(255, 208, 0, 90), title="Fill")