Strategi bom menyelubungi trend super

Gambaran keseluruhan
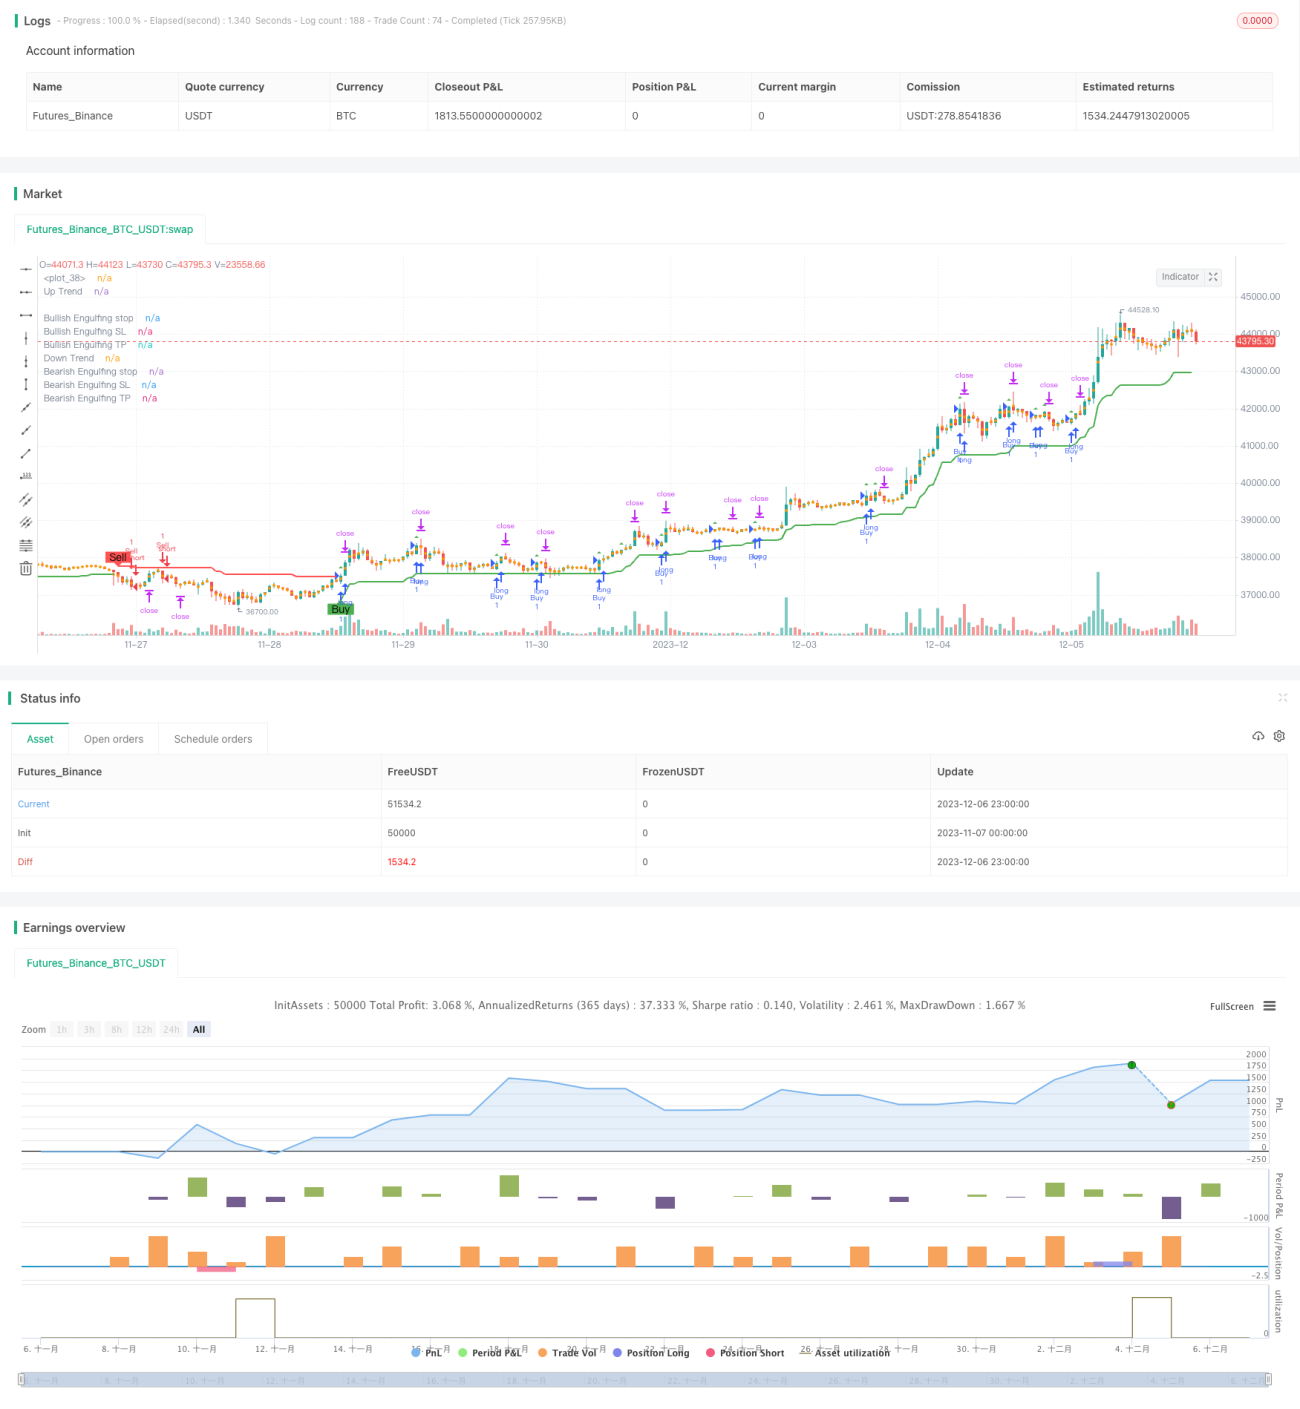
Strategi melonjakkan lompatan hypertrend adalah strategi pemantauan trend yang menggabungkan purata gelombang sebenar (ATR), indikator hypertrend dan corak melonjak untuk mengenal pasti arah trend dan mencari peluang masuk dengan kadar faedah sementara corak melonjak mengesahkan trend.
Prinsip Strategi
Strategi ini mula-mula menggunakan ATR dan penunjuk super trend untuk menentukan arah trend pasaran semasa. Khususnya, ia ditakrifkan sebagai trend menurun apabila harga berada di bawah tren atas dan trend naik apabila harga berada di atas tren bawah.
Pada masa yang sama dengan mengesahkan arah trend, strategi ini juga akan menilai sama ada K garis membentuk bentuk menelan. Menurut logik kod, dalam trend menaik, keadaan di mana K garis sebelumnya ditutup dengan harga yang lebih tinggi daripada K garis semasa dibuka dan K garis semasa ditutup dengan harga yang lebih rendah daripada harga yang dibuka akan mencetuskan banyak penelan; dalam trend menurun, keadaan di mana K garis sebelumnya ditutup dengan harga yang lebih rendah daripada K garis semasa dibuka dan K garis semasa ditutup dengan harga yang lebih tinggi daripada harga yang dibuka akan mencetuskan penelan kepala kosong.
Apabila corak menelan selaras dengan arah trend, isyarat perdagangan akan dihasilkan. Selain itu, strategi akan mengira harga hentian dan harga berhenti berdasarkan corak menelan. Selepas masuk, jika harga menyentuh harga hentian atau berhenti, ia akan keluar dari kedudukan semasa.
Analisis kelebihan
Strategi ini menggabungkan kelebihan trend tracking dan pengenalan bentuk, yang dapat mengenal pasti isyarat pembalikan dalam trend, sehingga dapat menangkap pergerakan yang lebih besar di titik perubahan pasaran. Selain itu, mekanisme berhenti rugi juga dapat mengawal risiko kerugian dengan berkesan.
Analisis risiko
Risiko terbesar dalam strategi ini adalah bahawa bentuk penelan mungkin palsu, yang menghasilkan isyarat yang salah. Selain itu, tetapan hentian dan hentian mungkin terlalu arbitrar dan tidak dapat mencapai keseimbangan keuntungan dan kerugian.
Arah pengoptimuman
Anda boleh mempertimbangkan untuk mengoptimumkan parameter ATR dalam masa nyata untuk menangkap perubahan kadar turun naik pasaran dengan lebih baik. Di samping itu, anda juga boleh mengkaji trend pengenalan indikator lain untuk meningkatkan kestabilan strategi. Dari segi stop loss, pelacakan dinamik juga merupakan idea pengoptimuman yang boleh dilaksanakan.
ringkaskan
Strategi penyampaian lompatan ultra-trend mengintegrasikan kelebihan pengesanan trend dan pengenalan corak, strategi penyampaian corak sebagai isyarat pembalikan, yang dapat memperoleh keberkesanan yang lebih tinggi pada titik perubahan pasaran. Tetapi strategi ini juga mempunyai risiko isyarat palsu tertentu yang memerlukan ujian dan pengoptimuman lebih lanjut untuk mengawal risiko.
- 1