Strategi Penjejakan Aliran Keluli Bohr
Gambaran keseluruhan
Strategi ini menggunakan analisis Boll bands, moving averages, dan volume trading untuk mewujudkan strategi pengesanan trend yang mantap. Strategi ini bertujuan untuk menangkap potensi trend reversal dan memanfaatkan pergerakan pasaran.
Prinsip Strategi
Talian keluli
Menggunakan tali besi bol untuk mengenal pasti keadaan jual beli yang berlebihan di pasaran. Membantu membuat keputusan melalui visual yang jelas mengenai tren naik dan turun.
Prinsip asas tali besi Bohr adalah berdasarkan nilai purata dan perbezaan piawai harga saham dalam tempoh tertentu untuk mengira naik dan turun. Harga saham naik ke atas sebagai isyarat membeli lebih banyak, dan turun ke bawah sebagai isyarat menjual lebih banyak.
Penapis purata bergerak
Menerapkan penapis purata bergerak untuk meningkatkan pengenalan trend. Pengguna boleh memilih pelbagai jenis purata bergerak, seperti purata bergerak sederhana, purata bergerak indeks dan purata bergerak bertimbangan.
Ia menghasilkan isyarat beli (atau jual) apabila harga melintasi (atau menembusi) purata bergerak.
Analisis kuantiti
Membolehkan pengguna untuk memasukkan analisis jumlah transaksi ke dalam strategi untuk mengesahkan isyarat. Kolom kuantiti dengan warna yang berbeza menunjukkan jumlah transaksi lebih tinggi atau lebih rendah daripada purata.
Jumlah transaksi yang melampaui purata boleh digunakan untuk mengesahkan isyarat harga.
Analisis kelebihan
Strategi trend yang kukuh
Pertukaran pasaran berdasarkan jalur Bore, purata bergerak dan pengiktirafan kuantiti transaksi.
Ia boleh menangkap trend harga tepat pada masanya, dan menjejaki trend untuk menjana keuntungan.
Fleksibiliti dan penyesuaian
Pengguna boleh memilih parameter Bolt, jenis dan panjang purata bergerak untuk pengoptimuman.
Kedudukan long dan kosong boleh dikawal secara berasingan.
Visualisasi dan pengesahan
Mekanisme isyarat ganda, yang mengesahkan isyarat harga tali besi Bol melalui purata bergerak dan jumlah transaksi.
Tunjukkan secara langsung isyarat perdagangan seperti purata bergerak, garisan hentian dan sebagainya.
Pengurusan Risiko
Berdasarkan ATR mengira paras stop loss. Anda boleh menyesuaikan kitaran ATR dan pengganda stop loss ATR.
Menyesuaikan saiz kedudukan mengikut peratusan risiko memegang jawatan. Mengendalikan kerugian tunggal dengan berkesan.
Analisis risiko
Risiko kitar semula
- Jadual sejarah yang berbeza boleh memberi kesan kepada prestasi strategi. Pembacaan semula dalam tempoh yang berbeza harus dilakukan untuk memastikan strategi yang stabil.
Risiko pembalikan arah aliran
- Dalam keadaan goyah, sering mencetuskan stop loss. Risiko ini dapat dikurangkan dengan mengoptimumkan parameter purata bergerak.
Risiko yang berlebihan
- Pengoptimuman berbilang parameter boleh menyebabkan pengoptimuman berlebihan, kombinasi berbilang parameter harus digunakan dan pemeriksaan kehandalan harus dilakukan.
Risiko kelewatan penunjuk teknikal
- Terdapat kelewatan dalam pengiraan penunjuk harga, dan ia tidak boleh bergantung sepenuhnya kepada penunjuk harga.
Arah pengoptimuman
Optimumkan parameter
- Mengoptimumkan parameter tali besi Bol, jenis purata bergerak dan parameter ATR untuk menyesuaikan diri dengan pelbagai jenis dan kitaran.
Pengoptimuman kedudukan
- Uji tahap peratusan risiko pegangan yang berbeza untuk mengoptimumkan kelipatan stop loss.
Pengoptimuman Isyarat
- Ujian menambah isyarat penapisan penunjuk lain, seperti KD, MACD dan lain-lain.
Optimumkan kod
- Mengoptimumkan logik penilaian isyarat, mengurangkan perbelanjaan yang tidak perlu. Menggunakan pengaturcaraan berorientasikan objek untuk meningkatkan skalabiliti.
ringkaskan
Strategi ini mengintegrasikan tali besi Boolean, purata bergerak dan analisis kuantiti transaksi untuk membina sistem perdagangan mekanikal yang mengikuti trend. Keuntungan strategi adalah mekanisme pengesahan isyarat yang kuat, risiko terkawal. Kemudian, kestabilan dan keuntungan strategi dapat ditingkatkan melalui parameter dan pengoptimuman isyarat.
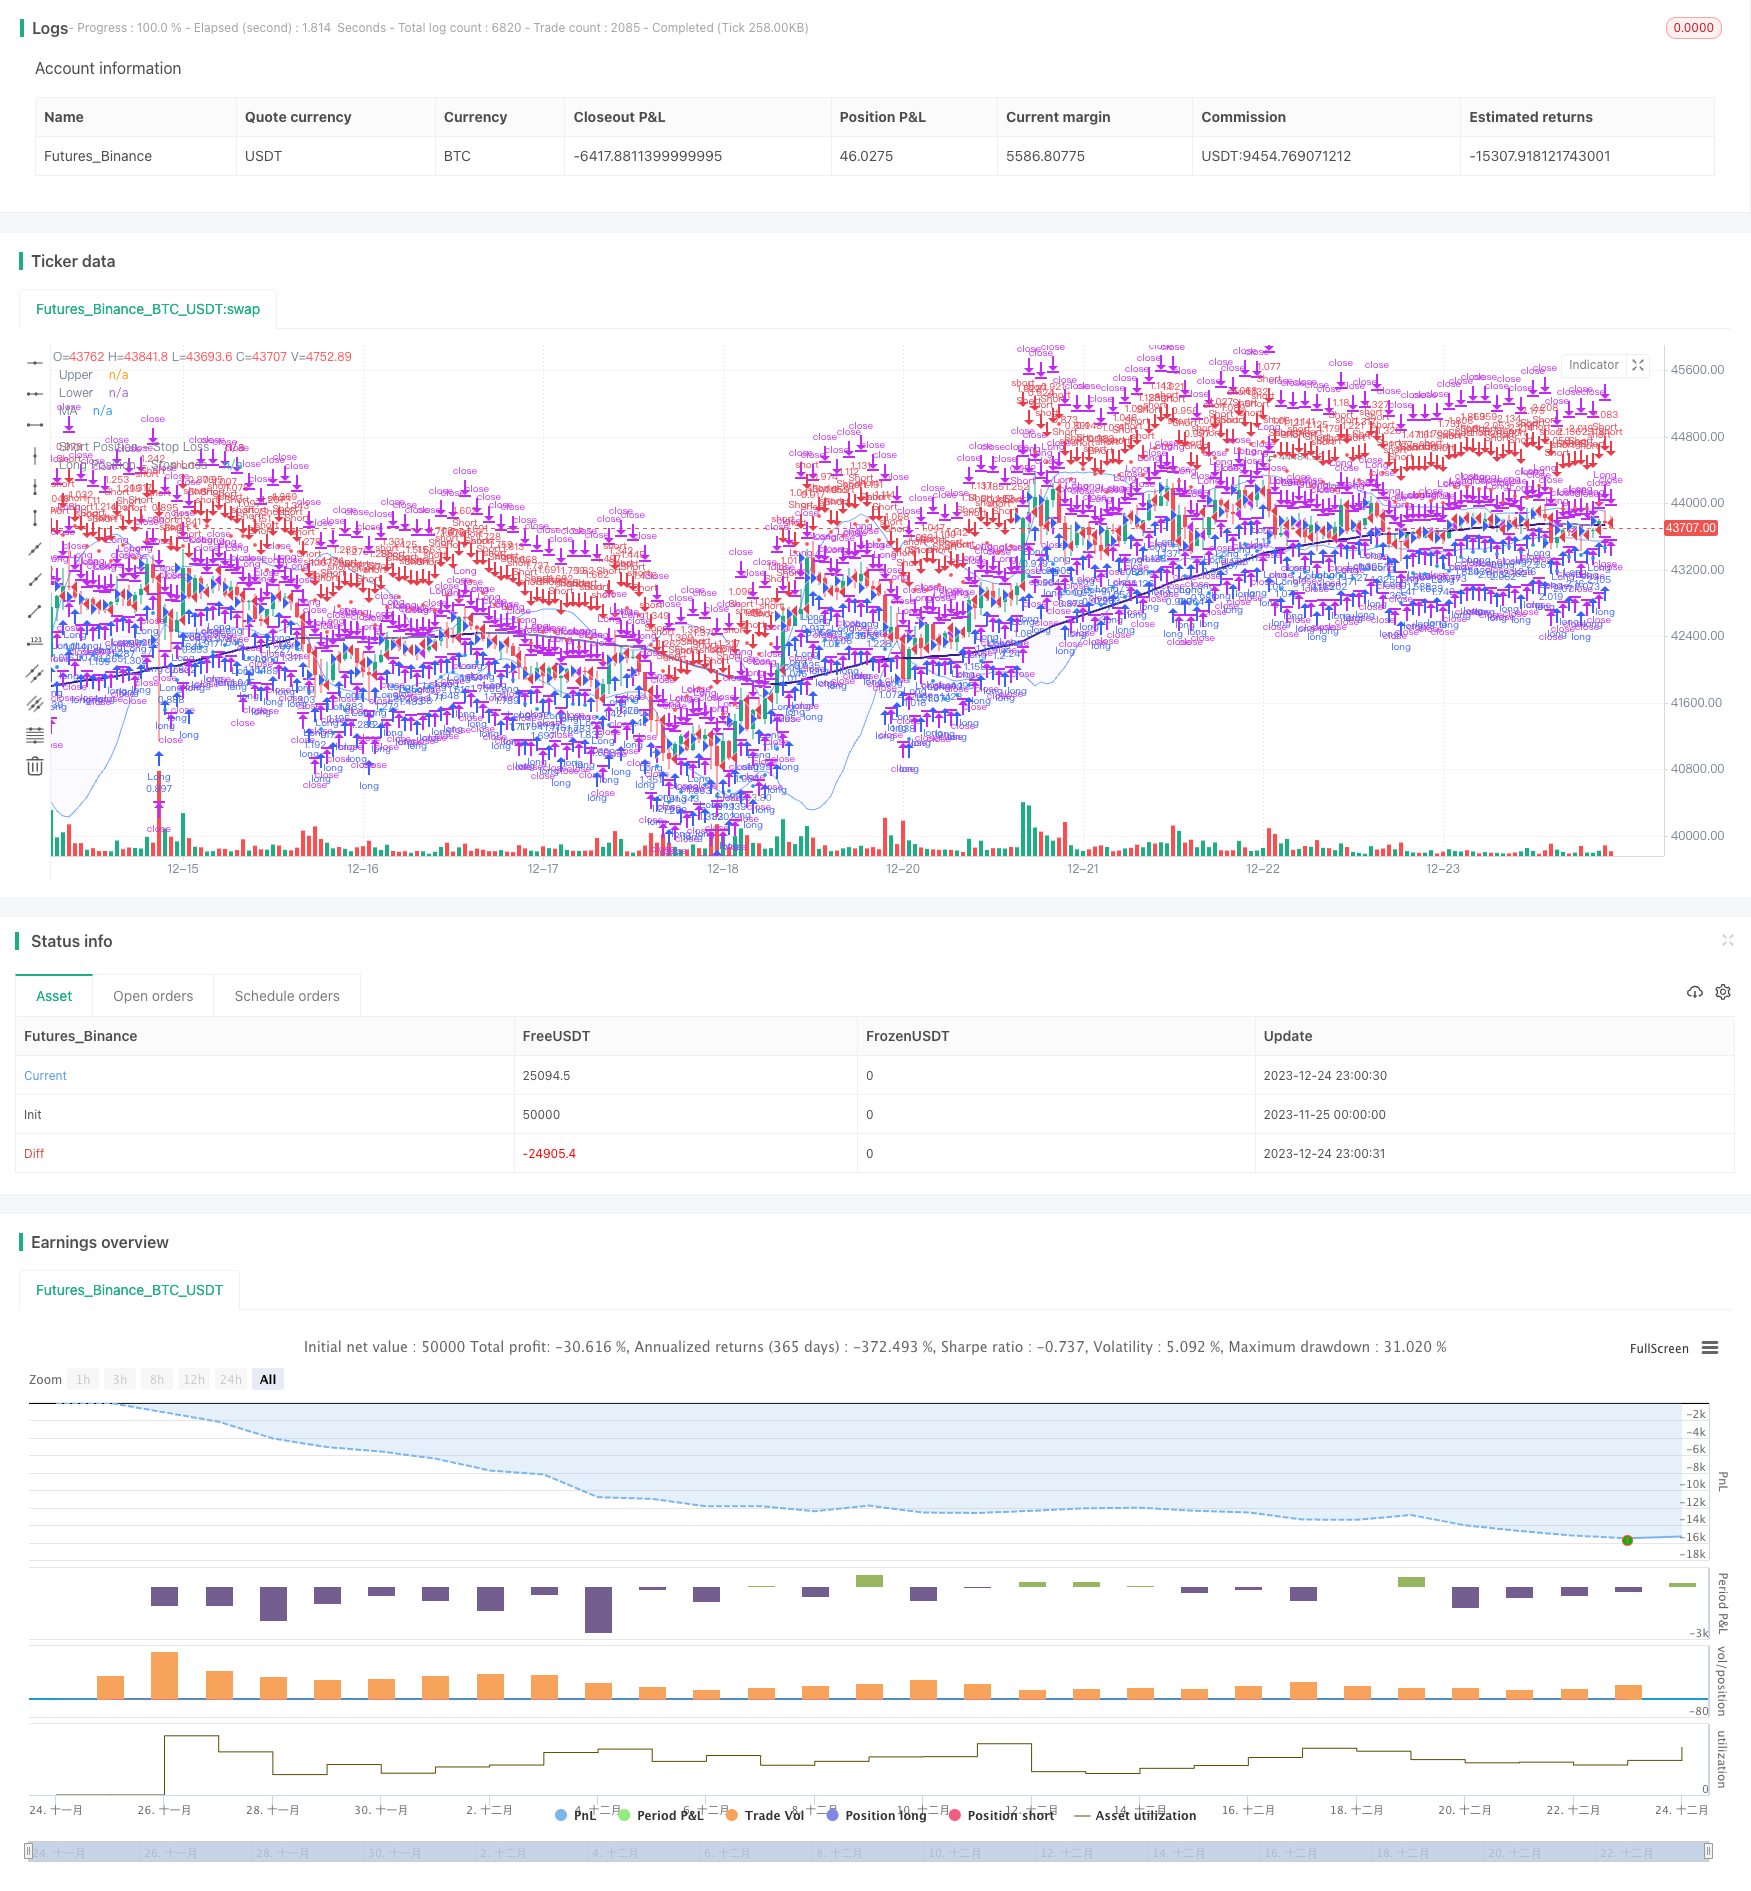
/*backtest
start: 2023-11-25 00:00:00
end: 2023-12-25 00:00:00
period: 1h
basePeriod: 15m
exchanges: [{"eid":"Futures_Binance","currency":"BTC_USDT"}]
*/

// This source code is subject to the terms of the Mozilla Public License 2.0 at https://mozilla.org/MPL/2.0/
// © sosacur01

//@version=5
strategy(title="Bollinger Band | Trend Following", overlay=true, pyramiding=1, commission_type=strategy.commission.percent, commission_value=0.2, initial_capital=10000)

//--------------------------------------

//BACKTEST RANGE
useDateFilter = input.bool(true, title="Filter Date Range of Backtest",
     group="Backtest Time Period")
backtestStartDate = input(timestamp("1 jan 2017"),
     title="Start Date", group="Backtest Time Period",
     tooltip="This start date is in the time zone of the exchange " +
     "where the chart's instrument trades. It doesn't use the time " +
     "zone of the chart or of your computer.")
backtestEndDate = input(timestamp("1 jul 2100"),
     title="End Date", group="Backtest Time Period",
     tooltip="This end date is in the time zone of the exchange " +
     "where the chart's instrument trades. It doesn't use the time " +
     "zone of the chart or of your computer.")
inTradeWindow = true
if not inTradeWindow and inTradeWindow[1]
    strategy.cancel_all()
    strategy.close_all(comment="Date Range Exit")

//--------------------------------------

//LONG/SHORT POSITION ON/OFF INPUT
LongPositions   = input.bool(title='On/Off Long Postion', defval=true, group="Long & Short Position")
ShortPositions  = input.bool(title='On/Off Short Postion', defval=true, group="Long & Short Position")

//--------------------------------------
//MA INPUTS
averageType1    = input.string(defval="WMA", group="MA", title="MA Type", options=["SMA", "EMA", "WMA", "HMA", "RMA", "SWMA", "ALMA", "VWMA", "VWAP"])
averageLength1  = input.int(defval=99, title="MA Lenght", group="MA")
averageSource1  = input(close, title="MA Source", group="MA")

//MA TYPE
MovAvgType1(averageType1, averageSource1, averageLength1) =>
	switch str.upper(averageType1)
        "SMA"  => ta.sma(averageSource1, averageLength1)
        "EMA"  => ta.ema(averageSource1, averageLength1)
        "WMA"  => ta.wma(averageSource1, averageLength1)
        "HMA"  => ta.hma(averageSource1, averageLength1)
        "RMA"  => ta.rma(averageSource1, averageLength1)
        "SWMA" => ta.swma(averageSource1)
        "ALMA" => ta.alma(averageSource1, averageLength1, 0.85, 6)
        "VWMA" => ta.vwma(averageSource1, averageLength1)
        "VWAP" => ta.vwap(averageSource1)
        => runtime.error("Moving average type '" + averageType1 +
             "' not found!"), na


//MA VALUES
ma  = MovAvgType1(averageType1, averageSource1, averageLength1)

//MA CONDITIONS
bullish_ma = close > ma
bearish_ma = close < ma

//PLOT COLOR
ma_plot    = if close > ma
    color.navy
else
    color.rgb(49, 27, 146, 40)

//MA PLOT
plot(ma,color=ma_plot, linewidth=2, title="MA")

//--------------------------------------
//BB INPUTS
length  = input.int(20, minval=1, group="BB")
src     = input(close, title="Source", group="BB")
mult    = input.float(2.0, minval=0.001, maxval=50, title="StdDev", group="BB")

//BB VALUES
basis = ta.sma(src, length)
dev = mult * ta.stdev(src, length)
upper = basis + dev
lower = basis - dev
offset = input.int(0, "Offset", minval = -500, maxval = 500)

//BBPLOT
//plot(basis, "Basis", color=#FF6D00, offset = offset)
p1 = plot(upper, "Upper", color=#2978ffa4, offset = offset)
p2 = plot(lower, "Lower", color=#2978ffa4, offset = offset)
fill(p1, p2, title = "Background", color=color.rgb(33, 47, 243, 97))

//BB ENTRY AND EXIT CONDITIONS
bb_long_entry  = close >= upper
bb_long_exit   = close <= lower
bb_short_entry = close <= lower
bb_short_exit  = close >= upper

//---------------------------------------------------------------
//VOLUME INPUTS
useVolumefilter  = input.bool(title='Use Volume Filter?', defval=false, group="Volume Inputs")
dailyLength      = input.int(title = "MA length", defval = 30, minval = 1, maxval = 100, group = "Volume Inputs")
lineWidth        = input.int(title = "Width of volume bars", defval = 3, minval = 1, maxval = 6, group = "Volume Inputs")
Volumefilter_display  = input.bool(title="Color bars?", defval=false, group="Volume Inputs", tooltip = "Change bar colors when Volume is above average")

//VOLUME VALUES
volumeAvgDaily = ta.sma(volume, dailyLength)

//VOLUME SIGNAL
v_trigger  = (useVolumefilter ? volume > volumeAvgDaily : inTradeWindow)

//PLOT VOLUME SIGNAL
barcolor(Volumefilter_display ? v_trigger ? color.new(#6fe477, 77):na: na, title="Volume Filter")
//---------------------------------------------------------------

//ENTRIES AND EXITS
long_entry  = if inTradeWindow and bullish_ma and bb_long_entry and v_trigger and LongPositions
    true
long_exit   = if inTradeWindow and bb_long_exit
    true

short_entry = if inTradeWindow  and bearish_ma and bb_short_entry and v_trigger and ShortPositions
    true
short_exit  = if inTradeWindow  and bb_short_exit
    true

//--------------------------------------

//RISK MANAGEMENT - SL, MONEY AT RISK, POSITION SIZING
atrPeriod                = input.int(14, "ATR Length", group="Risk Management Inputs")
sl_atr_multiplier        = input.float(title="Long Position - Stop Loss - ATR Multiplier", defval=2, group="Risk Management Inputs", step=0.5)
sl_atr_multiplier_short  = input.float(title="Short Position - Stop Loss - ATR Multiplier", defval=2, group="Risk Management Inputs", step=0.5)
i_pctStop                = input.float(2, title="% of Equity at Risk", step=.5, group="Risk Management Inputs")/100

//ATR VALUE
_atr = ta.atr(atrPeriod)

//CALCULATE LAST ENTRY PRICE
lastEntryPrice = strategy.opentrades.entry_price(strategy.opentrades - 1)

//STOP LOSS - LONG POSITIONS
var float sl = na

//CALCULTE SL WITH ATR AT ENTRY PRICE - LONG POSITION
if (strategy.position_size[1] != strategy.position_size)
    sl := lastEntryPrice - (_atr * sl_atr_multiplier)

//IN TRADE - LONG POSITIONS
inTrade = strategy.position_size > 0

//PLOT SL - LONG POSITIONS
plot(inTrade ? sl : na, color=color.blue, style=plot.style_circles, title="Long Position - Stop Loss")

//CALCULATE ORDER SIZE - LONG POSITIONS
positionSize = (strategy.equity * i_pctStop) / (_atr * sl_atr_multiplier)

//============================================================================================

//STOP LOSS - SHORT POSITIONS
var float sl_short = na

//CALCULTE SL WITH ATR AT ENTRY PRICE - SHORT POSITIONS
if (strategy.position_size[1] != strategy.position_size)
    sl_short := lastEntryPrice + (_atr * sl_atr_multiplier_short)

//IN TRADE SHORT POSITIONS
inTrade_short = strategy.position_size < 0

//PLOT SL - SHORT POSITIONS
plot(inTrade_short ? sl_short : na, color=color.red, style=plot.style_circles, title="Short Position - Stop Loss")

//CALCULATE ORDER - SHORT POSITIONS
positionSize_short = (strategy.equity * i_pctStop) / (_atr * sl_atr_multiplier_short)


//===============================================

//LONG STRATEGY
strategy.entry("Long", strategy.long, comment="Long", when = long_entry, qty=positionSize)
if (strategy.position_size > 0)
    strategy.close("Long", when = (long_exit), comment="Close Long")
    strategy.exit("Long", stop = sl, comment="Exit Long")

//SHORT STRATEGY
strategy.entry("Short", strategy.short, comment="Short", when = short_entry, qty=positionSize_short)
if (strategy.position_size < 0)
    strategy.close("Short", when = (short_exit), comment="Close Short")
    strategy.exit("Short", stop = sl_short, comment="Exit Short")

//ONE DIRECTION TRADING COMMAND (BELLOW ONLY ACTIVATE TO CORRECT BUGS)
//strategy.risk.allow_entry_in(strategy.direction.long)