Strategi dagangan berbilang penunjuk purata bergerak silang
Gambaran keseluruhan
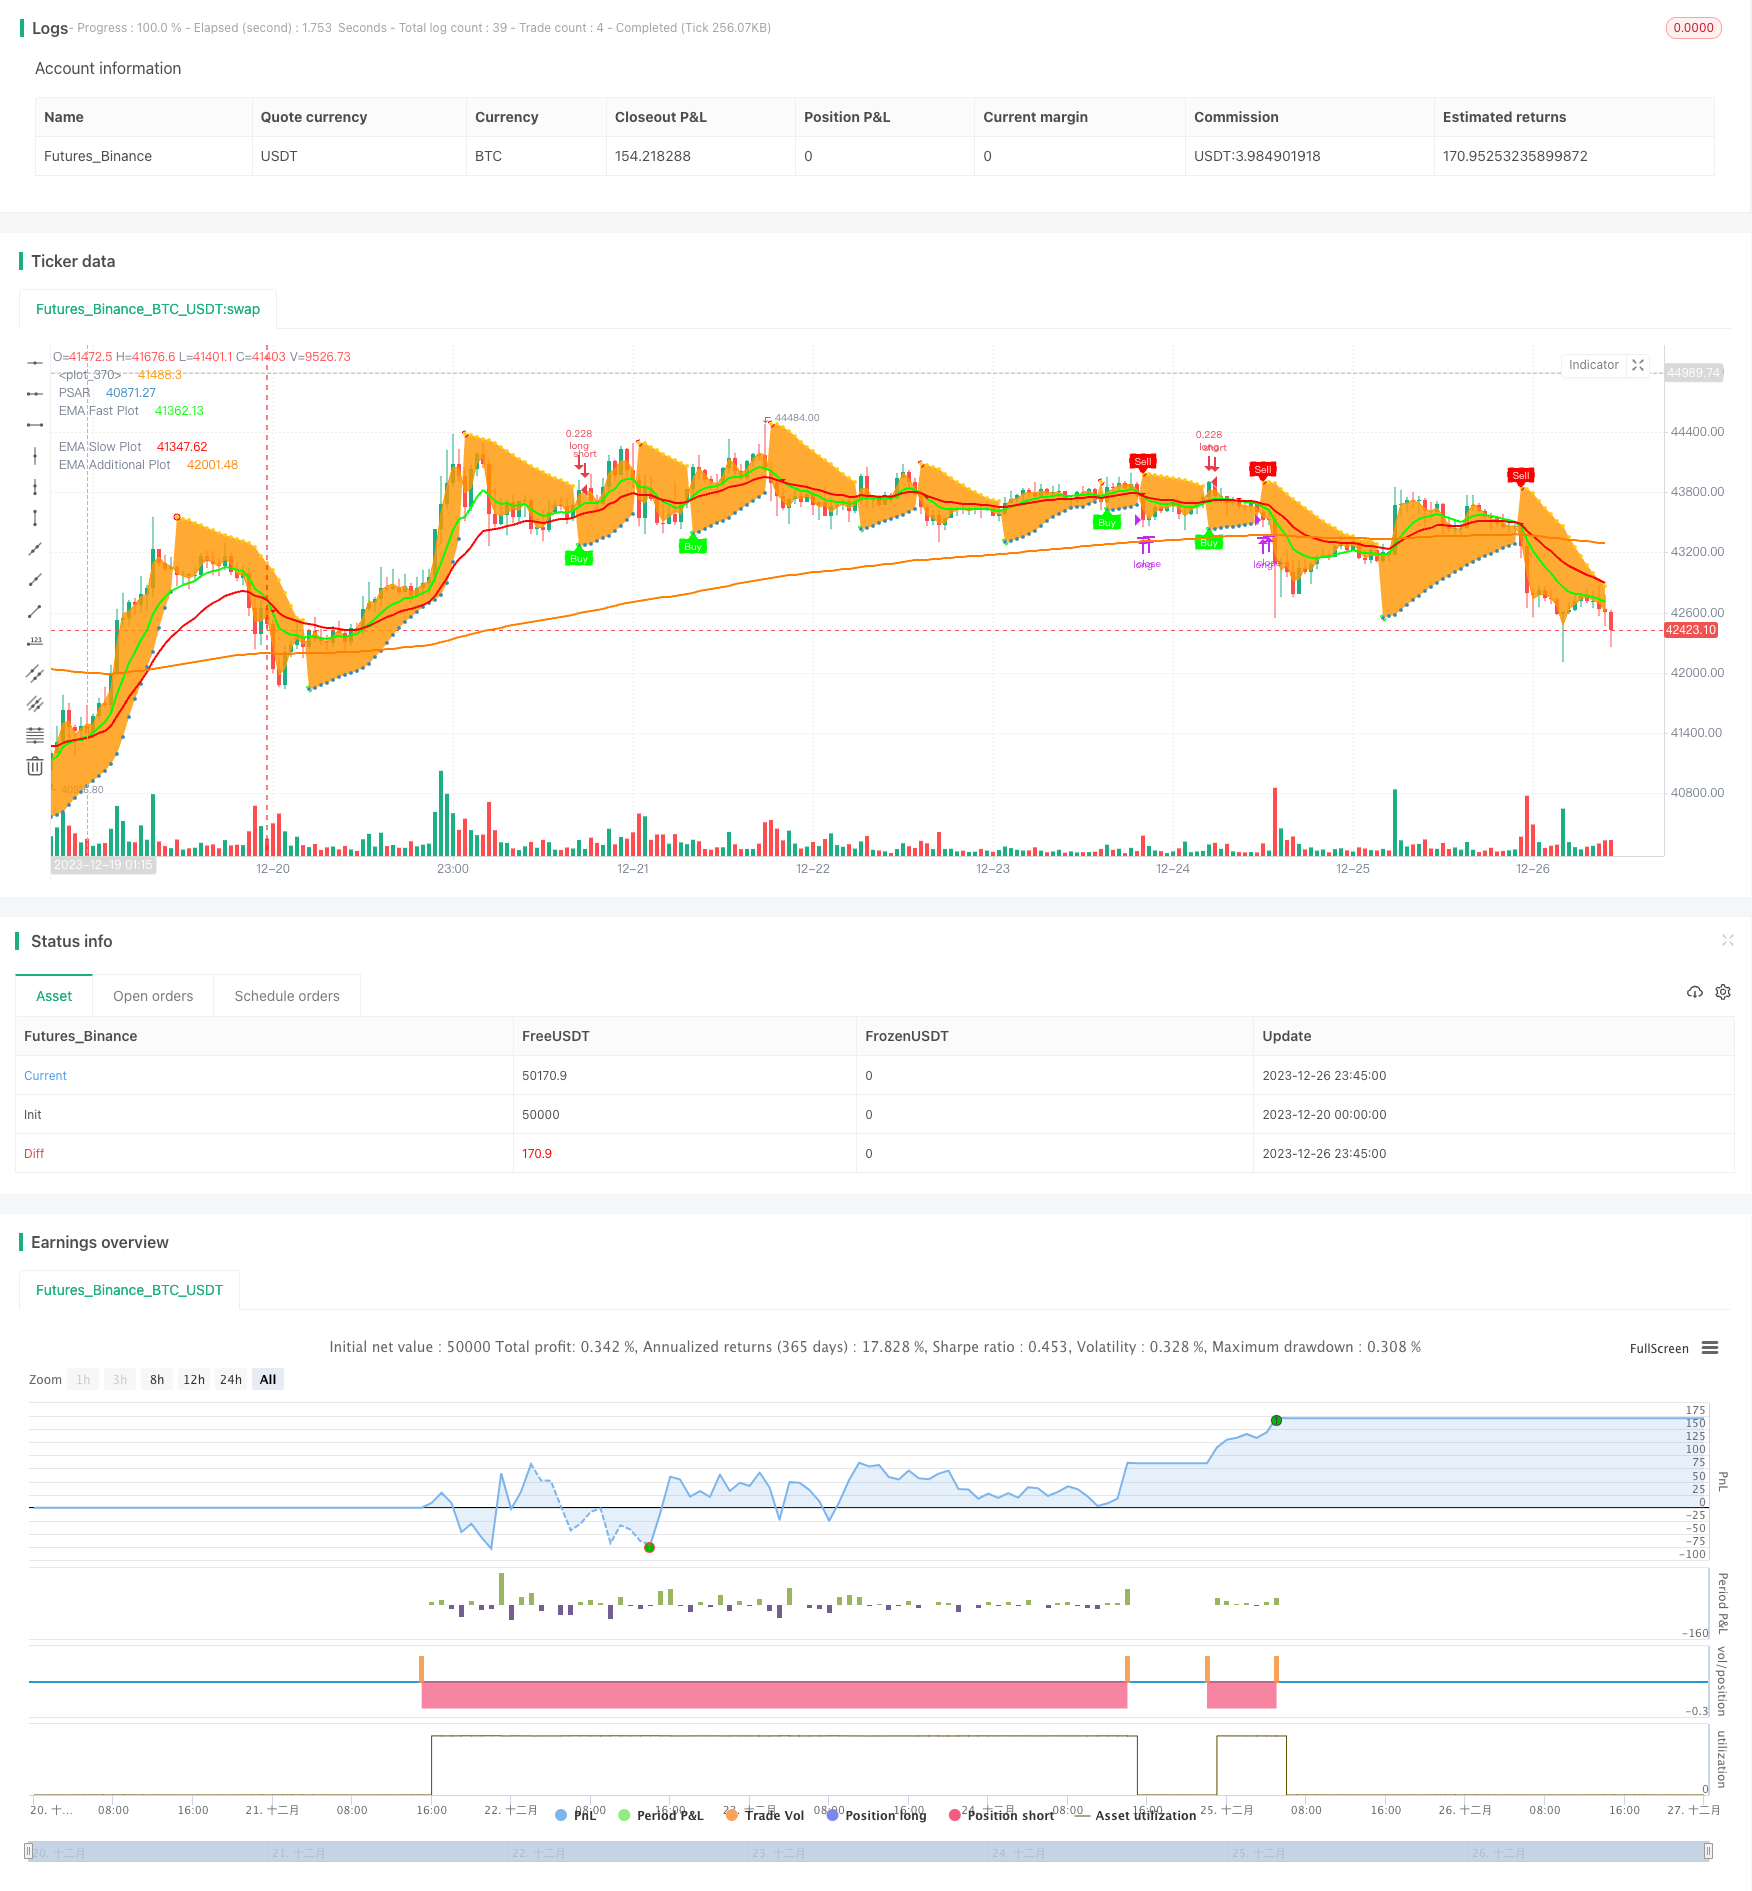
Strategi ini menggabungkan pelbagai petunjuk teknikal, termasuk SAR parabola, TEMA, EMA, RSI, dan OBV, untuk mengenal pasti isyarat pembalikan harga saham, dan menggabungkan penapis trend dan tetapan stop-loss untuk menghasilkan isyarat beli dan jual.
Prinsip Strategi
Strategi ini menggunakan SAR parapolik sebagai penunjuk isyarat reversal harga utama. SAR menunjukkan keadaan bertopeng di atas harga dan keadaan kosong di bawah harga. Apabila SAR menghasilkan isyarat jual apabila ia menerobos ke atas dari bawah harga dan membeli isyarat apabila ia menerobos ke bawah dari atas harga.
Untuk menyaring isyarat palsu, strategi ini menggunakan TEMA atau EMA sebagai isyarat pengesahan. Isyarat beli dihasilkan hanya apabila isyarat SAR dan TEMA (perlahan melalui talian cepat) atau EMA (perlahan melalui talian cepat) muncul bersama; isyarat jual dihasilkan hanya apabila isyarat SAR dan TEMA (perlahan melalui talian cepat) atau EMA (perlahan melalui talian cepat) muncul bersama.
Strategi ini juga menyediakan RSI dan OBV sebagai isyarat pengesahan pilihan.
Selain itu, strategi ini menyediakan tiga EMA menunjukkan grafik petunjuk teknikal, yang dapat melihat trend harga dengan lebih jelas; menyediakan eMAMA menunjukkan indikator modaliti, yang digunakan untuk membantu menentukan titik perubahan trend.
Strategi ini juga menyediakan jadual maklumat yang merangkumi indikator di bawah carta, yang membolehkan anda melihat dengan cepat status terkini bagi pelbagai indikator.
Analisis kelebihan
Strategi ini menggabungkan pelbagai petunjuk seperti SAR, EMA / TEMA, RSI, OBV, dan lain-lain untuk mengesan isyarat pembalikan harga dengan berkesan dan mengelakkan pecah palsu. Penambahan penilaian trend EMA tiga dan purata modem eMAMA dapat meningkatkan ketepatan.
Grafik menunjukkan banyak petunjuk, yang membolehkan anda melihat keadaan pasaran secara menyeluruh. Tabel ringkasan petunjuk yang disertakan, yang membolehkan anda mendapatkan status terkini untuk beberapa petunjuk dengan cepat.
Peraturan logik perdagangan jelas, parameter boleh disesuaikan, dan boleh disesuaikan dengan pelbagai jenis perdagangan.
Analisis risiko
Strategi ini bergantung kepada penukaran penunjuk untuk menghantar isyarat, dan jika penunjuk tidak ditetapkan dengan betul, ia akan menghasilkan banyak isyarat perdagangan bising. Parameter penunjuk perlu disesuaikan dengan pelbagai jenis perdagangan.
Dalam pasaran yang disusun secara mendatar, penunjuk SAR mungkin menghasilkan isyarat palsu yang kerap. Dalam kes ini, perlu memberi perhatian kepada pengesahan penunjuk penghakiman trend.
Pemilihan varieti perdagangan yang tidak tepat juga boleh menyebabkan strategi gagal. Anda perlu memilih varieti yang mempunyai trend yang jelas untuk menggunakan strategi tersebut.
Arah pengoptimuman
Strategi ini boleh dioptimumkan dalam beberapa arah:
- Optimumkan parameter SAR, mengurangkan isyarat bunyi
- Mengoptimumkan parameter purata bergerak untuk meningkatkan ketepatan penilaian trend
- Tukarkan pengesahan indikator, uji kesan RSI, OBV dan lain-lain
- Menambah metrik tambahan, analisis pelbagai kerangka masa
- Mengoptimumkan strategi penangguhan kerugian dan mengehadkan kerugian tunggal
ringkaskan
Strategi perdagangan berbilang indikator lintas rata-rata ini, mengintegrasikan pelbagai indikator analisis teknikal yang biasa digunakan, membentuk isyarat keputusan membeli dan menjual, dapat mengenal pasti titik perubahan harga dengan berkesan, mempunyai parameter yang boleh disesuaikan, ciri yang mudah dioptimumkan, sesuai untuk aplikasi pedagang kuantitatif yang berpengalaman. Tetapi perlu mengoptimumkan parameter mengikut ciri-ciri pelbagai jenis, memilih varieti perdagangan yang jelas untuk trend, untuk memberi kesan kepada strategi, dan mengelakkan banyak isyarat bunyi.
/*backtest
start: 2023-12-20 00:00:00
end: 2023-12-27 00:00:00
period: 45m
basePeriod: 5m
exchanges: [{"eid":"Futures_Binance","currency":"BTC_USDT"}]
*/

//
// ██╗      █████╗ ███████╗ ██████╗██╗██╗   ██╗██╗ ██████╗ ██╗   ██╗███████╗    ███╗   ███╗ ██████╗ ███╗   ██╗██╗  ██╗
// ██║     ██╔══██╗██╔════╝██╔════╝██║██║   ██║██║██╔═══██╗██║   ██║██╔════╝    ████╗ ████║██╔═══██╗████╗  ██║██║ ██╔╝
// ██║     ███████║███████╗██║     ██║██║   ██║██║██║   ██║██║   ██║███████╗    ██╔████╔██║██║   ██║██╔██╗ ██║█████╔╝
// ██║     ██╔══██║╚════██║██║     ██║╚██╗ ██╔╝██║██║   ██║██║   ██║╚════██║    ██║╚██╔╝██║██║   ██║██║╚██╗██║██╔═██╗
// ███████╗██║  ██║███████║╚██████╗██║ ╚████╔╝ ██║╚██████╔╝╚██████╔╝███████║    ██║ ╚═╝ ██║╚██████╔╝██║ ╚████║██║  ██╗
// ╚══════╝╚═╝  ╚═╝╚══════╝ ╚═════╝╚═╝  ╚═══╝  ╚═╝ ╚═════╝  ╚═════╝ ╚══════╝    ╚═╝     ╚═╝ ╚═════╝ ╚═╝  ╚═══╝╚═╝  ╚═╝
//																		 https://www.tradingview.com/u/LasciviousMonk/
//                                                                                                    © LasciviousMonk
//
//
//  This source code is subject to the terms of the Mozilla Public License 2.0 at https://mozilla.org/MPL/2.0/
//  This script provided freely.  No guarantee of functionality is provided.  You are welcome to use, revise, or modify
//  this code in any way you wish.  However, I kindly request that you publish any scripts originating from this code as
//  'Public'.  Please do not use this code as a basis for "Protected" or "Invite Only" scripts.
//
//
// PSAR + EMA + TEMA combines Parabolic PSAR plus EMA and TEMA trendlines.
//      - EMA and TEMA crossovers have an up or down triangle to indicate direction of cross.  Please note
//          that because these are Moving Averages (MAs), the triangle may not exactly line up with the crossover.
//      - Added MESA Adaptive Moving Average (eMAMA).  Crossovers of the fast and slow eMAMA may be used instead of
// 			EMA or TEMA.
//		- Added third EMA line.  May be used to filter entries.  For example, set the additional EMA to 200.  Buy signals
//			wil only be sent if the price is greater than the additional EMA.
//		- Added RSI and OBV as alternative PSAR confirmations.
//
// "Traffic Light" table: summarizes PSAR, RSI, SRSI, TEMA, EMA, eMAMA, MACD, OBV, and CMF indicators in a table.
//  This is intended as a quick "heads up", not to replace the indicators themselves.
//      - Arrows indicate direction of change since the last bar.
//      - Moving average indicators are indicated as green if the fast MA > slow MA and fast [T]EMA is increasing, red otherwise.
//          [T]EMA will be yellow if fast MA has increased over the last 2 periods but fast MA < slow MA.
//      - PSAR is as green if the PSAR is increasing, red if it is decreasing.
//      - RSI is indicated as green if RSI < oversold, red if RSI > overbought, yellow otherwise.
//      - SRSI is indicated as green K < oversold, and red if K > overbought.  If oversold < K < overbought,
//          green if K > D and red if K < D.
//      - MACD, OBV and CMF are green if bullish, red if bearish.
//
//
//  Suggestions for use:
//      - Use fast EMA crossing above slow EMA as a confirmation for PSAR signals.
//      - TEMA or eMAMA can also be used for confirmation signals insead.
//      - Instead of using a moving average (EMA, TEMA, etc) for confirmation, you may use RSI or OBV.
//      - The "traffic light" table is intended as a "heads up" to call your attention to other indicators
//          you may want to check.  I suggest Cipher B/VMC Cipher_B, Neglected Volume, and/or CM_Ult_MacD_MTF
//          as useful comparions.
//
// Please don't rely solely on the table.  It is intended to alert you to look more closely at a plot, not to
//    provide all the information you need to enter or exit a position.  I find the table to be a nice companion
//    to VMC Cipher_B, which can be overwhelming in its complexity.
//
// Code used:
//      - TEMA With Alert by BerkSay
//      - Parabolic SAR by Alex Orekhov (everget)
//      - Ehlers MESA Adaptive Moving Average [LazyBear]
//      - EMA, RSI and SRSI built-ins.
//@version=4
strategy(overlay=true, title="PSAR + EMA/TEMA/RSI/OBV", currency = 'USD', shorttitle="PSAR+",
 pyramiding = 0, default_qty_type=strategy.percent_of_equity, default_qty_value=20,
 initial_capital=5000, calc_on_every_tick=true, calc_on_order_fills=false,
 commission_type=strategy.commission.percent, commission_value=0.1)

// ------------------------------------------------<[ Color Constants ]>----------------------------------------------

// Color values used from Pine Magic.  https://www.tradingview.com/script/yyDYIrRQ-Pine-Color-Magic-and-Chart-Theme-Simulator/
var transparent = color.new(color.black, 100)
var darkpurple  = #550055, dpurple = darkpurple // Alias for dark purple,  Not recommended for use on "Dark Charts"
var purple      = #990099
var fuchsia     = #FF00FF
var violet      = #AA00FF
var hanpurple   = #6000FF
var blue        = #0000FF
var cichlid     = #0040FF
var azure       = #0080FF
var skyblue     = #00C0FF
var aqua        = #00FFFF // Not recommended for use on "Light Charts" with 1px line thickness
var mint        = #00FF80
var lime        = #00FF00
var chartreuse  = #80FF00
var yellow      = #FFFF00 // Not recommended for use on "Light Charts"
var amber       = #FFCC00
var orange      = #FF8000
var redorange   = #FF4000
var red         = #FF0000
var hotpink     = #FF0080
var pink        = #FF80FF // Not recommended for use on "Light Charts"

// ------------------------------------------------<[ User Input ]>---------------------------------------------------
sourceGlobal = input(title="Source for indicator", defval=close, type=input.source, group="Global")
tradeLong = input(title="Create long positions?", defval=true, type=input.bool, group="Global")
tradeShort = input(title="Create short positions?", defval=false, type=input.bool, group="Global")


showPSAR = input(true, "Show PSAR?", group="PSAR")
psarStart = input(title="PSAR Start", type=input.float, step=0.001, defval=0.02, group="PSAR")
psarIncrement = input(title="PSAR Increment", type=input.float, step=0.001, defval=0.02, group="PSAR")
psarMaximum = input(title="PSAR Maximum", type=input.float, step=0.01, defval=0.2, group="PSAR")
psarConfirmation = input(title="Confirmation signal:", defval="EMA",
     options=["EMA", "TEMA", "eMAMA", "RSI", "OBV"], group="PSAR")
psarHighlightStartPoints = input(title="PSAR Highlight Start Points?", type=input.bool, defval=true, group="PSAR")
psarShowLabels = input(title="PSAR Show Buy/Sell Labels?", type=input.bool, defval=true, group="PSAR")
psarHighlightState = input(title="PSAR Highlight State?", type=input.bool, defval=false, group="PSAR")
colorPSARLong = input(title="Long", type=input.color, defval=lime, group="PSAR", inline="colors")
colorPSARShort = input(title="Short", type=input.color, defval=red, group="PSAR", inline="colors")
useSL = input(defval=false, type=input.bool, title="Set stop loss to PSAR plot?")

showTEMA = input(false, "Show TEMA?", group="Triple EMA", inline="showTEMA")
showTEMAfill = input(title="Shade TEMA?", defval=false, type=input.bool, group="Triple EMA", inline="showTEMA")
lengthTEMAFast = input(title="TEMA Fast length", defval=13, minval=1, group="Triple EMA", inline="TemaFast")
colorTEMAFast = input(title="",type=input.color, defval=lime, inline="TemaFast", group="Triple EMA")
lengthTEMASlow = input(title="TEMA Slow length", defval=34, minval=1, group="Triple EMA", inline="TemaSlow")
colorTEMASlow = input(title="",type=input.color, defval=red, group="Triple EMA", inline="TemaSlow")
thicknessTEMA=input(title="Line thickness", defval=2, type=input.integer, minval=1, maxval=4, step=1, group="Triple EMA")

showEMA = input(defval=true, type=input.bool, title="Show EMA?", group="EMA", inline="showEMA")
showEMAfill = input(title="Shade EMA?", defval=false, type=input.bool, group="EMA", inline="showEMA")
lengthEMAFast = input(9, title='EMA Fast Length', step=1, type=input.integer, group="EMA", inline="EmaFast")
colorEMAFast = input(title="",type=input.color, defval=lime, inline="EmaFast", group="EMA")
lengthEMASlow = input(21, title='EMA Slow Length', step=1, type=input.integer, group="EMA", inline="EmaSlow")
colorEMASlow = input(title="",type=input.color, defval=red, group="EMA", inline="EmaSlow")
lengthEMA200 = input(200, title='EMA Additional Length', step=1, type=input.integer, group="EMA", inline="EMA200")
colorEMA200 = input(title="",type=input.color, defval=orange, group="EMA", inline="EMA200")
filterEMA200 = input(title="Use as filter?", defval=false, type=input.bool, group="EMA", inline="EMA200", tooltip="Buy and sell signals are filtered on the additional EMA line, commonly set to 200.  This takes effect even if the PSAR confirmation is set to something other than EMA.")

thicknessEMA=input(title="Line thickness", defval=2, type=input.integer, minval=1, maxval=4, step=1, group="EMA")

lengthRSI = input(title="RSI Length", type=input.integer, defval=14, group="RSI")
rsiOverbought = input(title="Overbought Level", type=input.integer, defval=60, group="RSI", inline="levels")
rsiOversold = input(title="Oversold Level", type=input.integer, defval=40, group="RSI", inline="levels")

showeMAMA = input(defval=false, title="Show eMAMA?", type=input.bool, group="Ehler's MESA Adaptive Moving Average", inline="fill")
showEMAMAfill = input(title="Shade eMAMA?", defval=false, type=input.bool, group="Ehler's MESA Adaptive Moving Average", inline="fill")
fastlimitEMAMA=input(.5, title="Fast Limit", group="Ehler's MESA Adaptive Moving Average")
slowlimitEMAMA=input(.05, title="Slow Limit", group="Ehler's MESA Adaptive Moving Average")
thicknessEMAMA=input(title="Line thickness", defval=2, type=input.integer, minval=1, maxval=4, step=1, group="Ehler's MESA Adaptive Moving Average")

coloreMAMA = input(title="eMAMA",type=input.color, defval=lime, group="Ehler's MESA Adaptive Moving Average", inline="colors")
coloreFAMA = input(title="eFAMA",type=input.color, defval=red, group="Ehler's MESA Adaptive Moving Average", inline="colors")

lengthOBV = input(defval=20, title="OBV Length", type=input.integer, group="On Balance Volume")
emaOBV    = input(defval=9, title="EMA length", type=input.integer, group="On Balance Volume")

lengthStoch = input(14, "Stochastic Length", minval=1, group="SRSI")
smoothK = input(3, "SRSI K Smoothing", minval=1, group="SRSI")
smoothD = input(3, "SRSI D Smoothing", minval=1, group="SRSI")
srsiOverbought = input(defval=80, title="Overbought level", type=input.integer, group="SRSI", inline="levels")
srsiOversold = input(defval=20, title="Oversold level", type=input.integer, group="SRSI", inline="levels")

lengthMACDfast = input(title="Fast Length", type=input.integer, defval=12, group="MACD")
lengthMACDslow = input(title="Slow Length", type=input.integer, defval=26, group="MACD")
lengthMACDsignal = input(title="Signal Smoothing", type=input.integer, minval = 1, maxval = 50, defval = 9, group="MACD")

lengthCMF = input(20, minval=1, group="Chaiken Money Flow")

showTable = input(defval=false, title="Show summary table?", type=input.bool, group="Summary Table")
tablePosition = input(title="Summary Table Position", defval=position.bottom_left,
     options=[position.bottom_left,
     position.top_left, position.bottom_right, position.top_right], group="Summary Table")
tableTextSize = input(title="Table Text Size", defval=size.tiny,
     options=[size.auto, size.tiny, size.small, size.normal, size.large, size.huge], group="Summary Table")

useDateRange = input(defval=true, title="Limit backtesting by date", type=input.bool, group="Limit by date",
	 tooltip="Limit window for backtesting.  This allows you to compare different TFs over the same period.")
rangeType = input(defval="30 Days", title="Date range:", options=["Custom", "30 Days", "90 Days", "180 Days", "Year to Date"], group="Limit by date")


startDate = input(title="Start Date (DD/MM/YYYY)", type=input.time,
     defval=timestamp("1 Jan 2021 1:01 -0400"), group="Limit by date")
endDate =   input(title="End Date (DD/MM/YYYY)  ", type=input.time,
     defval=timestamp("31 Dec 2100 19:59 -0400"), group="Limit by date", tooltip="You likely want to leave this far in the future.")

startDate := rangeType == "Custom" ? startDate :
     rangeType == "30 Days" ? timenow - 2592000000 :
     rangeType == "90 Days" ? timenow - 7776000000 :
     rangeType == "180 Days" ? timenow - 15552000000 :
     rangeType == "Year to Date" ? timestamp(syminfo.timezone, year(timenow), 01, 01, 00, 01) : na

inDateRange = (time >= startDate) and (time < endDate)
inDateRange := true


// ------------------------------------------------<[  Variable Declarations ]>----------------------------------------------
var bool psarConfirmationBuy = na
var bool psarConfirmationSell = na
var float eMAMA = na
var float eFAMA = na

var float historicalHigh = 0 // for OBV scaling

// -------------------------------------------------------<[ Functions ]>----------------------------------------------------
fDirection(series, length) =>
    rising(series,length) ? "↑" : "↓"

fTEMA(sourceTEMA, length) =>
    Tema1 = ema(sourceTEMA, length)
    Tema2 = ema(Tema1, length)
    Tema3 = ema(Tema2, length)
    3 * Tema1 - 3 * Tema2 + Tema3

fMAMA(sourceEMAMA, slowlimitEMAMA, fastlimitEMAMA) =>
	var float p = na
	var float i2 = na
	var float q2 = na
	var float re = na
	var float im = na
	var float spp = na
	sp = (4*sourceEMAMA + 3*sourceEMAMA[1] + 2*sourceEMAMA[2] + sourceEMAMA[3]) / 10.0
	dt = (.0962*sp + .5769*nz(sp[2]) - .5769*nz(sp[4])- .0962*nz(sp[6]))*(.075*nz(p[1]) + .54)
	q1 = (.0962*dt + .5769*nz(dt[2]) - .5769*nz(dt[4])- .0962*nz(dt[6]))*(.075*nz(p[1]) + .54)
	i1 = nz(dt[3])
	jI = (.0962*i1 + .5769*nz(i1[2]) - .5769*nz(i1[4])- .0962*nz(i1[6]))*(.075*nz(p[1]) + .54)
	jq = (.0962*q1 + .5769*nz(q1[2]) - .5769*nz(q1[4])- .0962*nz(q1[6]))*(.075*nz(p[1]) + .54)
	i2_ = i1 - jq
	q2_ = q1 + jI
	i2 := .2*i2_ + .8*nz(i2[1])
	q2 := .2*q2_ + .8*nz(q2[1])
	re_ = i2*nz(i2[1]) + q2*nz(q2[1])
	im_ = i2*nz(q2[1]) - q2*nz(i2[1])
	re := .2*re_ + .8*nz(re[1])
	im := .2*im_ + .8*nz(im[1])
	p1 = iff(im!=0 and re!=0, 360/atan(im/re), nz(p[1]))
	p2 = iff(p1 > 1.5*nz(p1[1]), 1.5*nz(p1[1]), iff(p1 < 0.67*nz(p1[1]), 0.67*nz(p1[1]), p1))
	p3 = iff(p2<6, 6, iff (p2 > 50, 50, p2))
	p := .2*p3 + .8*nz(p3[1])
	spp := .33*p + .67*nz(spp[1])
	phaseEMAMA = atan(q1 / i1)
	dphase_ = nz(phaseEMAMA[1]) - phaseEMAMA
	dphase = iff(dphase_< 1, 1, dphase_)
	alpha_ = fastlimitEMAMA / dphase
	alpha = iff(alpha_ < slowlimitEMAMA, slowlimitEMAMA, iff(alpha_ > fastlimitEMAMA, fastlimitEMAMA, alpha_))


fOBV(src) =>
    changeOBV = change(src)
    cum(changeOBV > 0 ? volume : changeOBV < 0 ? -volume : 0*volume)

// -------------------------------------------<[ Variable Calculations ]>------------------------------------------
temaSlow = fTEMA(sourceGlobal, lengthTEMASlow)
temaFast = fTEMA(sourceGlobal, lengthTEMAFast)
shortTema = crossover(temaSlow, temaFast)
longTema = crossunder(temaSlow, temaFast)
fillTema = temaFast>temaSlow ? color.new(colorTEMAFast,80) : color.new(colorTEMASlow,80)

emaFast = ema(sourceGlobal, lengthEMAFast)
emaSlow = ema(sourceGlobal, lengthEMASlow)
ema200 = ema(sourceGlobal, lengthEMA200)
longEMA = crossover(emaFast, emaSlow)
shortEMA = crossunder(emaFast , emaSlow)
fillEMA = emaFast>emaSlow ? color.new(colorEMAFast,80) : color.new(colorEMASlow,80)

cumOBV = fOBV(sourceGlobal)
oscOBV = (cumOBV - ema(cumOBV,lengthOBV))
changeOBV = change(sourceGlobal)
shortOBV = ema(cumOBV, lengthOBV)


psar = sar(psarStart, psarIncrement, psarMaximum)
psarDir = psar < close ? 1 : -1
colorPSAR = psarDir == 1 ? color.new(#3388bb,0) : color.new(#fdcc02,0)
colorPSARFill = psarHighlightState ? (psarDir == 1 ? color.new(colorPSARLong,90) : color.new(colorPSARShort,90)) : na
psarChangeCond = psarDir != psarDir[1]

valueRSI = rsi(sourceGlobal, lengthRSI)


if psarConfirmation == "EMA"
    if emaFast > emaSlow
        psarConfirmationBuy := true
        psarConfirmationSell := false
    else if emaFast < emaSlow
        psarConfirmationSell := true
        psarConfirmationBuy := false
else if psarConfirmation == "TEMA"
    if temaFast > temaSlow
        psarConfirmationBuy := true
        psarConfirmationSell := false
    else if temaFast < temaSlow
        psarConfirmationSell := true
        psarConfirmationBuy := false
else if psarConfirmation == "eMAMA"
    if eMAMA > eFAMA
        psarConfirmationBuy := true
        psarConfirmationSell := false
    else if eMAMA < eFAMA
        psarConfirmationSell := true
        psarConfirmationBuy := false
else if psarConfirmation == "RSI"
	if valueRSI < 40
        psarConfirmationBuy := true
        psarConfirmationSell := false
    else if valueRSI > 60
        psarConfirmationSell := true
        psarConfirmationBuy := false
else if psarConfirmation == "OBV"
	if oscOBV > 0
        psarConfirmationBuy := true
        psarConfirmationSell := false
    else if oscOBV < 0
        psarConfirmationSell := true
        psarConfirmationBuy := false

psarBuySignal = psarDir == 1 and psarDir[1] == -1 and (filterEMA200 ? open > ema200 : true) and inDateRange
psarSellSignal = psarDir == -1 and psarDir[1] == 1 and (filterEMA200 ? open < ema200 : true) and inDateRange

eMAMA := fMAMA(sourceGlobal, slowlimitEMAMA, fastlimitEMAMA)*sourceGlobal + (1 - fMAMA(sourceGlobal, slowlimitEMAMA, fastlimitEMAMA))*nz(eMAMA[1])
eFAMA := .5*fMAMA(sourceGlobal, slowlimitEMAMA, fastlimitEMAMA)*eMAMA + (1 - .5*fMAMA(sourceGlobal, slowlimitEMAMA, fastlimitEMAMA))*nz(eFAMA[1])
longMAMA=crossover(eMAMA, eFAMA)
shortMAMA=crossunder(eMAMA,eFAMA)
fillEMAMA = eMAMA>eFAMA ? color.new(coloreMAMA, 80) : color.new(coloreFAMA, 80)

srsiK = sma(stoch(valueRSI, valueRSI, valueRSI, lengthStoch), smoothK)
srsiD = sma(srsiK, smoothD)

fastMACD = ema(sourceGlobal, lengthMACDfast)
slowMACD = ema(sourceGlobal, lengthMACDslow)
macd = fastMACD - slowMACD
signalMACD = ema(macd, lengthMACDsignal)

adCMF = close==high and close==low or high==low ? 0 : ((2*close-low-high)/(high-low))*volume
mfCMF = sum(adCMF, lengthCMF) / sum(volume, lengthCMF)


// ================================== //
// ----> Conditional Parameters <---- //
// ================================== //

// ================================== //
// -------> Risk Mitigation <-------- //
// ================================== //

// ================================== //
// --------> Logical Order <--------- //
// ================================== //


// -------------------------------------------<[ Graphical Display ]>------------------------------------------

// TEMA plots
plotTemaSlow = plot(showTEMA ? temaSlow: na, color=color.new(colorTEMASlow,20), title="TEMA Slow plot", linewidth=thicknessTEMA)
plotTemaFast = plot(showTEMA ? temaFast: na, color=color.new(colorTEMAFast,20), title="TEMA Fast plot", linewidth=thicknessTEMA)

plotshape(showTEMA and longTema ? temaFast: na, style=shape.triangleup, location=location.absolute,
     size=size.tiny, title="TEMA Cross Up", color=color.new(colorTEMAFast,10))
plotshape(showTEMA and shortTema ? temaSlow: na, style=shape.triangledown, location=location.absolute,
     size=size.tiny, title="TEMA Cross Down", color=color.new(colorTEMASlow,10))
fill(plotTemaFast, plotTemaSlow, color=showTEMAfill ? fillTema : transparent, title="TEMA fill")

// EMA plots
plotEmaFast = plot(showEMA ? emaFast: na, title='EMA Fast Plot', color=colorEMAFast, linewidth=thicknessEMA)
plotEmaSlow = plot(showEMA ? emaSlow: na, title='EMA Slow Plot', color=colorEMASlow, linewidth=thicknessEMA)
plotEMA200 = plot(showEMA ? ema200: na, title='EMA Additional Plot', color=colorEMA200, linewidth=thicknessEMA)

plotshape(showEMA and longEMA ? emaFast : na, style=shape.triangleup, location=location.absolute, size=size.tiny,
	 title="EMA Cross Up",color=colorEMAFast)
plotshape(showEMA and shortEMA ? emaFast : na, style=shape.triangledown, location=location.absolute, size=size.tiny,
	 title="EMA Cross Down",color=colorEMASlow)
fill(plotEmaFast, plotEmaSlow, color=showEMAfill ? fillEMA : transparent, title="EMA fill")

// PSAR plots
psarPlot = plot(showPSAR ? psar: na, title="PSAR", style=plot.style_circles, linewidth=1, color=colorPSAR)
plotshape(showPSAR and psarBuySignal and psarHighlightStartPoints ? psar : na, title="PSAR Long Start", location=location.absolute,
	 style=shape.circle, size=size.tiny, color=colorPSARLong)
plotshape(showPSAR and psarBuySignal and psarShowLabels and psarConfirmationBuy ? psar : na, title="PSAR Buy Label", text="Buy", location=location.absolute,
	 style=shape.labelup, size=size.tiny, color=colorPSARLong, textcolor=color.white)
plotshape(showPSAR and psarSellSignal and psarHighlightStartPoints ? psar : na, title="PSAR Short Start", location=location.absolute,
	 style=shape.circle, size=size.tiny, color=colorPSARShort)
plotshape(showPSAR and psarSellSignal and psarShowLabels and psarConfirmationSell ? psar : na, title="PSAR Sell Label", text="Sell", location=location.absolute,
	 style=shape.labeldown, size=size.tiny, color=colorPSARShort, textcolor=color.white)
psarMidPricePlot = plot(ohlc4, title="", display=display.none, editable=false)
fill(psarMidPricePlot, psarPlot, title="PSAR Trade State Filling", color=colorPSARFill)


ploteMAMA = plot(showeMAMA ? eMAMA : na, title="Ehler's MAMA", linewidth=thicknessEMAMA, style=plot.style_line, color=coloreMAMA)
ploteFAMA = plot(showeMAMA ? eFAMA : na, title="Ehler's FAMA", linewidth=thicknessEMAMA, style=plot.style_line, color=coloreFAMA)
plotshape(showeMAMA and longMAMA ? eFAMA: na, style=shape.triangleup, location=location.absolute, size=size.tiny, title="eMAMA Cross Up",
	 color=color.new(coloreMAMA,10))
plotshape(showeMAMA and shortMAMA ? eFAMA: na, style=shape.triangledown, location=location.absolute, size=size.tiny, title="eMAMA Cross Down",
	 color=color.new(coloreFAMA,10))
fill(ploteMAMA, ploteFAMA, color=showEMAMAfill ? fillEMAMA : transparent, title="eMAMA fill")


// ---------------------------------------------------<[ Strategy Execution ]>-------------------------------------------------

strategy.entry(id="long", long=strategy.long, comment="enL", when=psarBuySignal and psarConfirmationBuy and tradeLong)
if useSL
	strategy.exit(id="long", stop=psar, comment="SL")
strategy.close(id="long", comment="exL", when=psarSellSignal and psarConfirmationSell and tradeLong)

strategy.entry(id="short", long=strategy.short, comment="enS", when=psarSellSignal and psarConfirmationSell and tradeShort)
if useSL
	strategy.exit(id="short", stop=psar, comment="SL")
strategy.close(id="short", comment="exS", when=psarBuySignal and psarConfirmationBuy and tradeShort)


// -------------------------------------------------------<[ Tables ]>---------------------------------------------------------

//   Shows red for bearish signals, green for bullish signals.
var table summaryTable = table.new(tablePosition, 3, 3)

if (barstate.islast and showTable)
    table.cell(summaryTable, 0, 0, "PSAR",text_size=tableTextSize, bgcolor = psarDir == 1 ? color.green : color.red)

    rsiDirection = fDirection(valueRSI,1)
    table.cell(summaryTable, 0, 1, "RSI " + tostring(round(valueRSI,0)) + rsiDirection,text_size=tableTextSize,
    	 bgcolor = iff(valueRSI > rsiOverbought, color.red, iff(valueRSI < rsiOversold, color.green, color.yellow)))

    srsiDirection = fDirection(srsiK,1)
    table.cell(summaryTable, 0, 2, "K " + tostring(round(srsiK,0)) + srsiDirection, text_size=tableTextSize,
    	 bgcolor=iff(srsiK > srsiOverbought, color.red, iff(srsiK < srsiOversold, color.green, srsiK > srsiD ? color.green : color.red)))

    emaDirection = fDirection(emaFast,1)
    table.cell(summaryTable, 1, 0, "EMA" + emaDirection,text_size=tableTextSize,
    	 bgcolor = emaFast > emaSlow and emaFast > emaFast[1] ? color.green : color.red)
    // See if emaFast has increased over the last two periods.
    if rising(emaFast,2) and emaFast < emaSlow
        table.cell_set_bgcolor(summaryTable, 1, 0, color.yellow)

    directionTEMA = fDirection(temaFast,1)
    table.cell(summaryTable, 1, 1, "TEMA" + directionTEMA,text_size=tableTextSize,
    	 bgcolor = temaFast > temaSlow and temaFast > temaFast[1] ? color.green : color.red)
    // See if temaFast has increased over the last two periods.
    if rising(temaFast,2) and temaFast < temaSlow
        table.cell_set_bgcolor(summaryTable, 1, 1, color.yellow)

    directionMAMA = fDirection(eMAMA,1)
    table.cell(summaryTable, 1, 2, "eMAMA" + directionMAMA,text_size=tableTextSize,
    	 bgcolor = eMAMA > eFAMA and eMAMA > eFAMA[1] ? color.green : color.red)
    // See if temaFast has increased over the last two periods.
    if rising(eMAMA,2) and eMAMA < eFAMA
        table.cell_set_bgcolor(summaryTable, 1, 2, color.yellow)

    directionMACD = fDirection(macd,2)
    table.cell(summaryTable, 2, 0, "MACD " + directionMACD, text_size=tableTextSize, bgcolor= macd > signalMACD ? color.green : color.red)

    directionOBV = fDirection(shortOBV,2)
    table.cell(summaryTable, 2, 1, "OBV " + directionOBV, text_size=tableTextSize, bgcolor= shortOBV > 0 ? color.green : color.red)

    directionCMF = fDirection(mfCMF,2)
    table.cell(summaryTable, 2, 2, "CMF " + directionCMF + tostring(mfCMF, "#.##"), text_size=tableTextSize, bgcolor= mfCMF > 0 ? color.green : color.red)


// ---------------------------------------------------<[ Alerts ]>-------------------------------------------------
if psarBuySignal and psarConfirmationBuy
	alert("PSAR buy/long signal confirmed for {{ticker}} on {{interval}}.", alert.freq_once_per_bar)

if psarSellSignal and psarConfirmationSell
	alert("PSAR sell/short signal confirmed for {{ticker}} on {{interval}}.", alert.freq_once_per_bar)

if psarChangeCond
	alert("PSAR has changed direction for {{ticker}} on {{interval}}.", alert.freq_once_per_bar)