Strategi perdagangan kuantitatif berdasarkan Ichimoku Kinko Hyo dan Indeks Arah Purata
Gambaran keseluruhan
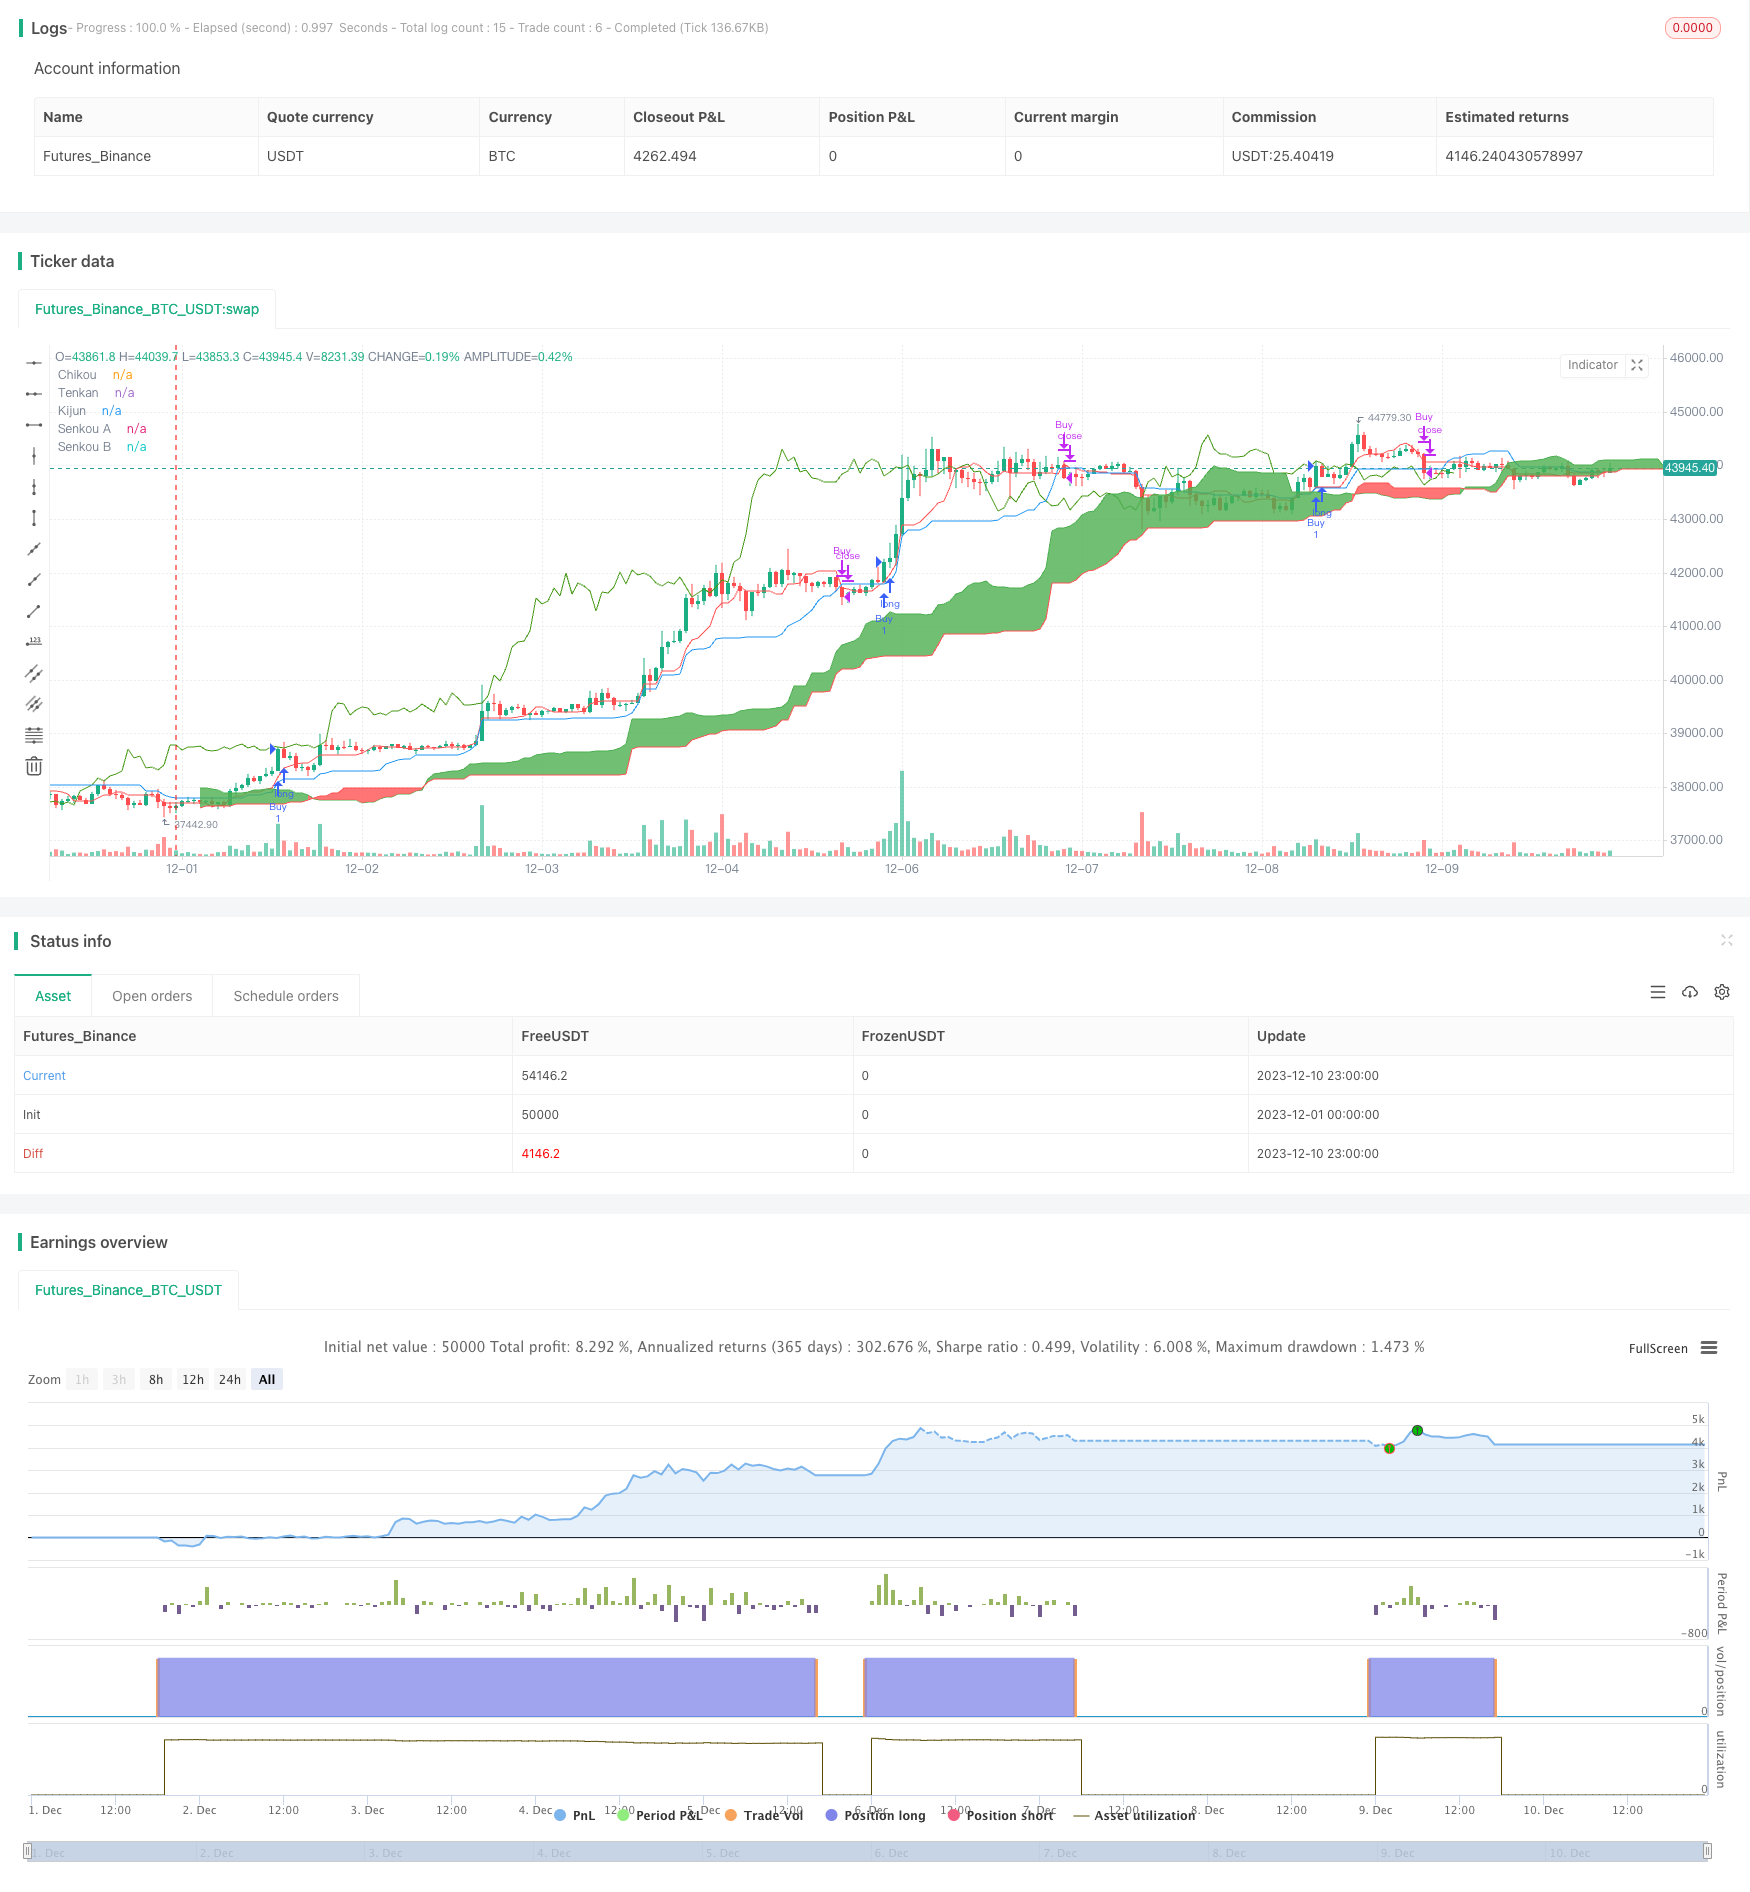
Strategi ini menggunakan kedua-dua petunjuk teknikal, iaitu Tabel Keseimbangan Pertama dan Indeks Arahan Rata-rata ((ADX), untuk mengenal pasti trend harga saham dan tahap rintangan sokongan utama, untuk menghantar isyarat membeli dan menjual. Strategi ini bertujuan untuk menangkap turun naik harga yang lebih besar dalam keadaan trend.
Prinsip Strategi
Tabel keseimbangan pertama terdiri daripada tiga purata bergerak garis peralihan sebelumnya, garis rujukan dan garis kelewatan. Apabila harga di atas melintasi garis peralihan sebelumnya dan garis rujukan, ia memberi isyarat beli; apabila harga di bawah melintasi kedua-dua garis, ia memberi isyarat jual. Selain itu, tabel keseimbangan pertama juga mengenal pasti kawasan rintangan sokongan utama melalui grafik awan.
ADX digunakan untuk menentukan trend harga. Apabila +DI dan -DI jelas dipisahkan, ia menunjukkan trend; Apabila +DI dan -DI hampir, ia menunjukkan pergerakan penumpuan. Strategi ini mengeluarkan isyarat perdagangan hanya apabila ADX lebih besar daripada 20 untuk mengelakkan menangkap pecah palsu dalam tempoh penumpuan.
Dengan menggunakan penilaian trend dari carta keseimbangan pertama dan penapisan ADX terhadap kekuatan trend, anda dapat mengenal pasti segmen pasaran trend yang mempunyai turun naik harga yang tinggi.
Kelebihan Strategik
- Menggunakan gabungan kedua-dua penunjuk menjadikan isyarat perdagangan lebih dipercayai
- Penggunaan ADX mengelakkan kesilapan perdagangan dalam menyusun keadaan
- Pelaksanaan yang baik dan risiko yang tinggi
Analisis risiko
- Strategi ini lebih sesuai untuk saham trend, dan mungkin tidak banyak isyarat untuk saham yang disusun semula
- Pada mulanya, neraca itu sendiri mempunyai masalah dengan ketinggalan tindak balas, dan mungkin kehilangan peluang untuk berbalik dengan cepat.
- ADX tidak sempurna dalam penilaian dan masih boleh melakukan kesalahan
Arah pengoptimuman
- Kombinasi parameter yang berbeza boleh diuji, seperti penyesuaian kitaran garis penukaran, garis asas
- boleh digabungkan dengan penunjuk lain seperti MACD, KD dan lain-lain
- Peraturan penapisan ADX yang berbeza boleh dikaji
ringkaskan
Strategi ini berjaya menangkap trend dengan berkesan melalui gabungan grafik keseimbangan dan ADX. Dengan pengoptimuman parameter dan peraturan lanjut, strategi ini dapat memperoleh prestasi yang lebih baik dan prestasi yang lebih baik. Strategi ini sesuai untuk pelabur strategi yang berdagang saham trend.
/*backtest
start: 2023-12-01 00:00:00
end: 2023-12-10 23:59:59
period: 1h
basePeriod: 15m
exchanges: [{"eid":"Futures_Binance","currency":"BTC_USDT"}]
*/

//@version=4
strategy(title="Ichimoku + ADX", shorttitle="Ichimoku & ADX Backtest", overlay=true)

//------------------------------
//------------------------------
// ICHIMOKU
//------------------------------
//------------------------------

conversionPeriods = input(9, minval=1, title="Conversion Line Periods"),
basePeriods = input(26, minval=1, title="Base Line Periods")
laggingSpan2Periods = input(52, minval=1, title="Lagging Span 2 Periods"),
displacement = input(26, minval=1, title="Displacement")

donchian(len) => avg(lowest(len), highest(len))

Tenkan = donchian(conversionPeriods)
Kijun = donchian(basePeriods)
SSA = avg(Tenkan, Kijun)
SSB = donchian(laggingSpan2Periods)

SSAdisp = SSA[displacement]
SSBdisp = SSB[displacement]

// Plot Ichimoku
// --------------------

plot(Tenkan, color=color.red, title="Tenkan")
plot(Kijun, color=color.blue, title="Kijun")
plot(close, offset = -displacement + 1, color=#459915, title="Chikou")


p1 = plot(SSA, offset = displacement - 1, color=color.green,
 title="Senkou A")
p2 = plot(SSB, offset = displacement - 1, color=color.red,
 title="Senkou B")
fill(p1, p2, color = SSA > SSB ? color.green : color.red)

//------------------------------
//------------------------------
// ADX
//------------------------------
//------------------------------

adxlen = input(14, title="ADX Smoothing")
dilen = input(14, title="DI Length")
keyLevel = input(23, title="key level for ADX")
dirmov(len) =>
	up = change(high)
	down = -change(low)
	truerange = rma(tr, len)
	plus = fixnan(100 * rma(up > down and up > 0 ? up : 0, len) / truerange)
	minus = fixnan(100 * rma(down > up and down > 0 ? down : 0, len) / truerange)
	[plus, minus]

adx(dilen, adxlen) =>
	[plus, minus] = dirmov(dilen)
	sum = plus + minus
	adx = 100 * rma(abs(plus - minus) / (sum == 0 ? 1 : sum), adxlen)
	[adx, plus, minus]

[sig, up, down] = adx(dilen, adxlen)

// Plot ADX
// --------------------

//plot(sig, color=color.black, title="ADX")
//plot(up, color=color.green, title="+DI",linewidth=2, style=plot.style_columns, transp=40)
//plot(down, color=color.red, title="-DI",linewidth=2, style=plot.style_columns, transp=40)
//plot(keyLevel, color=color.white, title="Key Level")


//------------------------------
//------------------------------
// STRATEGY
//------------------------------
//------------------------------

// Buy & Sell Signals
// --------------------

// ADX
ABuy1 = up > keyLevel and up - down >5 and sig > down and sig < keyLevel * 2
ASell1 = down > keyLevel and down - up >5 and sig > up and sig < keyLevel * 2


// ICHIMOKU

Bull = close >= max(SSAdisp, SSBdisp)
Bear = close <= min(SSAdisp, SSBdisp)

//  1. Bull
Buy1 = (close >= max(SSAdisp, SSBdisp)) ? 1 : 0
Buy2 = (Tenkan - Kijun >= 0.001) ? 1 : 0
Buy3 = SSA > SSB ? 1 : 0
Buy4 = sig > 20 ? 1 : 0
Buy4a = close - close[displacement] >=0.001 ? 1:0
Buy5 = Buy1 and Buy2 and Buy3 and Buy4 and Buy4a and not(Buy1[1] and Buy2[1] and Buy3[1])

//  1. Bear
Sell1 = (close <= min(SSAdisp, SSBdisp)) ? 1 : 0
Sell2 = (Kijun - Tenkan >= 0.001) ? 1 : 0
Sell3 = SSA < SSB ? 1 : 0
Sell4 = sig > 20 ? 1 : 0
Sell4a = close <= close[displacement]
Sell5 = Sell1 and Sell2 and Sell3 and Sell4 and Sell4a and not(Sell1[1] and Sell2[1] and Sell3[1])


// CONSOLIDATED

buysignal = Buy5
buyexitsignal = crossunder(close,Kijun)

sellsignal = Sell5
sellexitsignal = crossover(close,Kijun)

longCondition = buysignal
shortCondition = sellsignal

// Plot Indicators
// --------------------

// ----- Buy & Sell

//plotshape(longCondition, title = "Buy Signal", text ="BUY", textcolor =#FFFFFF , style=shape.labelup, size = size.tiny, location=location.belowbar, color = #1B8112, transp = 0)
//plotshape(shortCondition, title = "Short Signal", text ="SHORT", textcolor =#FFFFFF , style=shape.labeldown, size = size.tiny, location=location.abovebar, color = #000000, transp = 0)

// ----- Ichimoku Signals

//plotshape(Sell2, title = "Sell Signal", text ="Kumo Twist", textcolor =#FFFFFF , style=shape.labelup, size = size.tiny, location=location.top, color = color.black, transp = 0)
//plotshape(Sell3, title = "Sell Signal", text ="TK/KJ", textcolor =#FFFFFF , style=shape.labelup, size = size.tiny, location=location.bottom, color = color.black, transp = 0)

//plotshape(Buy4, title = "Buy Signal", text ="Kumo Twist", textcolor =#FFFFFF , style=shape.diamond, size = size.tiny, location=location.belowbar, color = color.blue, transp = 0)
//plotshape(Buy3, title = "Buy Signal", text ="TK/KJ", textcolor =#FFFFFF , style=shape.circle, size = size.tiny, location=location.abovebar, color = color.green, transp = 0)
//plotshape(Buy4, title = "Buy Signal", text ="TK/KJ", textcolor =#FFFFFF , style=shape.circle, size = size.tiny, location=location.belowbar, color = color.red, transp = 0)


//plotshape(buyexitsignal, title = "Buy Exit", style=shape.triangledown, size = size.tiny, location=location.abovebar, color = color.green, transp = 0)
//plotshape(sellexitsignal, title = "Buy Exit", style=shape.triangleup, size = size.tiny, location=location.belowbar, color = color.black, transp = 0)

//------------------------------
//------------------------------
// EXECUTION
//------------------------------
//------------------------------


// Test Range
// --------------------

// === INPUT BACKTEST RANGE ===
FromMonth = input(defval = 2, title = "From Month", minval = 1, maxval = 12)
FromDay   = input(defval = 1, title = "From Day", minval = 1, maxval = 31)
FromYear  = input(defval = 2015, title = "From Year", minval = 2017)
ToMonth   = input(defval = 1, title = "To Month", minval = 1, maxval = 12)
ToDay     = input(defval = 1, title = "To Day", minval = 1, maxval = 31)
ToYear    = input(defval = 9999, title = "To Year", minval = 2017)

// === FUNCTION EXAMPLE ===
start     = timestamp(FromYear, FromMonth, FromDay, 00, 00)  // backtest start window
finish    = timestamp(ToYear, ToMonth, ToDay, 23, 59)        // backtest finish window
window()  => true // create function "within window of time"

// Orders
// --------------------


if longCondition
    strategy.entry("Buy", strategy.long, when=window())

if buyexitsignal
    strategy.close("Buy")

if shortCondition
    strategy.entry("Sell", strategy.short, when=window())

if sellexitsignal
    strategy.close("Sell")