
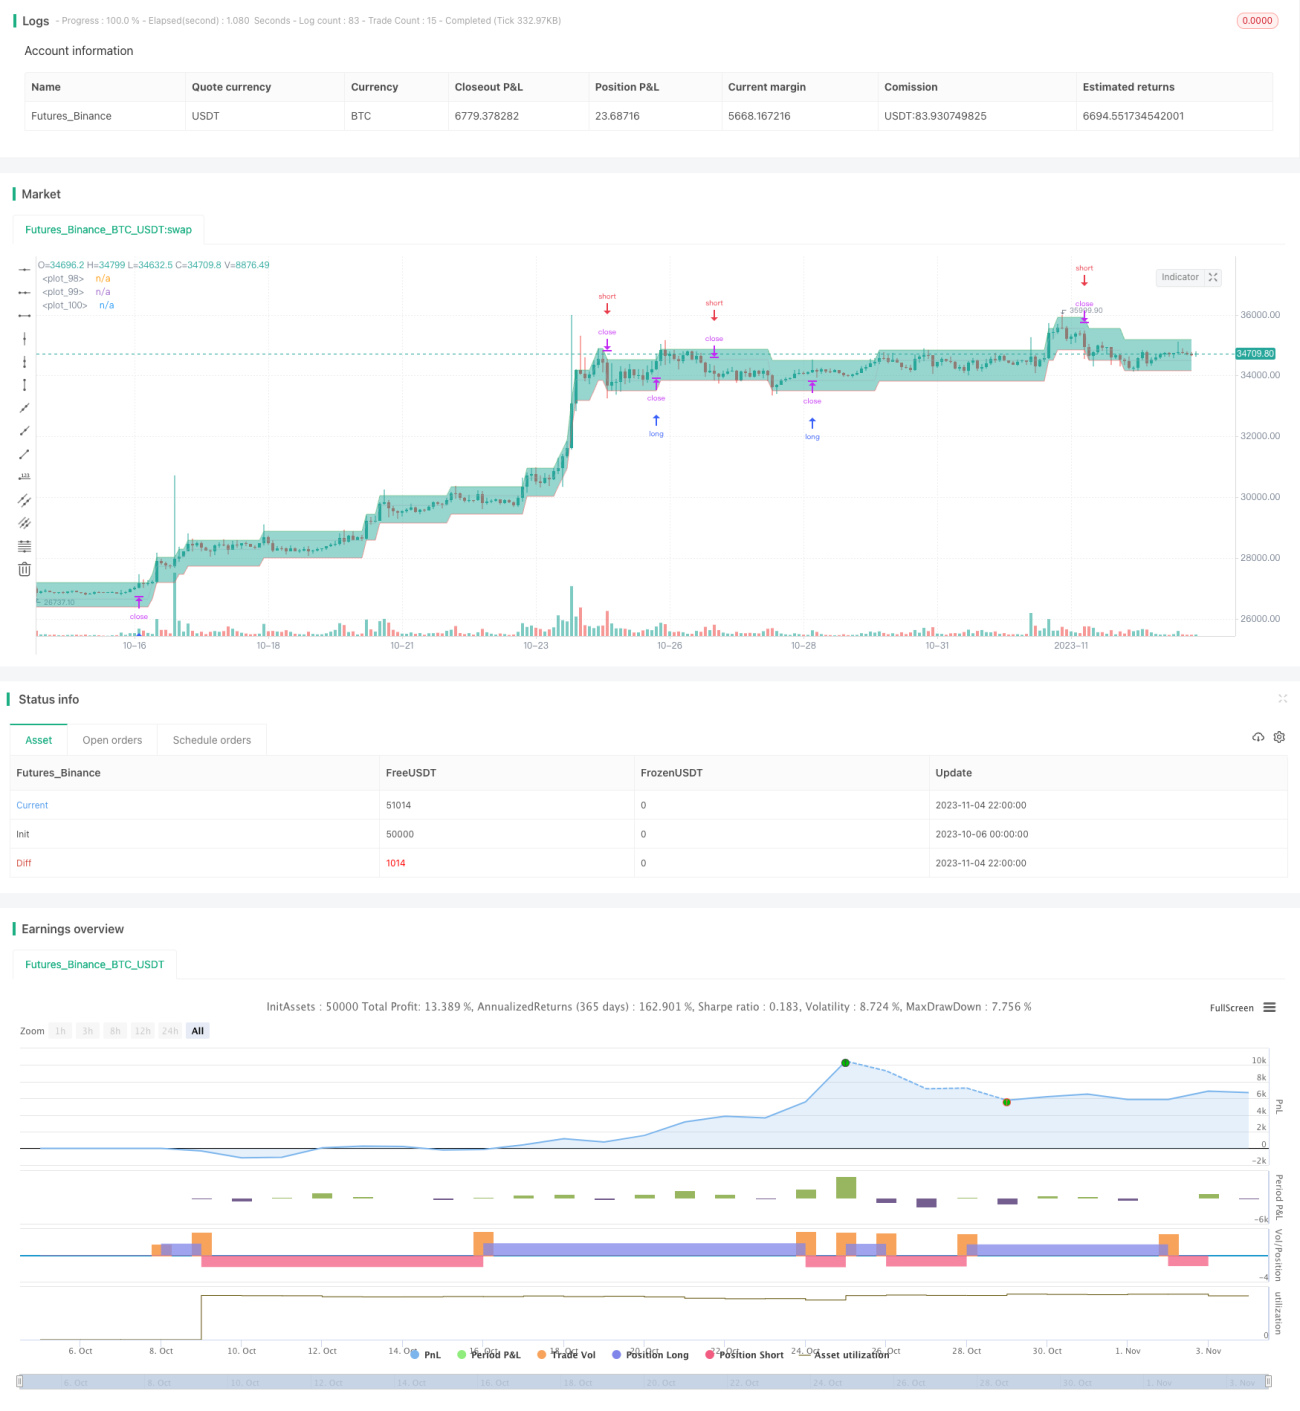
A estratégia de bloco de tendência é uma estratégia de negociação que se baseia em percentual de mudança de preço ou pontos de salto. Ela pode mostrar claramente as tendências locais e os pontos de reversão no gráfico.
A estratégia é calculada com base no percentual de variação do preço ou o desvio de ponto de pulso (expresso em parâmetros de desvio de coluna de coluna) e é apresentada no gráfico na forma de linhas diagonais.
Cada linha é composta por uma linha média, uma linha de limite superior e uma linha de limite inferior:
A linha média de referência é igual ao limite superior ou inferior da linha anterior ou da linha seguinte (se os preços mudarem rapidamente durante um intervalo de tempo, a linha média de referência da linha atual será maior que o limite superior da linha anterior ou menor que o limite inferior da linha seguinte por um número equivalente de desvios, dependendo da direção da mudança de preço). No início do cálculo, a linha média de referência é igual ao valor inicial da primeira linha.
O parâmetro de quantidade de coluna determina a quantidade de desvio de acordo com o limite superior ou inferior da direção da mudança de preço, e o parâmetro de coluna de deflexão determina a quantidade de desvio que altera a direção da mudança de preço.
Regras para construir uma nova linha:
Se o preço de fechamento for ≥ o limite superior e o preço de fechamento for > o preço de abertura, o limite superior irá subir gradualmente e o limite inferior também irá subir, mas com menor amplitude.
Se o preço mínimo é ≤ o limite inferior e o preço de fechamento é < o preço de abertura, o limite inferior será gradualmente movido para baixo, e o limite superior também será movido para baixo, mas com menor amplitude.
Ao ajustar o desvio, é possível ver claramente as tendências locais e os pontos de inflexão no gráfico. Esta é uma ferramenta muito útil para acompanhar a movimentação dos preços.
A visualização mostra a tendência de mudança de preço e identifica claramente a resistência de suporte.
A diagonal mostra claramente a intensidade da ruptura e a extensão da reversão.
Tendências de diferentes intensidades podem ser identificadas de acordo com a necessidade de ajustar a inclinação da linha angular.
A partir daí, a tendência é de encontrar um maior suporte e resistência, e fazer uma ruptura.
A taxa de variação de preços é facilmente observada e pode ser usada para ajustar posições.
A diagonal não pode prever com exatidão a evolução dos preços subsequentes.
A tendência é de que os preços reais não se ajustem às linhas angulares, o que significa que os preços reais não se ajustam à linha angular.
Não pode ser usada como uma estratégia isolada e precisa ser combinada com outros indicadores para avaliar as grandes tendências.
É importante ter em conta que a má regulação dos parâmetros pode levar a transações excessivamente frequentes.
A possibilidade de ser necessária uma reversão de alerta durante o retorno, não pode ser rastreada a cego mecânico.
Pode ser apropriadamente reduzido o tamanho da posição, com referência a outros indicadores como julgamento auxiliar, para operar em grandes tendências.
Pode ser adicionado um módulo de gerenciamento de posições para ajustar dinamicamente as posições em diferentes fases da tendência.
Pode ser combinado com um indicador de volatilidade para reduzir a posição quando a volatilidade aumenta.
Pode-se definir um ponto de parada de acordo com a proporção de retirada para controlar a perda individual.
Pode ser adicionado um filtro para suspender a negociação em caso de desvio.
Pode-se dividir a inclinação diagonal em vários níveis, identificando mudanças de tendência de diferentes intensidades.
A tendência dos preços pode ser acompanhada de forma mais estável através de ajustes dinâmicos de posições, definição de condições de stop loss e filtragem.
A estratégia de bloco de tendência usa a linha de diagonal para visualizar a mudança de tendência de preços, identificando claramente os pontos de resistência e ruptura de suporte. Mas não pode depender de um julgamento independente da linha de diagonal, e precisa ser auxiliada por outros indicadores para uma análise abrangente, além de controlar o risco. Esta é uma ferramenta auxiliar muito valiosa que pode ajudar os comerciantes a entender melhor o ritmo do mercado.
/*backtest
start: 2023-10-06 00:00:00
end: 2023-11-05 00:00:00
period: 2h
basePeriod: 15m
exchanges: [{"eid":"Futures_Binance","currency":"BTC_USDT"}]
*/
//@version=5
// **********************************************************************************
// This code is invented and written by @StCogitans.
// The idea presented in this code and the rights to this code belong to @StCogitans.
// © https://www.tradingview.com/u/StCogitans
//
// Description.
// Sizeblock - a price change strategy in the form of diagonal rows.
// **********************************************************************************
// STRATEGY
string NAME = 'Sizeblock'
string ACRONYM = 'SB'
bool OVERLAY = true
int PYRAMIDING = 0
string QTY_TYPE = strategy.percent_of_equity
float QTY_VALUE = 100
float CAPITAL = 100
string COM_TYPE = strategy.commission.percent
float COM_VALUE = 0.1
bool ON_CLOSE = false
bool BAR_MAGNIFIER = false
bool OHLC = true
strategy(NAME, ACRONYM, OVERLAY, pyramiding=PYRAMIDING, default_qty_type=QTY_TYPE, default_qty_value=QTY_VALUE, initial_capital=CAPITAL, commission_type=COM_TYPE, commission_value=COM_VALUE, process_orders_on_close=ON_CLOSE, use_bar_magnifier=BAR_MAGNIFIER, fill_orders_on_standard_ohlc=OHLC)
// ARGUMENTS
// Datetime
DTstart = input(timestamp("01 Jan 2000 00:00 +0000"), 'Start time', group='Datetime')
DTfinish = input(timestamp("01 Jan 2080 23:59 +0000"), 'Finish time', group='Datetime')
DTperiod = true
// Main
dev_source = input.string('Close', title='Source', options=["Close", "HighLow"], tooltip='Price data for settlement.', group='Main')
dev_type = input.string('Percentage', title='Deviation', options=['Percentage', 'Ticks'], tooltip='The type of deviation to calculate.', group='Main')
dev_value = input.float(1, title='Quantity', minval=0.001, step=0.01, tooltip='Quantity to be calculated.', group='Main')
dev_back = input.float(2, title='U-turn', minval=0.001, step=0.01, tooltip='Quantity for reversal.', group='Main')
mode = input.string('Limit', title='Positions', options=['Limit', 'Market'], tooltip='Limit or market orders.', group='Main')
direct = input.string('All', title='Direction', options=['All', 'Buy', 'Sell'], tooltip='The type of positions to be opened.', group='Main')
swapping = input.bool(false, title='Swapping', tooltip='Swap points to open a new position.', group='Main')
// CALCULATION SYSTEM
Assembling(s, t, v, vb) =>
float a = open
float b = close
float c = s == "HighLow" ? math.round_to_mintick(high) : math.round_to_mintick(b)
float d = s == "HighLow" ? math.round_to_mintick(low) : math.round_to_mintick(b)
float x = math.round_to_mintick(a)
x := nz(x[1], x)
float _v = t == "Ticks" ? syminfo.mintick * v : v
float _vb = t == "Ticks" ? syminfo.mintick * vb : vb
float h = t == "Ticks" ? math.round_to_mintick(x + _v) : math.round_to_mintick(x * (1 + _v / 100))
float l = t == "Ticks" ? math.round_to_mintick(x - _v) : math.round_to_mintick(x * (1 - _v / 100))
h := nz(h[1], h)
l := nz(l[1], l)
if t == "Ticks"
if c >= h and b > a
while c >= h
x := h
h := math.round_to_mintick(h + _v)
l := math.round_to_mintick(x - _vb)
if d <= l and b < a
while d <= l
x := l
l := math.round_to_mintick(l - _v)
h := math.round_to_mintick(x + _vb)
else if t == "Percentage"
if c >= h and b > a
while c >= h
x := h
h := math.round_to_mintick(h * (1 + _v / 100))
l := math.round_to_mintick(x * (1 - _vb / 100))
if d <= l and b < a
while d <= l
x := l
l := math.round_to_mintick(l * (1 - _v / 100))
h := math.round_to_mintick(x * (1 + _vb / 100))
[x, h, l]
[lx, lh, ll] = Assembling(dev_source, dev_type, dev_value, dev_back)
// PLOT
// Lines
plot_up = plot(lh, color=color.new(color.green, 50), style=plot.style_line, linewidth=1)
plot_main = plot(lx, color=color.new(color.silver, 50), style=plot.style_line, linewidth=1)
plot_down = plot(ll, color=color.new(color.red, 50), style=plot.style_line, linewidth=1)
// Areas
fill(plot_up, plot_main, lh, lx, color.new(color.teal, 80), color.new(color.teal, 80))
fill(plot_main, plot_down, lx, ll, color.new(color.maroon, 80), color.new(color.maroon, 80))
// TRADING
// Alert variables
int Action = -1
int PosType = -1
int OrderType = -1
float Price = -1.0
// Direction variables
bool ifBuy = direct == "All" or direct == "Buy" ? true : false
bool ifSell = direct == "All" or direct == "Sell" ? true : false
// Market entries
if (strategy.closedtrades + strategy.opentrades == 0 or mode == "Market") and DTperiod
if ((swapping and lx < nz(lx[1], lx)) or (not swapping and lx > nz(lx[1], lx))) and ifBuy
Action := 1
PosType := 1
OrderType := 1
Price := math.round_to_mintick(close)
strategy.entry('Long', strategy.long)
if ((swapping and lx > nz(lx[1], lx)) or (not swapping and lx < nz(lx[1], lx))) and ifSell
Action := 2
PosType := 2
OrderType := 1
Price := math.round_to_mintick(close)
strategy.entry('Short', strategy.short)
// Closing positions by market
if DTperiod and mode == "Market"
if direct == "Buy" and strategy.position_size > 0
if swapping and lx > nz(lx[1], lx)
Action := 2
PosType := 3
OrderType := 1
Price := math.round_to_mintick(close)
strategy.close('Long', comment='Close')
if not swapping and lx < nz(lx[1], lx)
Action := 2
PosType := 3
OrderType := 1
Price := math.round_to_mintick(close)
strategy.close('Long', comment='Close')
if direct == "Sell" and strategy.position_size < 0
if swapping and lx < nz(lx[1], lx)
Action := 1
PosType := 3
OrderType := 1
Price := math.round_to_mintick(close)
strategy.close('Short', comment='Close')
if not swapping and lx > nz(lx[1], lx)
Action := 1
PosType := 3
OrderType := 1
Price := math.round_to_mintick(close)
strategy.close('Short', comment='Close')
// Limit entries and exits
if swapping and DTperiod and mode == "Limit"
if strategy.position_size < 0
Action := 1
PosType := 1
OrderType := 2
Price := ll
if ifBuy
strategy.entry('Long', strategy.long, limit=ll)
else
PosType := 3
strategy.exit('Exit', limit=ll)
if strategy.position_size > 0
Action := 2
PosType := 2
OrderType := 2
Price := lh
if ifSell
strategy.entry('Short', strategy.short, limit=lh)
else
PosType := 3
strategy.exit('Exit', limit=lh)
if strategy.closedtrades + strategy.opentrades > 0 and strategy.position_size == 0
if ifBuy
Action := 1
PosType := 1
OrderType := 2
Price := ll
strategy.entry('Long', strategy.long, limit=ll)
if ifSell
Action := 2
PosType := 2
OrderType := 2
Price := lh
strategy.entry('Short', strategy.short, limit=lh)
if not swapping and DTperiod and mode == "Limit"
if strategy.position_size < 0
Action := 1
PosType := 1
OrderType := 2
Price := lh
if ifBuy
strategy.entry('Long', strategy.long, stop=lh)
else
PosType := 3
strategy.exit('Exit', stop=lh)
if strategy.position_size > 0
Action := 2
PosType := 2
OrderType := 2
Price := ll
if ifSell
strategy.entry('Short', strategy.short, stop=ll)
else
PosType := 3
strategy.exit('Exit', stop=ll)
if strategy.closedtrades + strategy.opentrades > 0 and strategy.position_size == 0
if ifBuy
Action := 1
PosType := 1
OrderType := 2
Price := lh
strategy.entry('Long', strategy.long, stop=lh)
if ifSell
Action := 2
PosType := 2
OrderType := 2
Price := ll
strategy.entry('Short', strategy.short, stop=ll)
// Everything is closed and canceled
if not DTperiod
strategy.cancel_all()
strategy.close_all(comment='Close')
// Alerts
// Convert to string variables
string Action_Txt = Action == 1 ? "Buy" : Action == 2 ? "Sell" : na
string PosType_Txt = PosType == 1 ? "Long" : PosType == 2 ? "Short" : PosType == 3 ? "Flat" : na
string OrderType_Txt = OrderType == 1 ? "Market" : OrderType == 2 ? "Limit" : na
string Price_Txt = Price > 0 ? str.tostring(Price) : na
// Output
if not (Action == nz(Action[1], Action) and Price == nz(Price[1], Price) and OrderType == nz(OrderType[1], OrderType)) and DTperiod
alert('{"pair": "' + syminfo.ticker + '", "direction": "' + Action_Txt + '", "entertype": "' + OrderType_Txt + '", "position": "' + PosType_Txt + '", "price": "' + Price_Txt + '"}')
// *********************
// Good job, Soldier! ;>
// *********************