Estratégia de acompanhamento de tendência de momentum

1
Follow
1779
Followers
Visão geral
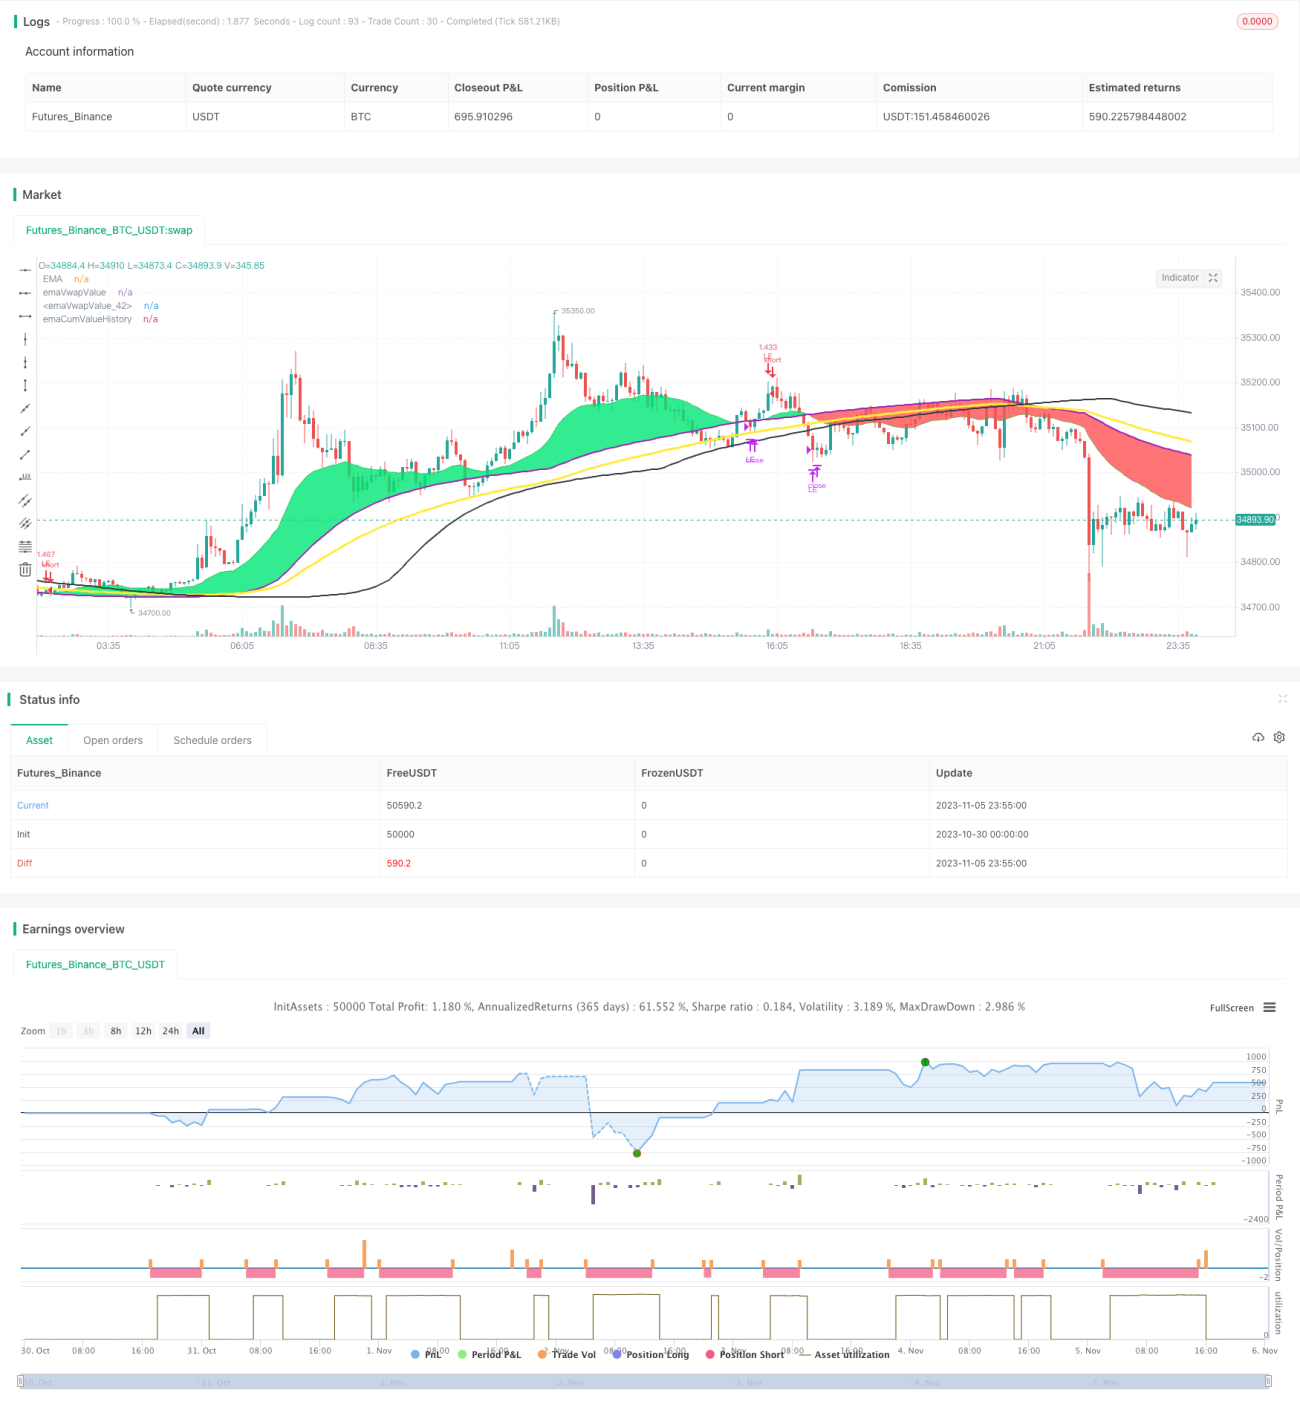
A estratégia baseia-se na análise de tendências de médias móveis e volume de transações, define indicadores de volume de movimento e executa operações de compra e venda seguindo tendências.
Princípio da estratégia
- Calcular a média EMA do preço de fechamento e a média EMA cumulativa do volume de transação
- Quando o close é colocado sobre a EMA, ele é considerado uma tendência ascendente e é usado como uma operação multi-cabeça.
- Quando continuar a subir, feche a linha média do dobro da EMA acumulada e adicione mais posições
- Configurar o indicador RSI para que o RSI seja igual a um terço do valor quando for superior a 90
- Quando o close atravessa a EMA, é considerado uma tendência de queda, e todas as posições a mais são eliminadas.
- Quando o close atravessa a EMA, é considerado uma tendência de queda e a operação é executada em branco.
- Estabelecer uma linha de stop loss, uma linha de stop loss como uma porcentagem fixa do preço de entrada
- A forma de ganhar dinheiro com um cavalo é a mesma que com muitos cavalo.
Análise de vantagens
As principais vantagens desta estratégia são:
- Usando a linha média da EMA para determinar a tendência, pode-se seguir a tendência de forma eficaz
- EMA acumulado de volume de transação para avaliar mudanças de tendência reais
- O indicador de dinâmica RSI está a ganhar dinheiro
- Controle de risco, linha de parada
- Parâmetros de ajuste flexíveis e adaptáveis a diferentes situações
Análise de Riscos
Os principais riscos desta estratégia são:
- EMA média gera atraso e pode perder o ponto de viragem
- O volume de transações não necessariamente reflete as tendências reais
- A perda de percentual fixa pode ser muito mecanizada
- PARAMETERS: Muitos e difíceis de definir
- Transações frequentes e custos elevados
A solução para o risco:
- Optimizar os parâmetros EMA e reduzir o atraso
- Combinação com outros indicadores para confirmar o sinal de volume de transação
- Optimizar o ponto de parada de acordo com a situação do mercado
- Parâmetros simplificados, mantendo apenas a configuração principal
- Limitação e frequência de negociação adequadas
Direção de otimização
A estratégia pode ser melhorada em vários aspectos:
- Teste diferentes configurações de parâmetros do EMA para encontrar a combinação ideal de parâmetros
- Aumentar o múltiplo de VOLUME para determinar a força do sinal de entrada
- Confirmação de admissão em combinação com MACD, KD e outros indicadores
- Percentagem de stop loss otimizada de acordo com as características de uma ação específica
- Optimizar a frequência de transação e reduzir as taxas de transação
Resumir
A estratégia global é uma estratégia de acompanhamento de tendências baseada em um sistema de linha uniforme. A ideia central é usar o EMA para determinar a direção da tendência e, em conjunto com o indicador de dinâmica VOLUME, confirmar a entrada. Pode ser continuamente otimizado por otimização de parâmetros e auxiliar a confirmação adicional de outros indicadores.
Source
Pine
Strategy parameters
Related strategies
Comment
All comments (0)
No data
- 1