Estratégia de negociação quantitativa Double RSI

Visão geral
Esta estratégia utiliza o indicador de RSI duplo para a negociação de curto e longo prazo, em combinação com o sistema de equilíbrio para determinar a direção da tendência, pertence à estratégia de quantificação do RSI duplo. A estratégia utiliza primeiro o indicador de RSI para determinar o sinal de carência, em combinação com a direção da tendência para determinar a direção da tendência, e é uma estratégia típica de acompanhamento de tendência.
Análise de princípios
A estratégia de quantificação do RSI duplo usa principalmente o indicador RSI de dois períodos de tempo para julgar sinais de negociação. A estratégia primeiro define dois parâmetros RSI, um período mais longo como julgamento principal de negociação e um período mais curto como filtro auxiliar. Quando o RSI de longo período passa a linha de venda, um sinal de cotação é gerado, e quando o RSI de curto período passa a linha de compra, um sinal de cotação é gerado, formando uma oportunidade de negociação de curto cruzamento.
Para filtrar os sinais falsos, a estratégia também introduz o SMA e a média EMA para o julgamento de tendências. O RSI é considerado um sinal múltiplo somente quando a linha curta de SMA atravessa a linha de EMA longa e o RSI é considerado um sinal de fechamento somente quando a linha curta de SMA atravessa a linha de EMA longa, garantindo que o sinal duplo de RSI esteja de acordo com a direção da tendência e evitando a negociação contra a tendência.
Além disso, a estratégia também configura a lógica de stop loss. A posição é aberta com duas quantidades diferentes de pedidos de stop loss em simultâneo, e a posição de stop loss é definida.
Análise de vantagens
A estratégia de quantificação do RSI duplo tem as seguintes vantagens:
-
O indicador de RSI de período de tempo duplo pode determinar com mais precisão os sinais de hipocrisia. A combinação cruzada de RSI de período longo e curto pode filtrar alguns sinais falsos e melhorar a qualidade do sinal.
-
O sistema de linha média ajuda a determinar a direção da grande tendência, evita a negociação contra a tendência, pode filtrar a maior parte da negociação de ruído e aumentar a taxa de vitória.
-
Mecanismos flexíveis de stop-loss, que permitem obter maiores ganhos através de diferentes configurações de stop-loss, mas também podem ser bloqueados para controlar o risco.
-
A lógica de negociação estratégica é simples e clara, fácil de entender e de otimizar, adequada para o aprendizado de comerciantes de quantificação.
Análise de Riscos
Apesar das vantagens de uma estratégia de quantificação de dois RSI, há também os seguintes riscos:
-
O indicador RSI por si só não tem efeito sobre oscilações e reversões de tendência, e a estratégia pode não ser eficaz para o comércio nesses mercados.
-
Embora o sistema de linha média possa filtrar o ruído de pequena escala, ele não é muito eficaz no julgamento de mudanças de tendência no ciclo intermediário e pode perder o ponto de viragem da tendência.
-
A configuração inadequada do stop loss pode levar ao stop loss muito amplo ou ao stop loss muito pequeno, reduzindo a eficácia da estratégia.
-
O excesso de oferta e venda de ações em larga escala pode levar à expansão dos prejuízos, e é necessário controlar o tamanho das posições.
Para os riscos acima, pode-se reduzir o risco, ajustando os parâmetros do RSI, introduzindo tendências mais avançadas e indicadores de reversão, otimizando a lógica de stop loss e controlando a posição.
Direção de otimização
A estratégia de quantificação do RSI duplo pode ser ainda mais otimizada em várias direções:
-
Tente diferentes combinações de parâmetros, otimize os parâmetros do RSI de ciclo e encontre a melhor combinação de indicadores de RSI de longo e curto período.
-
Testar diferentes indicadores de mediana, introduzir indicadores como o MACD para avaliar tendências e oportunidades de reversão.
-
Otimize a estratégia de stop loss, configure o stop loss de rastreamento ou o stop loss móvel, para que o stop loss de stop loss seja mais flexível.
-
Adição de módulos de controle de posições, controle de mais posições de tomada de posição em diferentes fases da tendência do grande ciclo.
-
A adição de modelos de aprendizagem de máquina aumenta a precisão das entradas e saídas.
-
Otimizar o feedback para encontrar as melhores variedades de negócios e períodos de tempo.
Resumir
A estratégia de quantificação do RSI duplo é uma estratégia típica de acompanhamento de tendências. A estratégia que combina os indicadores do RSI duplo para julgar os sinais de negociação e filtrar o ruído do sistema linear é muito clássica e prática. Embora a estratégia também tenha algum espaço para melhorias, a lógica de funcionamento geral é clara, fácil de entender e otimizar.
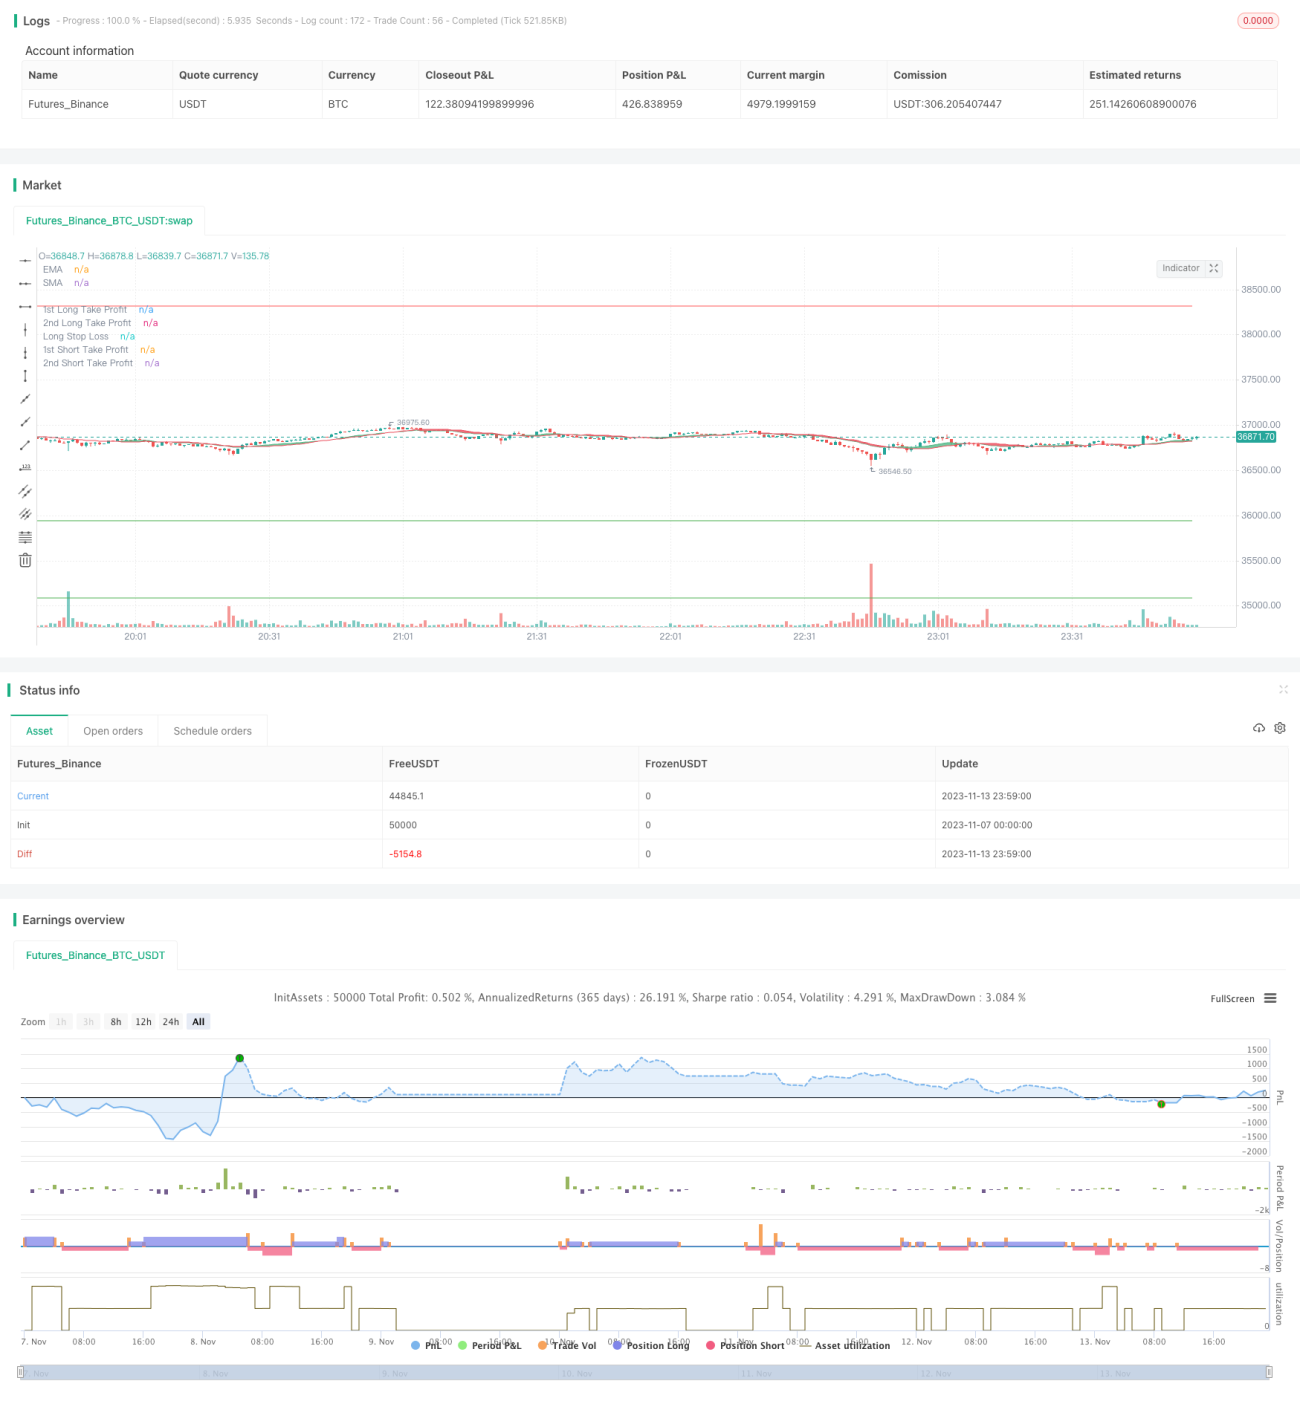
/*backtest
start: 2023-11-07 00:00:00
end: 2023-11-14 00:00:00
period: 1m
basePeriod: 1m
exchanges: [{"eid":"Futures_Binance","currency":"BTC_USDT"}]
*/

//@version=4
strategy("Growth Producer", overlay=true, initial_capital = 1000, currency = "USD", pyramiding = 2, commission_type=strategy.commission.percent, commission_value=0.07, default_qty_type = strategy.percent_of_equity, default_qty_value = 100)

//Functions- 1