Pontos-chave da estratégia de negociação intradiária

1
Follow
1779
Followers
Visão geral
Esta é uma estratégia de pontos-chave para negociação de dias na Índia, que utiliza o preço de abertura, o preço mais alto, o preço mais baixo e o preço de fechamento para calcular pontos-chave de suporte e resistência e negociar em caso de ruptura de preços nesses pontos.
Princípio da estratégia
- Calcular os preços máximos, mínimos e de encerramento do dia anterior
- Calcule o ponto principal de suporte S1, o ponto de resistência R1 e o ponto crítico PP de acordo com a fórmula
- Quando o preço ultrapassa esses pontos críticos, você pode entrar em uma posição de compra ou venda.
- Configurar o mecanismo de saída de stop loss
Os principais pontos críticos são calculados da seguinte forma:
PP = (最高价+最低价+收盘价)/3
R1 = 2*PP - 最低价
S1 = 2*PP - 最高价
Análise de vantagens
- Aproveite os pontos-chave para oferecer brechas de alta probabilidade e aumentar as oportunidades de lucro
- Os pontos-chave são fáceis de identificar e as regras de negociação são claras.
- Ponto de paragem fácil de definir, controle de risco eficaz
Análise de Riscos
- Pontos críticos podem causar falhas e perdas
- Os pontos-chave precisam de ser verificados para serem válidos, e nem sempre são.
- A configuração inadequada do ponto de parada pode aumentar os prejuízos
A solução para o risco:
- combining with other indicators to filter false breakouts
- backtesting to validate strategy over long timeframes
- optimize stop loss placement
Direção de otimização
- Combinação com outros indicadores técnicos para filtrar falsos sinais de ruptura
- Parâmetros optimizados para diferentes variedades
- Ponto de parada de ajuste dinâmico
Resumir
A estratégia em geral é simples e direta, sendo fácil de verificar a eficácia com dados históricos. Como estratégia de negociação intradiária, ela usa pontos-chave para fornecer brechas de alta probabilidade e pode obter bons resultados. Mas, como depende dos pontos-chave, há também um certo risco de falsa ruptura, que precisa ser otimizado ainda mais para reduzir.
Source
Pine
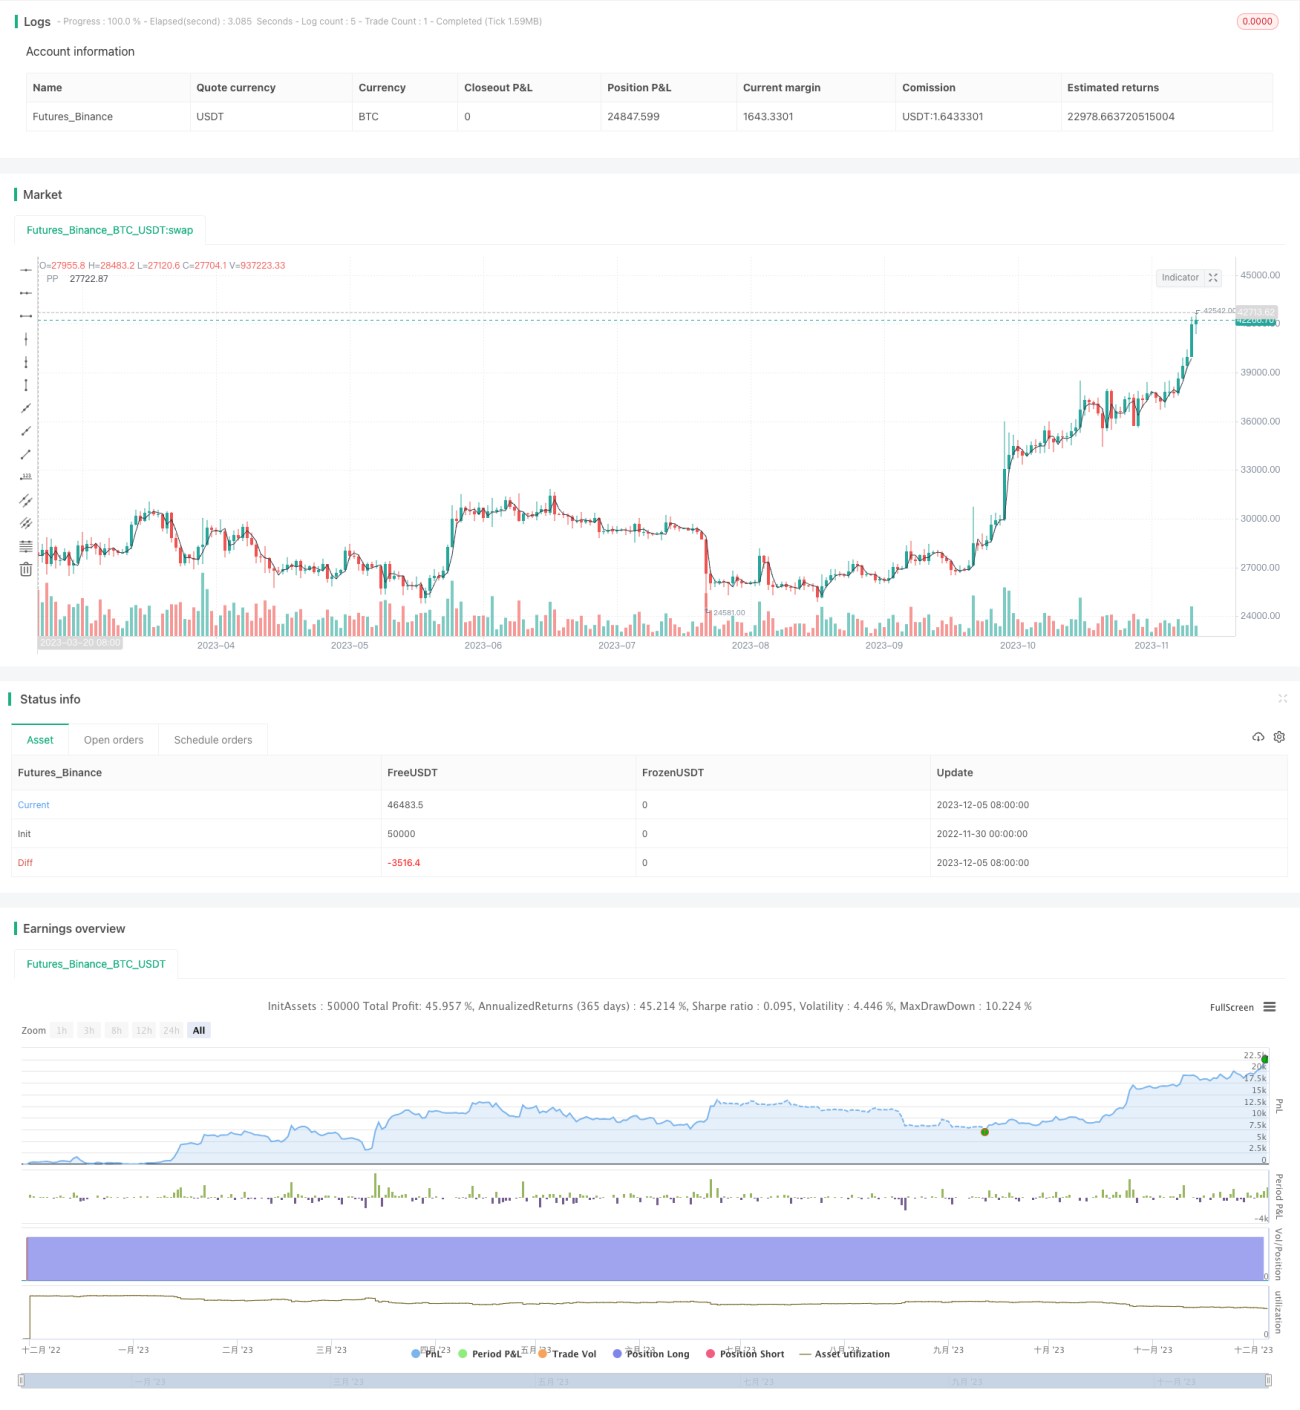
/*backtest
start: 2022-11-30 00:00:00
end: 2023-12-06 00:00:00
period: 1d
basePeriod: 1h
exchanges: [{"eid":"Futures_Binance","currency":"BTC_USDT"}]
*/

// This source code is subject to the terms of the Mozilla Public License 2.0 at https://mozilla.org/MPL/2.0/
// © arameshraju
//Reference credit goes to All
Strategy parameters
Related strategies
Comment
All comments (0)
No data
- 1