Estratégia de bomba de engolfamento de supertendência


Data de criação: 2023-12-08 15:40:26 última modificação: 2023-12-08 15:40:26
cópia: 0 Cliques: 708
1
focar em
1621
Seguidores

Estratégia de bomba de engolfamento de supertendência

Visão geral

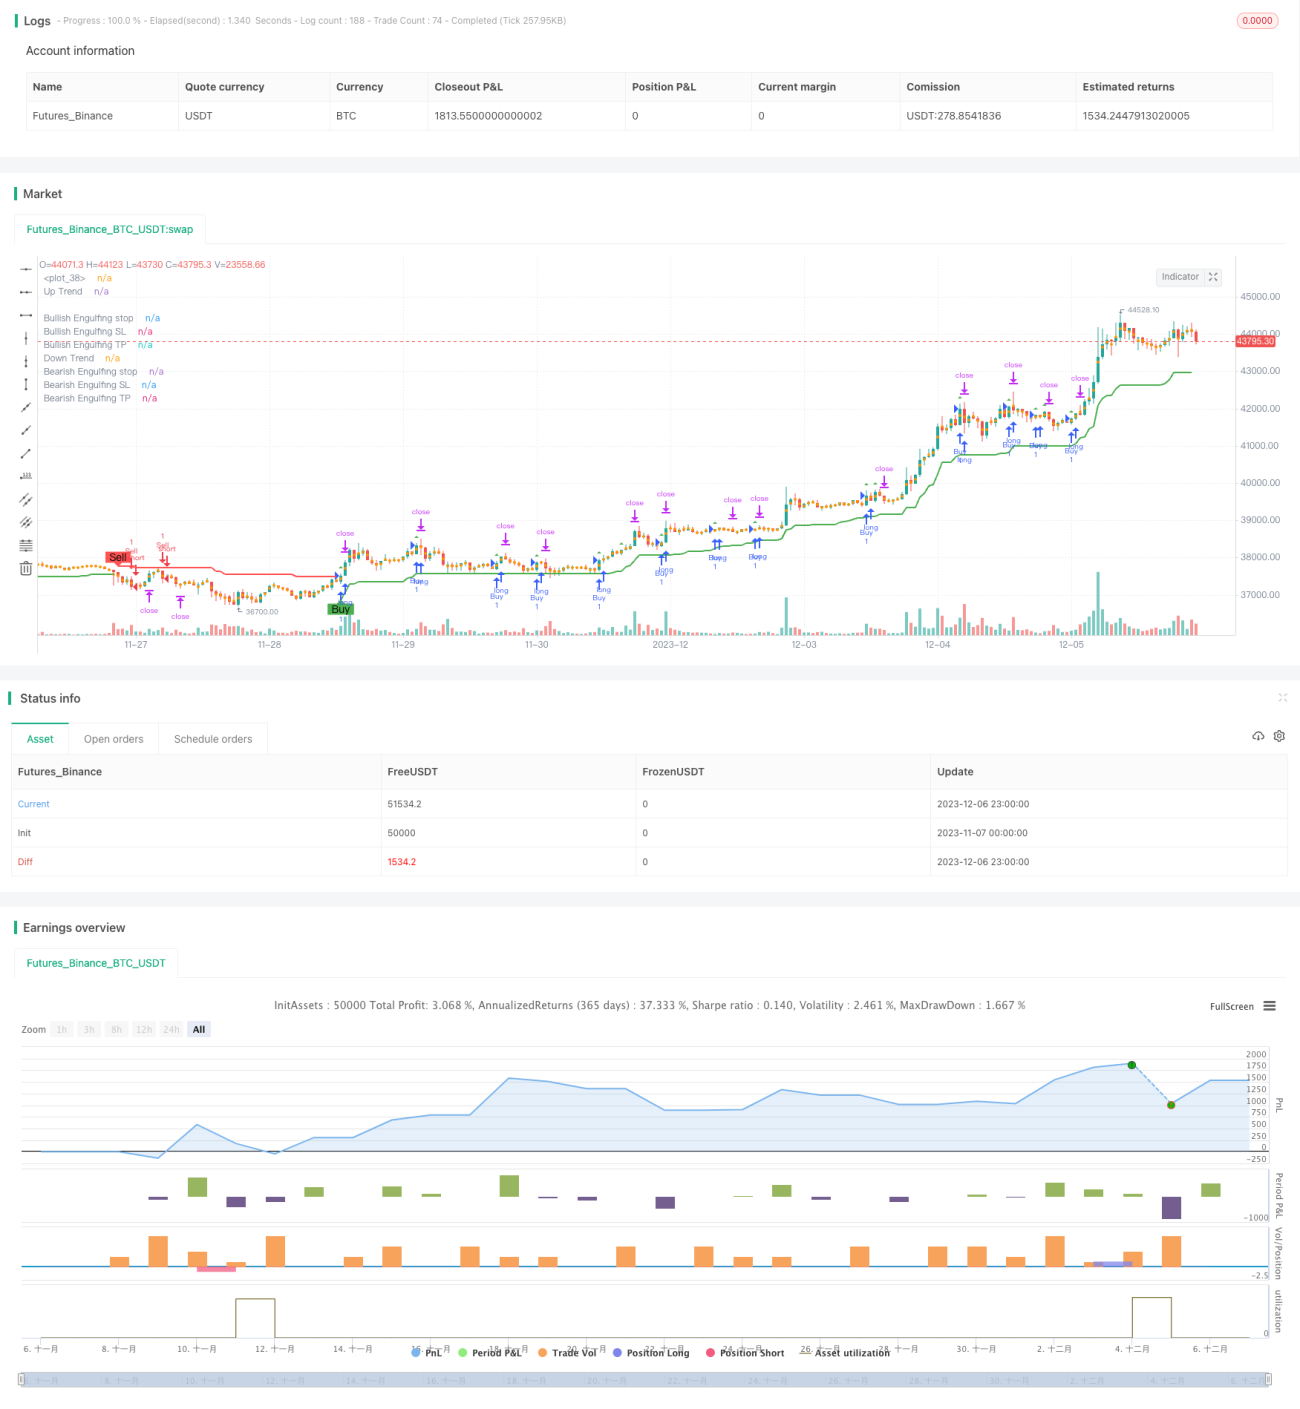
A estratégia de absorção de tendência ultra é uma estratégia de acompanhamento de tendências que combina a amplitude média real (ATR), o indicador de tendência ultra e a forma de absorção para identificar a direção da tendência e, ao mesmo tempo, procurar oportunidades de entrada com taxas favoráveis para a confirmação da forma de absorção da tendência.

Princípio da estratégia

A estratégia usa primeiro o ATR e o indicador de tendência ultra para determinar a direção da tendência do mercado atual. Concretamente, é definido como uma tendência descendente quando o preço está abaixo do traçado superior e como uma tendência ascendente quando o preço está acima do traçado inferior.

Ao mesmo tempo em que confirma a direção da tendência, a estratégia também julga se a linha K forma uma forma de absorção. De acordo com a lógica do código, em uma tendência ascendente, a situação em que o preço de fechamento da linha K anterior é maior que o preço de abertura da linha K atual e o preço de fechamento da linha K atual é menor que o preço de abertura desencadeia uma absorção múltipla; em uma tendência descendente, a situação em que o preço de fechamento da linha K anterior é menor que o preço de abertura da linha K atual e a conclusão da linha K atual é maior que o preço de abertura desencadeia uma absorção de cabeça vazia.

Quando a forma de absorção coincide com a direção da tendência, um sinal de negociação é gerado. Além disso, a estratégia também calcula o preço de parada e o preço de parada com base na forma de absorção. Após a entrada, se o preço tocar o preço de parada ou de parada, sairá da posição atual.

Análise de vantagens

A estratégia combina os benefícios do rastreamento de tendências e da identificação de formas, permitindo identificar sinais de reversão em situações de tendência, capturando assim uma tendência maior em pontos de mudança de mercado. Além disso, o mecanismo de parada de perdas também pode controlar eficazmente o risco de perda.

Análise de Riscos

O maior risco desta estratégia é que a forma de engolir pode ser falsa, gerando um sinal errado. Além disso, as configurações de stop loss e stop loss podem ser muito arbitrárias, impedindo o equilíbrio de ganhos e perdas. Recomenda-se otimizar a combinação de parâmetros e ajustar adequadamente a posição do stop loss.

Direção de otimização

Pode-se considerar otimizar os parâmetros do ATR em tempo real para capturar melhor as mudanças na volatilidade do mercado. Além disso, pode-se estudar outros indicadores para identificar tendências e melhorar ainda mais a estabilidade da estratégia. O rastreamento dinâmico também é uma idéia de otimização viável, considerando o stop loss.

Resumir

A estratégia de absorção de tendências ultrapassadas integra os benefícios do rastreamento de tendências e da identificação de padrões, e a estratégia de absorção de padrões como sinal de reversão pode ser mais eficaz em pontos de mudança de mercado. No entanto, a estratégia também apresenta um certo risco de falso sinal, que precisa de mais testes e otimização para controlar o risco.

Código-fonte da estratégia
/*backtest
start: 2023-11-07 00:00:00
end: 2023-12-07 00:00:00
period: 1h
basePeriod: 15m
exchanges: [{"eid":"Futures_Binance","currency":"BTC_USDT"}]
*/

// This source code is subject to the terms of the Mozilla Public License 2.0 at https://mozilla.org/MPL/2.0/
// © Armanhammer

//@version=5
strategy("Engulfing with Trend", overlay=true)

Periods = input.int(title="ATR Period", defval=10)
src = input(hl2, title="Source")
Multiplier = input.float(title="ATR Multiplier", step=0.1, defval=3.0)
changeATR= input.bool(title="Change ATR Calculation Method ?", defval=true)
showsignals = input.bool(title="Show Buy/Sell Signals ?", defval=true)
highlighting = input.bool(title="Highlighter On/Off ?", defval=true)

atr2 = ta.sma(src, Periods)
atr= changeATR ? ta.atr(Periods) : atr2

up=src-(Multiplier*atr)
up1 = nz(up[1],up)
up := close[1] > up1 ? math.max(up,up1) : up
dn=src+(Multiplier*atr)
dn1 = nz(dn[1], dn)
dn := close[1] < dn1 ? math.min(dn, dn1) : dn

var trend = 1
trend := nz(trend[1], trend)
trend := trend == -1 and close > dn1 ? 1 : trend == 1 and close < up1 ? -1 : trend

upPlot = plot(trend == 1 ? up : na, title="Up Trend", style=plot.style_linebr, linewidth=2, color=color.green)
buySignal = trend == 1 and trend[1] == -1
plotshape(buySignal and showsignals ? up : na, title="Buy", style=shape.labelup, location=location.absolute, color=color.new(color.green, 0), text="Buy")
//plotshape(buySignal ? up : na, title="UpTrend Begins", location=location.absolute, style=shape.circle, size=size.tiny, color=color.green, transp=0)
//plotshape(buySignal and showsignals ? up : na, title="Buy", text="Buy", location=location.absolute, style=shape.labelup, size=size.tiny, color=color.green, textcolor=color.white, transp=0)
dnPlot = plot(trend == 1 ? na : dn, title="Down Trend", style=plot.style_linebr, linewidth=2, color=color.red)
sellSignal = trend == -1 and trend[1] == 1
plotshape(sellSignal and showsignals ? dn : na, title="Sell", style=shape.labeldown, location=location.absolute, color=color.new(color.red, 0), text="Sell")
//plotshape(sellSignal ? dn : na, title="DownTrend Begins", location=location.absolute, style=shape.circle, size=size.tiny, color=color.red, transp=0)
//plotshape(sellSignal and showsignals ? dn : na, title="Sell", text="Sell", location=location.absolute, style=shape.labeldown, size=size.tiny, color=color.red, textcolor=color.white, transp=0)
mPlot = plot(ohlc4, title="", style=plot.style_circles, linewidth=0)
longFillColor = highlighting and trend == 1 ? color.new(color.green, 0) : na
shortFillColor = highlighting and trend == -1 ? color.new(color.red, 0) : na
fill(upPlot, dnPlot, color=longFillColor)
fill(dnPlot, upPlot, color=shortFillColor)
alertcondition(buySignal, title="SuperTrend Buy", message="SuperTrend Buy!")
alertcondition(sellSignal, title="SuperTrend Sell", message="SuperTrend Sell!")
changeCond = trend != trend[1]
alertcondition(changeCond, title="SuperTrend Direction Change", message="SuperTrend has changed direction!")

// Define Downtrend and Uptrend conditions
downtrend = trend == -1
uptrend = trend == 1


// Engulfing
boringThreshold = input.float(25, title="Boring Candle Threshold (%)", minval=1, maxval=100)
engulfingThreshold = input.float(50, title="Engulfing Candle Threshold (%)", minval=1, maxval=100)
stopLevel = input.int(200, title="Stop Level (Pips)", minval=1)

// Boring Candle (Inside Bar) and Engulfing Candlestick Conditions
isBoringCandle = math.abs(open[1] - close[1]) * 100 / math.abs(high[1] - low[1]) <= boringThreshold
isEngulfingCandle = math.abs(open - close) * 100 / math.abs(high - low) <= engulfingThreshold

// Bullish and Bearish Engulfing Conditions
bullEngulfing = uptrend and close[1] < open[1] and close > open[1] and not isBoringCandle and not isEngulfingCandle
bearEngulfing = downtrend and close[1] > open[1] and close < open[1] and not isBoringCandle and not isEngulfingCandle

// Stop Loss, Take Profit, and Entry Price Calculation
bullStop = close + (stopLevel * syminfo.mintick)
bearStop = close - (stopLevel * syminfo.mintick)
bullSL = low 
bearSL = high
bullTP = bullStop + (bullStop - low)
bearTP = bearStop - (high - bearStop)

// Entry Conditions
enterLong = bullEngulfing and uptrend
enterShort = bearEngulfing and downtrend

// Exit Conditions
exitLong = ta.crossover(close, bullTP) or ta.crossover(close, bullSL)
exitShort = ta.crossover(close, bearTP) or ta.crossover(close, bearSL)

// Check if exit conditions are met by the next candle
exitLongNextCandle = exitLong and (ta.crossover(close[1], bullTP[1]) or ta.crossover(close[1], bullSL[1]))
exitShortNextCandle = exitShort and (ta.crossover(close[1], bearTP[1]) or ta.crossover(close[1], bearSL[1]))

// Strategy Execution
if enterLong
    strategy.entry("Buy", strategy.long)

if enterShort
    strategy.entry("Sell", strategy.short)

// Exit Conditions for Long (Buy) Positions
if bullEngulfing and not na(bullTP) and not na(bullSL)
    strategy.exit("Exit Long", from_entry="Buy", stop=bullSL, limit=bullTP)

// Exit Conditions for Short (Sell) Positions
if bearEngulfing and not na(bearTP) and not na(bearSL)
    strategy.exit("Exit Short", from_entry="Sell", stop=bearSL, limit=bearTP)


// Plot Shapes and Labels
plotshape(series=bullEngulfing, style=shape.triangleup, location=location.abovebar, color=color.green)
plotshape(series=bearEngulfing, style=shape.triangledown, location=location.abovebar, color=color.red)

// Determine OP, SL, and TP
plot(series=bullEngulfing ? bullStop : na, title="Bullish Engulfing stop", color=color.red, linewidth=3, style=plot.style_linebr)
plot(series=bearEngulfing ? bearStop : na, title="Bearish Engulfing stop", color=color.red, linewidth=3, style=plot.style_linebr)
plot(series=bullEngulfing ? bullSL : na, title="Bullish Engulfing SL", color=color.red, linewidth=3, style=plot.style_linebr)
plot(series=bearEngulfing ? bearSL : na, title="Bearish Engulfing SL", color=color.red, linewidth=3, style=plot.style_linebr)
plot(series=bullEngulfing ? bullTP : na, title="Bullish Engulfing TP", color=color.green, linewidth=3, style=plot.style_linebr)
plot(series=bearEngulfing ? bearTP : na, title="Bearish Engulfing TP", color=color.green, linewidth=3, style=plot.style_linebr)

// Create labels if the condition for bullEngulfing or bearEngulfing is met
//if bullEngulfing
   // label.new(x=bar_index, y=bullSL, text="SL: " + str.tostring(bullSL), color=color.red, textcolor=color.white, style=label.style_labelup, size=size.tiny)

//if bearEngulfing
   // label.new(x=bar_index, y=bearSL, text="SL: " + str.tostring(bearSL), color=color.red, textcolor=color.white, style=label.style_labeldown, size=size.tiny)

//if bullEngulfing
  //  label.new(x=bar_index, y=bullTP, text="TP: " + str.tostring(bullTP), color=color.green, textcolor=color.white, style=label.style_labeldown, size=size.tiny)

//if bearEngulfing
  //  label.new(x=bar_index, y=bearTP, text="TP: " + str.tostring(bearTP), color=color.green, textcolor=color.white, style=label.style_labelup, size=size.tiny)