Estratégia de negociação de reversão de Momentum TD


Data de criação: 2023-12-18 17:40:10 última modificação: 2023-12-18 17:40:10
cópia: 0 Cliques: 845
1
focar em
1621
Seguidores

Estratégia de negociação de reversão de Momentum TD

Visão geral

A estratégia de negociação de reversão de TD de momentum é uma estratégia de negociação quantitativa que usa o indicador TD Sequential para identificar sinais de reversão de preço. A estratégia é baseada na análise da dinâmica de preços e estabelece posições de compra ou venda após a confirmação do sinal de reversão de preço.

Princípio da estratégia

A estratégia usa o indicador TD Sequential para analisar os movimentos de preços e identificar a forma de inversão de preços em 9 linhas K consecutivas. Especificamente, quando uma linha K decrescente é identificada após uma alta de 9 linhas K consecutivas, a estratégia julga uma oportunidade de baixa; ao contrário, quando uma linha K crescente é identificada após uma queda de 9 linhas K consecutivas, a estratégia julga uma oportunidade de alta.

Utilizando os benefícios do indicador TD Sequential, é possível capturar sinais de reversão de preços com antecedência. Combinado com um mecanismo de caça a queda de um certo número da estratégia, é possível estabelecer posições de ativos ou de ativos em tempo hábil após a confirmação do sinal de reversão, o que oferece melhores oportunidades de entrada na fase inicial da reversão de preços.

Análise de vantagens

  • Utilizando o TD Sequential Indicator, pode-se prever a possibilidade de uma reversão de preço
  • Estabelecer um mecanismo de rastreamento de queda para determinar a reversão de preços mais rapidamente
  • Construir uma posição de entrada melhor através da inversão da fase de formação

Análise de Riscos

  • TD Sequential pode ter falsas rupturas e precisa ser confirmada com outros fatores
  • A necessidade de controlar adequadamente o tamanho e a duração das posições para reduzir o risco

Direção de otimização

  • Identificar sinais de reversão, em combinação com outros indicadores, para evitar o risco de falsa brecha
  • Estabelecer mecanismos de suspensão para controlar perdas individuais
  • Optimizar o tamanho e a duração das posições, equilibrando o tamanho do lucro e o controle de risco

Resumir

A estratégia de negociação de reversão de TD de momentum é uma estratégia muito adequada para o comerciante de momentum. Esta estratégia tem a vantagem de identificar oportunidades de reversão, mas é preciso ter cuidado para controlar o risco e evitar grandes perdas por brechas falsas. Com otimização adicional, é uma estratégia de negociação de risco-recompensas mais equilibrada.
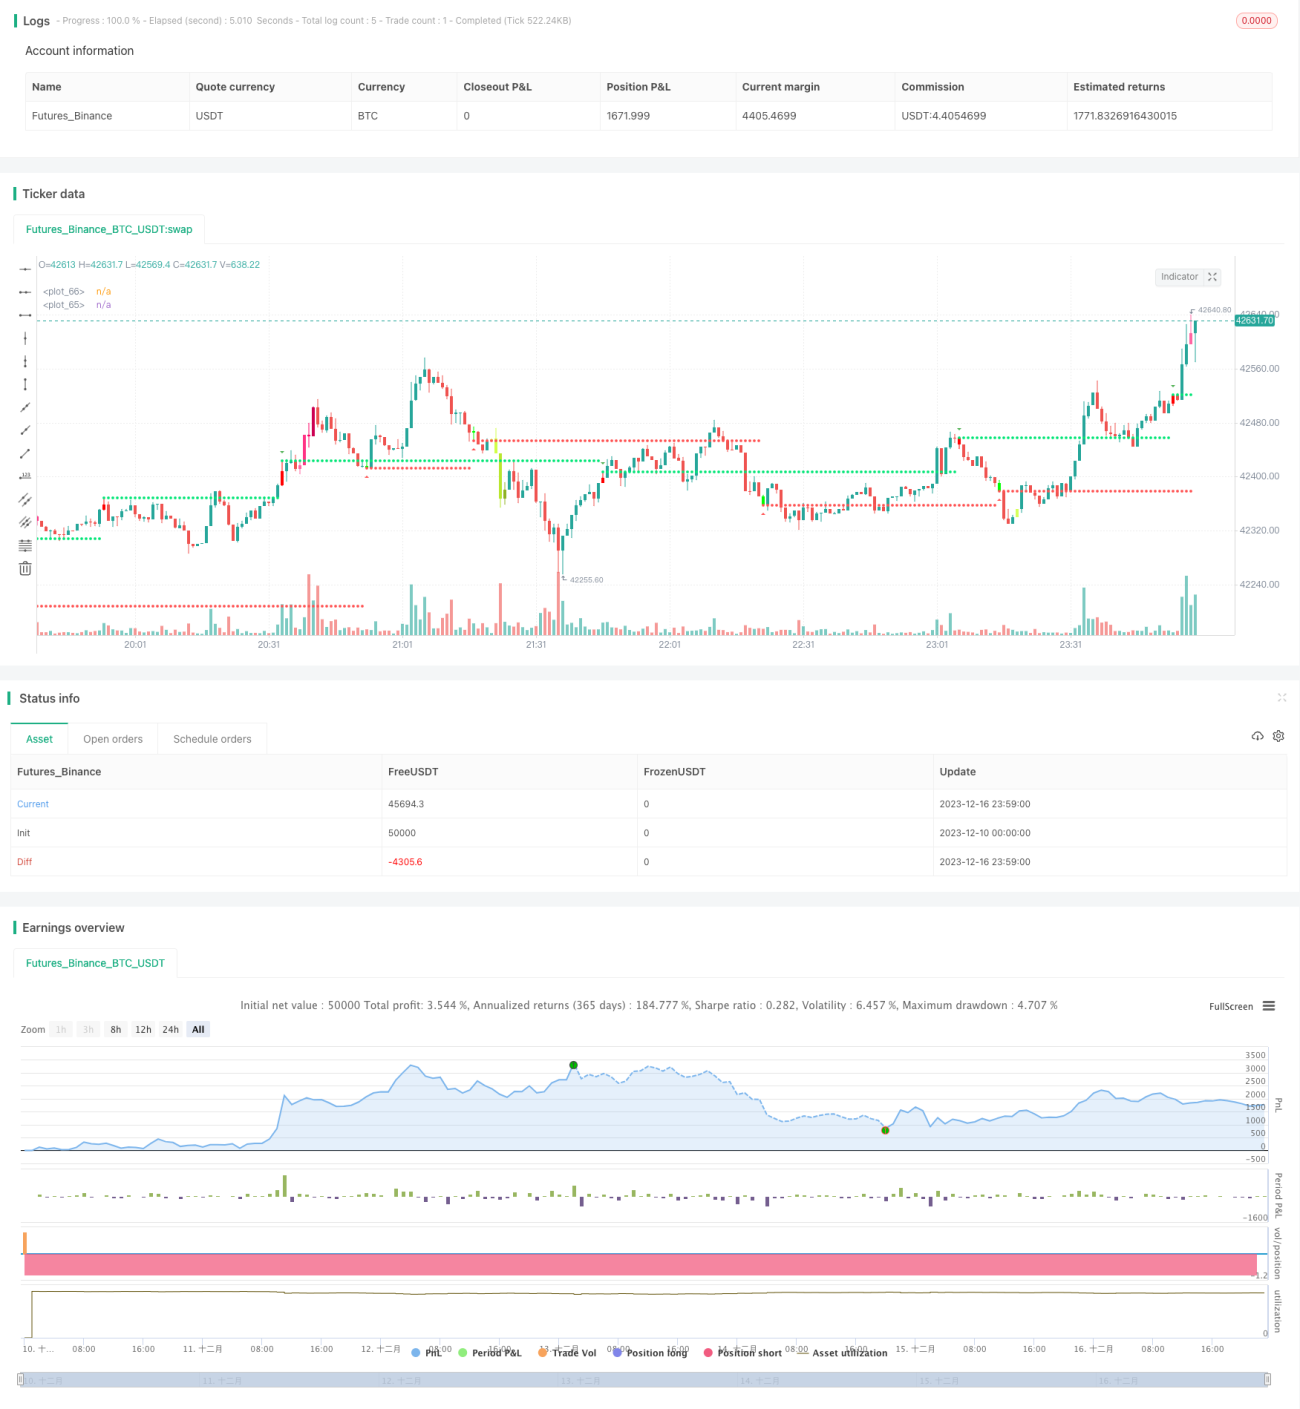
Código-fonte da estratégia
/*backtest
start: 2023-12-10 00:00:00
end: 2023-12-17 00:00:00
period: 1m
basePeriod: 1m
exchanges: [{"eid":"Futures_Binance","currency":"BTC_USDT"}]
*/

//@version=4
//This strategy is based on TD sequential study from glaz. 
//I made some improvement and modification to comply with pine script version 4.
//Basically, it is a strategy based on proce action, supports and resistance.

strategy("Sequential Up/Down", overlay=true )
source = input(close)
BarsCount = input(9, "Count of consecutive bars")
useLinearRegression = input(false)
LR_length = input(13,"Linear Regression length")
SR = input(true,"Shows Supports and Resistance lines")
Barcolor = input(true,"Color bars when there is a signal")
transp = input(0, "Transparency of triangle Up or Downs")
Numbers = input(true,"Plot triangle Up or Downs at signal")

//Calculation
src=useLinearRegression?linreg(source,LR_length,0):source
UP = 0
DW = 0
UP := src > src[4] ? nz(UP[1]) + 1 : 0
DW := src < src[4] ? nz(DW[1]) + 1 : 0

UPUp = UP - valuewhen(UP < UP[1], UP, 1)
DWDn = DW - valuewhen(DW < DW[1], DW, 1)

plotshape(Numbers ? UPUp == BarsCount ? true : na : na, style=shape.triangledown, text="", color=color.green, location=location.abovebar, transp=transp)
plotshape(Numbers ? DWDn == BarsCount ? true : na : na, style=shape.triangleup, text="", color=color.red, location=location.belowbar, transp=transp)


// S/R Code By johan.gradin
//------------//
// Sell Setup //
//------------//
priceflip = barssince(src < src[4])
sellsetup = src > src[4] and priceflip
sell = sellsetup and barssince(priceflip != BarsCount)
sellovershoot = sellsetup and barssince(priceflip != BarsCount+4)
sellovershoot1 = sellsetup and barssince(priceflip != BarsCount+5)
sellovershoot2 = sellsetup and barssince(priceflip != BarsCount+6)
sellovershoot3 = sellsetup and barssince(priceflip != BarsCount+7)

//----------//
// Buy setup//
//----------//
priceflip1 = barssince(src > src[4])
buysetup = src < src[4] and priceflip1
buy = buysetup and barssince(priceflip1 != BarsCount)
buyovershoot = barssince(priceflip1 != BarsCount+4) and buysetup
buyovershoot1 = barssince(priceflip1 != BarsCount+5) and buysetup
buyovershoot2 = barssince(priceflip1 != BarsCount+6) and buysetup
buyovershoot3 = barssince(priceflip1 != BarsCount+7) and buysetup

//----------//
// TD lines //
//----------//
TDbuyh = valuewhen(buy, high, 0)
TDbuyl = valuewhen(buy, low, 0)
TDsellh = valuewhen(sell, high, 0)
TDselll = valuewhen(sell, low, 0)

//----------//
//   Plots  //
//----------//

plot(SR ? TDbuyh ? TDbuyl : na : na, style=plot.style_circles, linewidth=1, color=color.red)
plot(SR ? TDselll ? TDsellh : na : na, style=plot.style_circles, linewidth=1, color=color.lime)
barcolor(Barcolor ? sell ? #FF0000 : buy ? #00FF00 : sellovershoot ? #FF66A3 : sellovershoot1 ? #FF3385 : sellovershoot2 ? #FF0066 : sellovershoot3 ? #CC0052 : buyovershoot ? #D6FF5C : buyovershoot1 ? #D1FF47 : buyovershoot2 ? #B8E62E : buyovershoot3 ? #8FB224 : na : na)

//  Strategy: (Thanks to JayRogers)
// === STRATEGY RELATED INPUTS ===
//tradeInvert     = input(defval = false, title = "Invert Trade Direction?")
// the risk management inputs
inpTakeProfit   = input(defval = 0, title = "Take Profit Points", minval = 0)
inpStopLoss     = input(defval = 0, title = "Stop Loss Points", minval = 0)
inpTrailStop    = input(defval = 100, title = "Trailing Stop Loss Points", minval = 0)
inpTrailOffset  = input(defval = 0, title = "Trailing Stop Loss Offset Points", minval = 0)

// === RISK MANAGEMENT VALUE PREP ===
// if an input is less than 1, assuming not wanted so we assign 'na' value to disable it.
useTakeProfit   = inpTakeProfit  >= 1 ? inpTakeProfit  : na
useStopLoss     = inpStopLoss    >= 1 ? inpStopLoss    : na
useTrailStop    = inpTrailStop   >= 1 ? inpTrailStop   : na
useTrailOffset  = inpTrailOffset >= 1 ? inpTrailOffset : na

// === STRATEGY - LONG POSITION EXECUTION ===
enterLong() => buy or buyovershoot or buyovershoot1 or buyovershoot2 or buyovershoot3// functions can be used to wrap up and work out complex conditions
//exitLong() => oscillator <= 0
strategy.entry(id = "Buy", long = true, when = enterLong() )// use function or simple condition to decide when to get in
//strategy.close(id = "Buy", when = exitLong() )// ...and when to get out

// === STRATEGY - SHORT POSITION EXECUTION ===
enterShort() => sell or sellovershoot or sellovershoot2 or sellovershoot3
//exitShort() => oscillator >= 0
strategy.entry(id = "Sell", long = false, when = enterShort())
//strategy.close(id = "Sell", when = exitShort() )

// === STRATEGY RISK MANAGEMENT EXECUTION ===
// finally, make use of all the earlier values we got prepped
strategy.exit("Exit Buy", from_entry = "Buy", profit = useTakeProfit, loss = useStopLoss, trail_points = useTrailStop, trail_offset = useTrailOffset)
strategy.exit("Exit Sell", from_entry = "Sell", profit = useTakeProfit, loss = useStopLoss, trail_points = useTrailStop, trail_offset = useTrailOffset)