Estratégia de negociação de desvio de volatilidade SMA

Estratégia de negociação de desvio de volatilidade SMA
Visão geral da estratégia
A estratégia usa uma média móvel simples e alguns cálculos matemáticos para determinar o ponto de compra/venda. Usamos a SMA de 100 dias como linha de referência. Se o preço de fechamento estiver abaixo da linha, escolhemos o ponto de abertura de acordo com o grau de baixa da linha, este valor (<<<<<<<<<<<<<<<<<<<<<<<<<<<<<<<<<<<<<<<<<<<<<<<<<<<<<<<<<<<<<<<<<<<<<<<<<<<<<<<<<<<<<<<<<<<<<<<<<<<<<<<<<<<<<<<<<<<<<<<<<<<<<<<<<<<<<<<<<<<<<<<<<<<<<<<<<<<<<<<<<<<<<<<<<<<<<<<<<<<<<<<<
Princípio da estratégia
A estratégia usa três linhas SMA: linha rápida (default 14 dias), linha lenta (default 100 dias) e linha de referência (default 30 dias).
Quando o preço de fechamento está abaixo da linha de referência e o desvio baixo da linha lenta é maior do que o desvio baixo da configuração, e a linha rápida sobe e a linha lenta desce, entre em polinomios. Quando essas condições são satisfeitas, a linha rápida e a linha lenta têm uma grande probabilidade de se cruzar, sendo, portanto, um bom ponto de entrada.
Quando o preço de fechamento está acima da linha de referência e o desvio alto da linha lenta é maior do que o desvio alto da configuração, e o preço de fechamento aumentou em 3 linhas K consecutivas, realizando lucro, e a linha rápida está acima da linha lenta, o posicionamento é simples. Se o preço continuar a subir, o tracking stop loss será iniciado.
A posição de cada transação entra de acordo com uma certa proporção de direitos e interesses, controlando assim a posição.
Análise de vantagens estratégicas
- Aproveite o SMA para suavizar a curva de preços e filtrar o ruído do mercado.
- O SMA cruzado possui uma certa capacidade de previsão de tendências.
- O deslocamento de configuração em relação à linha SMA evita falsas rupturas.
- Combinação de tendências e indicadores cruzados para melhorar a precisão da tomada de decisão.
- A utilização de tracking de stop loss para bloquear o lucro e evitar a retirada.
Análise de risco estratégico
- O SMA é um forte atraso em si e pode ter perdido o ponto de viragem.
- A configuração errada do deslocamento pode levar a excessos radicais ou excessiva cautela.
- A configuração inadequada dos parâmetros de stop loss pode traçar um stop loss prematuro ou muito grande.
- O mercado não consegue lidar com a forte volatilidade dos preços.
Correspondência de melhorias:
- Filtragem de entrada em combinação com outros indicadores de antecedência.
- Optimização de testes repetitivos de desvio.
- Os parâmetros de estenose são testados repetidamente para encontrar o parâmetro ideal.
- Baixar posições em períodos de alta volatilidade.
Direção de otimização da estratégia
- Teste de SMAs de diferentes períodos para encontrar o parâmetro ideal
- Adição de outros indicadores para determinar a estrutura e tendências do mercado
- Optimizar o rastreamento de parâmetros de stop loss para bloquear mais lucros
- Ajustar posições de acordo com a volatilidade do mercado
- Aplicação simultânea em várias variedades e combinações
Resumir
A estratégia de negociação de desvio de movimentos de SMA procura o melhor momento de entrada, definindo os desvios com referência a diferentes médias de SMA. Ao mesmo tempo, o mecanismo de saída define um tracking stop loss para bloquear os ganhos. A estratégia é simples de entender e fácil de implementar.
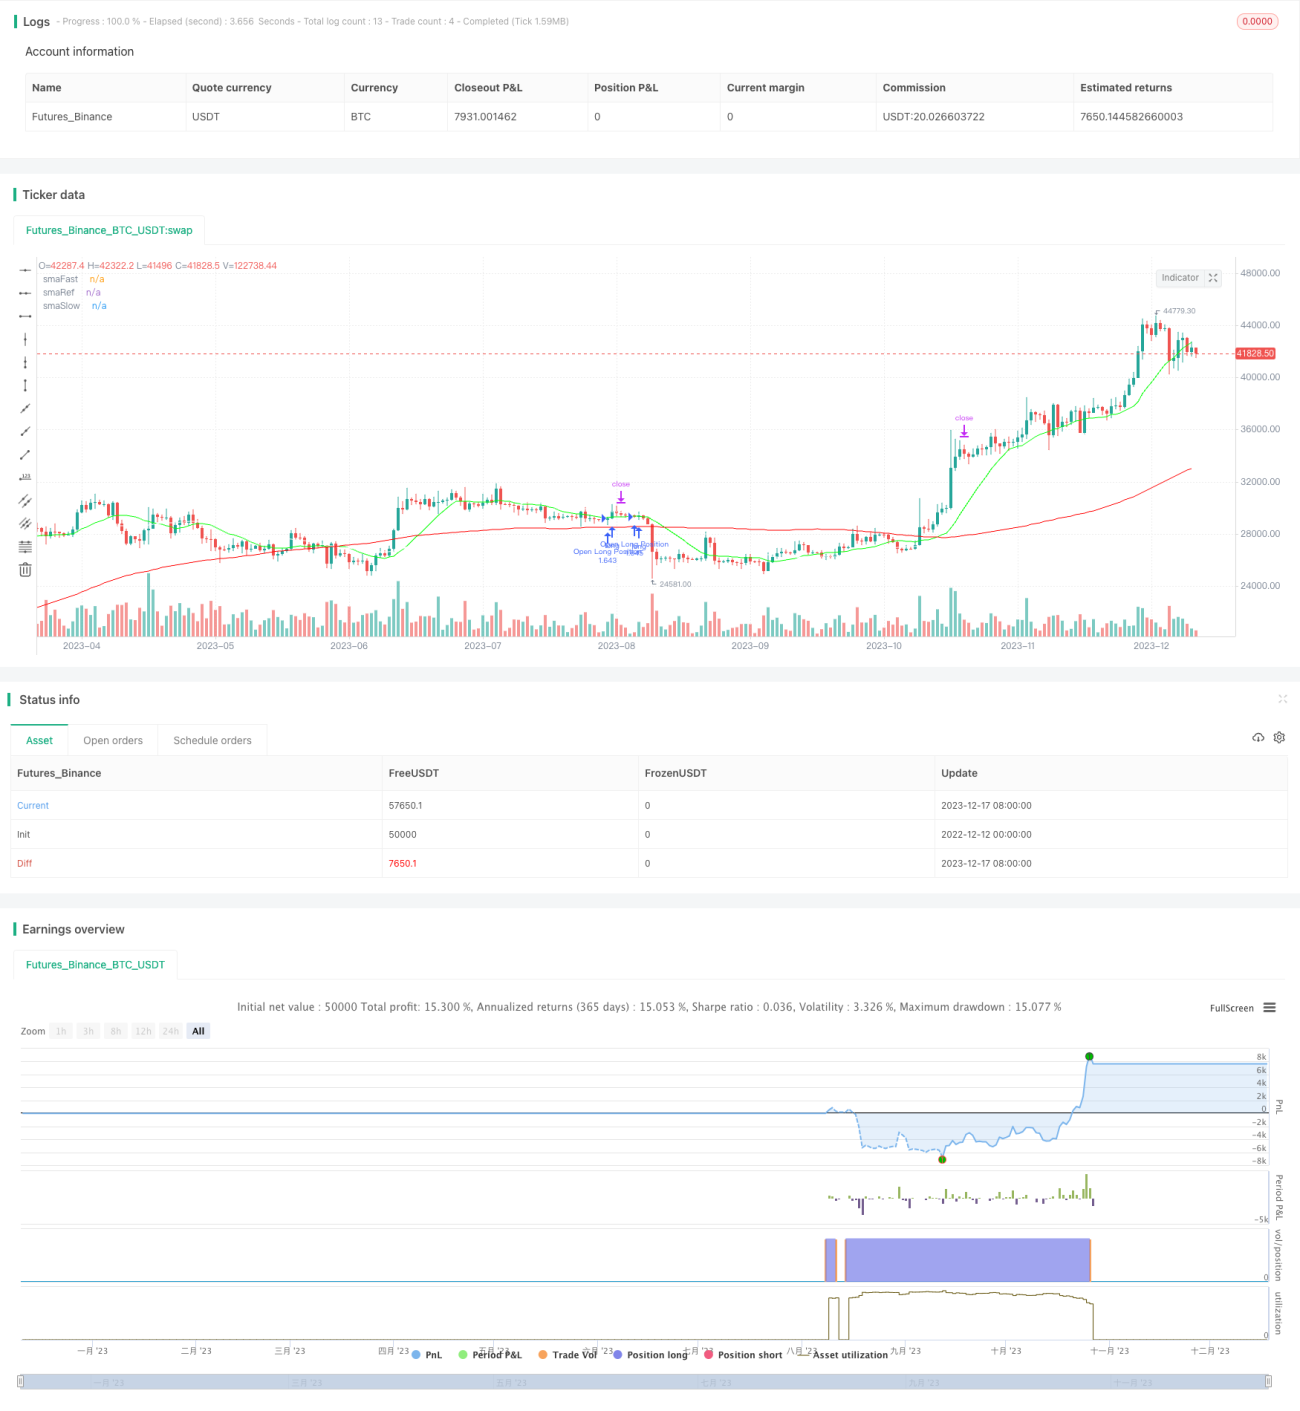
/*backtest
start: 2022-12-12 00:00:00
end: 2023-12-18 00:00:00
period: 1d
basePeriod: 1h
exchanges: [{"eid":"Futures_Binance","currency":"BTC_USDT"}]
*/

// @version=4
// Author: Sonny Parlin (highschool dropout)
strategy(shorttitle="SMA+Strategy", title="SMA Offset Strategy",
overlay=true, currency=currency.USD,- 1