Tendência de confirmação tripla seguindo estratégia impulsionada pelo indicador de momentum
Visão geral
Esta estratégia utiliza um mecanismo de tripla confirmação para gerar sinais de negociação, ou seja, um indicador de dinâmica para confirmar a forte tendência do mercado, um indicador de super tendência para confirmar a direção da tendência e um indicador de EMA como confirmação adicional da direção da tendência. A estratégia gera sinais de negociação de ativos ou ativos líquidos somente quando esses três indicadores satisfazem as condições, garantindo que apenas oportunidades de negociação de alta probabilidade sejam selecionadas.
Princípio da estratégia
Índice de Momentum (RSI)
O indicador de RSI dinâmico é usado para avaliar a força da tendência de mercado. Quando a leitura é maior que 60, a tendência de mercado é forte.
Os sinais de negociação são produzidos apenas em mercados de alta e baixa volatilidade.
Análise de Super Tendências
A linha de super tendência representa a direção da tendência do mercado. A posição só é considerada quando o preço ultrapassa a linha de super tendência.
Quando o preço atravessa a linha de supertrend de baixo para cima, é convertido em uma tendência de múltiplos cabeças; quando o preço atravessa a linha de supertrend de cima para baixo, é convertido em uma tendência de cabeças vazias.
Estratégia da EMA
- A EMA e sua linha de tendência auxiliar são usadas para confirmar a direção da tendência. O sinal de compra aparece somente quando a EMA quebra a linha de tendência auxiliar para cima, enquanto o sinal de cabeça vazia é o oposto.
Só quando os três indicadores estão em conformidade com as condições para a construção de uma posição, é emitido um verdadeiro sinal de negociação. Isso reduz significativamente o número de falsos sinais e aumenta a estabilidade da estratégia.
Análise de vantagens
A estratégia tem uma alta estabilidade e probabilidade de lucro. As principais vantagens são:
Múltiplos mecanismos de confirmação, filtragem eficaz de ruído, seleção de apenas transações de alta probabilidade.
Super Linha de Tendência: Dinâmica de rastreamento de stop loss e controle de risco eficaz.
Combinando a determinação da força da tendência, negocie apenas em tendências fortes, evitando riscos adicionais.
A verificação adicional dos indicadores da EMA assegura que o negócio está na direção correta.
É totalmente parametrizado e pode ser personalizado para qualquer tipo de comerciante.
Análise de Riscos
Os principais riscos desta estratégia são os sinais de transação errados causados por uma quebra anormal. Os principais riscos e soluções incluem:
Risco de invasão falsa: aumentar o mecanismo de verificação de invasão.
Aumento do risco de seqüência de tremores: ajuste adequadamente a seqüência de parada.
Risco de reversão de tendência: reduzir o período de detenção e parar os prejuízos a tempo.
Direção de otimização
A estratégia pode ser melhorada principalmente nas seguintes direções:
Parâmetros de otimização: Ajustar os parâmetros do indicador para mais variedades.
Aumentar a filtragem: combina mais indicadores para melhorar a qualidade do sinal.
Estratégia de combinação: combinação com outras estratégias para aproveitar as vantagens.
Parâmetro de ajuste dinâmico: Ajuste automático de parâmetros de acordo com a situação do mercado.
Aprendizado de máquina: algoritmos para encontrar automaticamente os parâmetros ótimos.
Resumir
Esta estratégia permite uma estratégia de negociação de alta probabilidade de confirmação múltipla através da combinação eficaz de indicadores dinâmicos, supertrends e EMAs. O rigoroso mecanismo de verificação de ruptura também o torna extremamente estável.
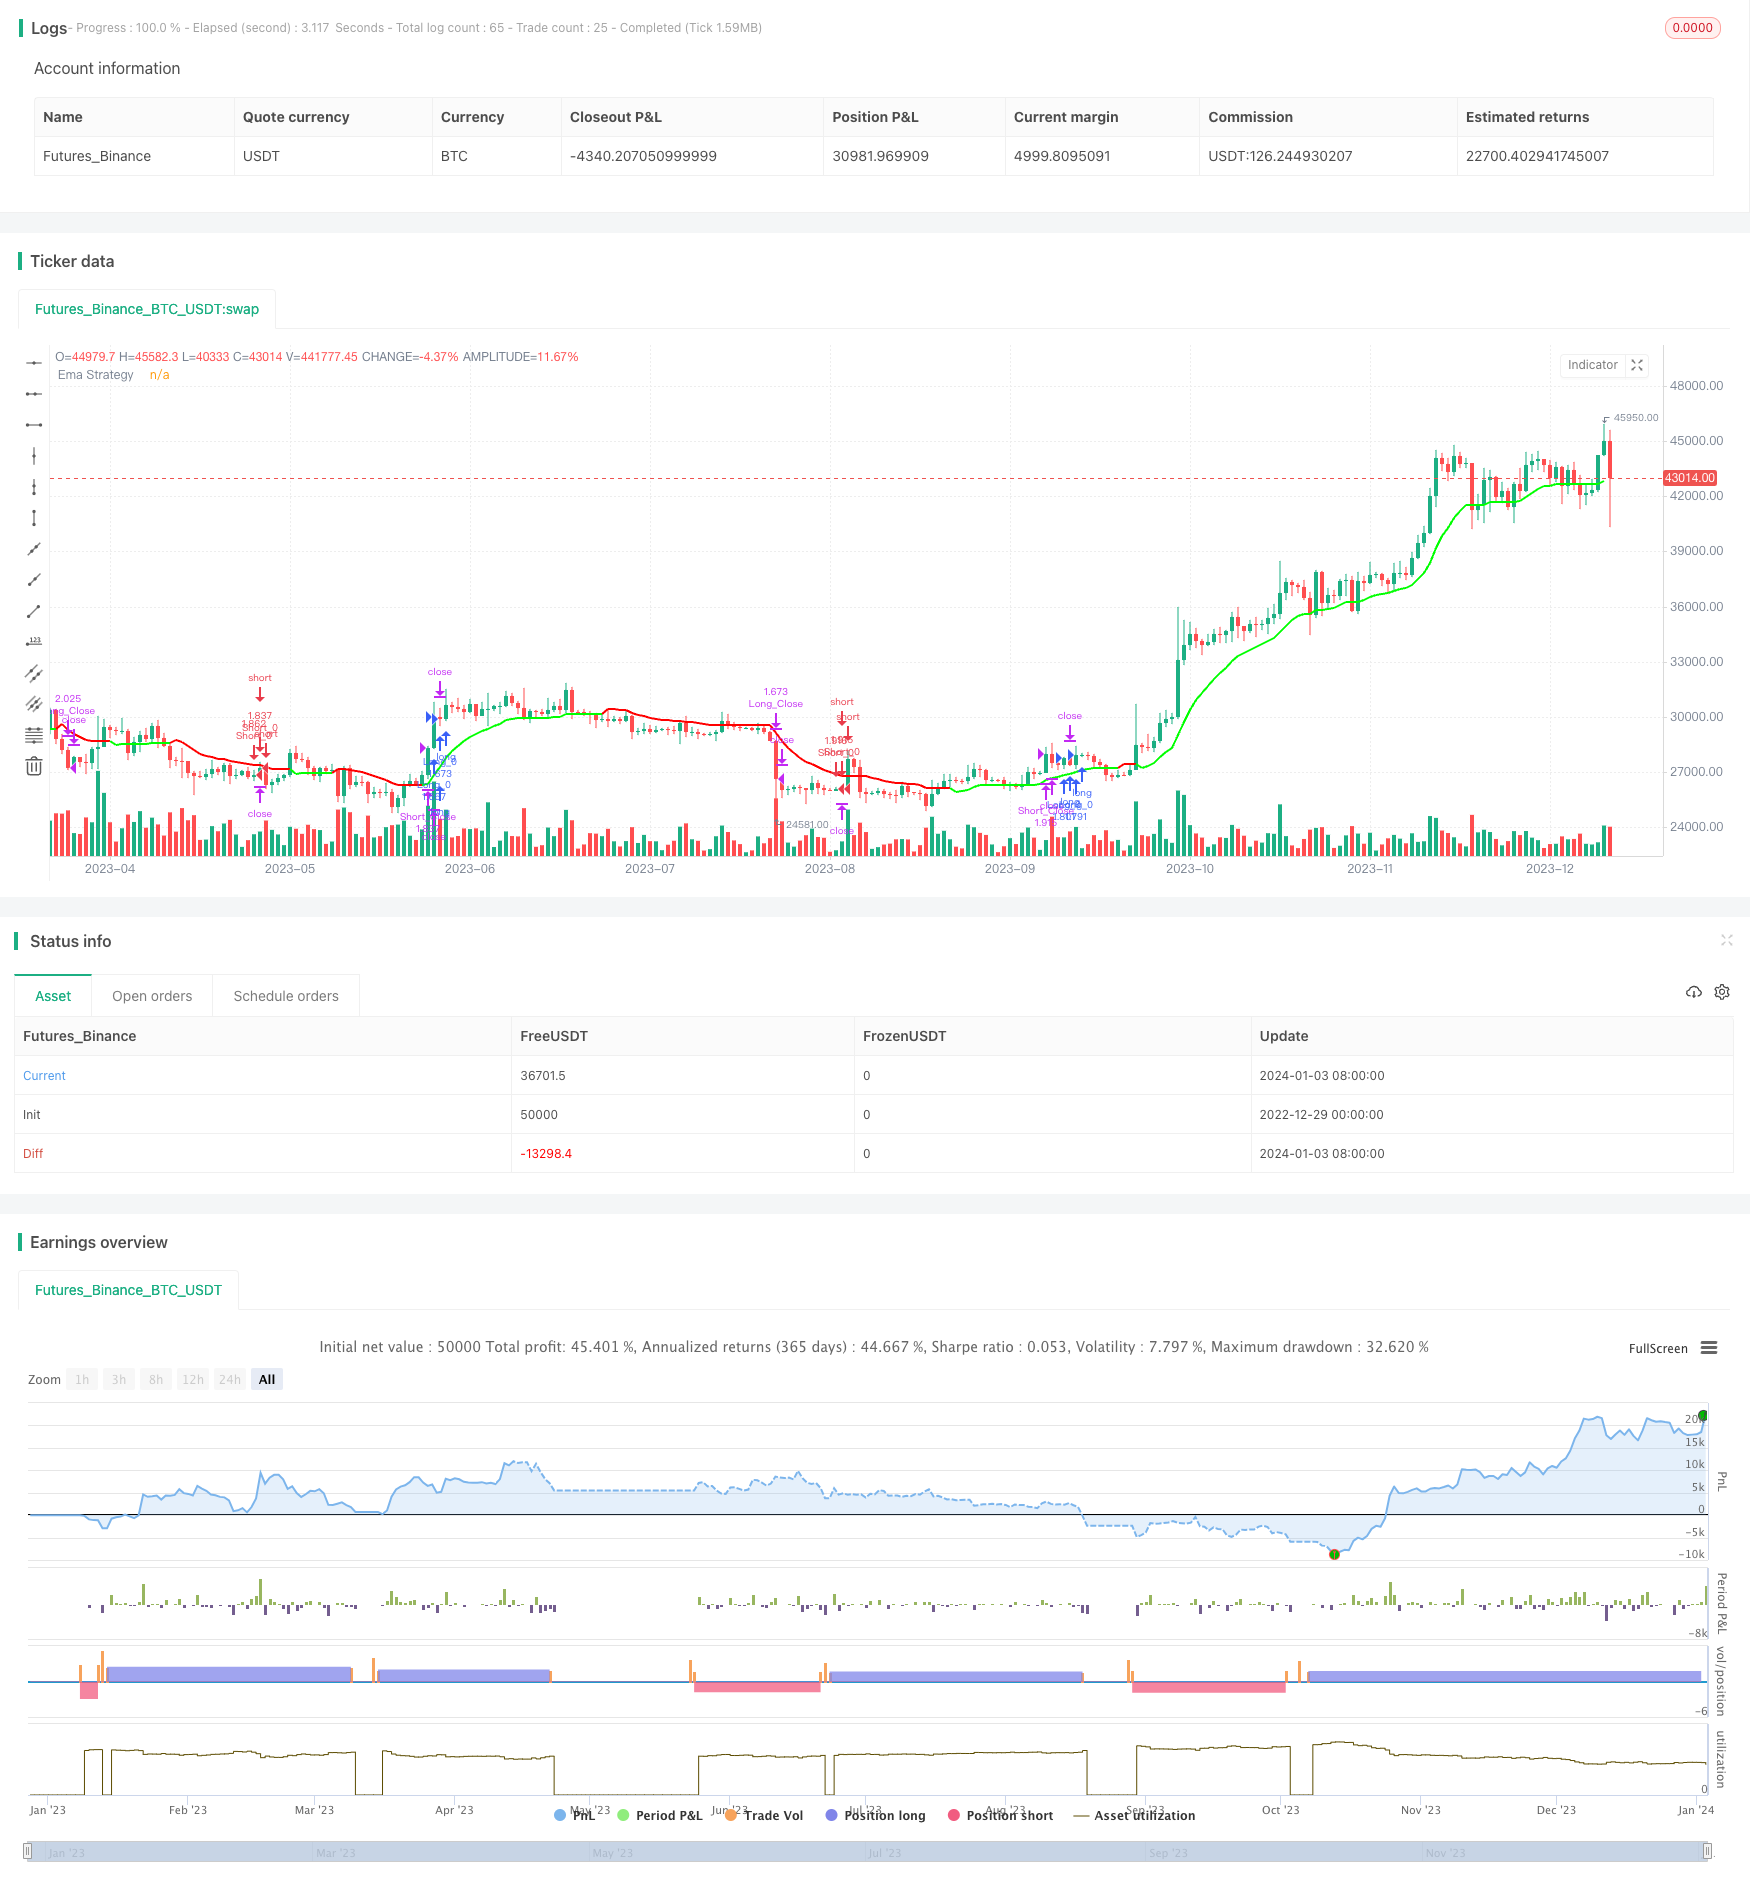
/*backtest
start: 2022-12-29 00:00:00
end: 2024-01-04 00:00:00
period: 1d
basePeriod: 1h
exchanges: [{"eid":"Futures_Binance","currency":"BTC_USDT"}]
*/

//@version=5
strategy('The Flash-Strategy (Momentum-RSI, EMA-crossover, ATR)', shorttitle='The Flash-Strategy (Momentum-RSI, EMA-crossover, ATR)', overlay=true,initial_capital = 1000)
//// author -  Baby_whale_to_moon

// MOM Rsi indicator
group_mom_rsi = "Rsi Of Momentum "
len = input.int(10, minval=1, title="Length Mom-Rsi", group =group_mom_rsi ,tooltip = 'This ind calculate Rsi value of Momentum we use this ind to determine power of trend')
src2 = close
mom = src2 - src2[len]
rsi_mom = ta.rsi(mom, len)
mom_rsi_val = input.int(60, minval=1, title="Mom-Rsi Limit Val", group =group_mom_rsi, tooltip = "When our Mom-Rsi value more then this we open LONG or Short, with help of this indicator we we determine the status of the trend")

// Super Trend Ind
group_supertrend = "SuperTrend indicator"
atrPeriod = input(10, "ATR Length SuperTrend", group = group_supertrend)
factor = input.float(3.0, "Factor SuperTrend", step = 0.01, group = group_supertrend)

[supertrend, direction] = ta.supertrend(factor, atrPeriod)

// Ema Indicator
group_most = "Ema indicator"
src = input(close, 'Source Ema Ind',group = group_most)
AP2 = input.int(defval=12, title='Length Ema Ind', minval=1,group = group_most)
Trail1 = ta.ema(src, AP2) //Ema func
AF2 = input.float(defval=1, title='Percent Ema Ind', minval=0.1,group = group_most) / 100
SL2 = Trail1 * AF2  // Stoploss Ema
Trail2 = 0.0
iff_1 = Trail1 > nz(Trail2[1], 0) ? Trail1 - SL2 : Trail1 + SL2
iff_2 = Trail1 < nz(Trail2[1], 0) and Trail1[1] < nz(Trail2[1], 0) ? math.min(nz(Trail2[1], 0), Trail1 + SL2) : iff_1
Trail2 := Trail1 > nz(Trail2[1], 0) and Trail1[1] > nz(Trail2[1], 0) ? math.max(nz(Trail2[1], 0), Trail1 - SL2) : iff_2

//Bull = ta.barssince(Trail1 > Trail2 and close > Trail2 and low > Trail2) < ta.barssince(Trail2 > Trail1 and close < Trail2 and high < Trail2)

//TS1 = plot(Trail1, 'ExMov', style=plot.style_line, color=Trail1 > Trail2 ? color.rgb(33, 149, 243, 100) : color.rgb(255, 235, 59, 100), linewidth=2)
//TS2 = plot(Trail2, 'ema', style=plot.style_line, color=Trail1 > Trail2 ? color.rgb(76, 175, 79, 30) : color.rgb(255, 82, 82, 30), linewidth=2)
//fill(TS1, TS2, Bull  ? color.green : color.red, transp=90)


// Strategy Sett
group_strategy = "Settings of Strategy"
Start_Time = input(defval=timestamp('01 January 2000 13:30 +0000'), title='Start Time of BackTest', group =group_strategy)
End_Time = input(defval=timestamp('30 April 2030 19:30 +0000'), title='End Time of BackTest', group =group_strategy)
dollar = input.float(title='Dollar Cost Per Position* ', defval=50000, group =group_strategy)
trade_direction = input.string(title='Trade_direction', group =group_strategy, options=['LONG', 'SHORT', 'BOTH'], defval='BOTH')
v1 = input(true, title="Version 1 - Uses SL/TP Dynamically ", group =group_strategy ,tooltip = 'With this settings our stoploss price increase or decrease with price to get better PNL score')

v2 = input(false, title="Version 2 -  Uses SL/TP Statically", group =group_strategy)
v2stoploss_input = input.float(5, title='Static Stop.Loss % Val', minval=0.01, group =group_strategy)/100
v2takeprofit_input = input.float(10, title='Static Take.Prof % Val', minval=0.01, group =group_strategy)/100

v2stoploss_level_long = strategy.position_avg_price * (1 - v2stoploss_input)
v2takeprofit_level_long = strategy.position_avg_price * (1 + v2takeprofit_input)

v2stoploss_level_short = strategy.position_avg_price * (1 + v2stoploss_input)
v2takeprofit_level_short = strategy.position_avg_price * (1 - v2takeprofit_input)

group_line = "Line Settings"
show_sl_tp = input.bool(title='  Show StopLoss - TakeProf Lines',inline = "1", defval=true, group =group_line)
show_trend_line = input.bool(title='  Show Trend Line',inline = '3' ,defval=true, group =group_line)
stoploss_colour = input.color(title='StopLoss Line Colour',inline = '2' ,defval=color.rgb(255, 255, 0), group =group_line)
up_trend_line_colour = input.color(title='Up Trend line Colour',inline = '4' ,defval=color.rgb(0, 255, 0, 30), group =group_line)
down_trend_line_colour = input.color(title='Down Trend line Colour',inline = '4' ,defval=color.rgb(255, 0, 0, 30), group =group_line)

//plot(supertrend ,color = strategy.position_size > 0 and show_sl_tp ? color.rgb(255, 0, 0) :show_sl_tp ? color.rgb(0, 255, 0) : na , style = plot.style_steplinebr,linewidth = 2)
// plot(supertrend ,color = show_sl_tp and v1 ? stoploss_colour : na , style = plot.style_steplinebr,linewidth = 2)

// plot(v2stoploss_level_long ,color = strategy.position_size > 0 and show_sl_tp and v2 ? stoploss_colour : na , style = plot.style_steplinebr,linewidth = 2)
// plot(v2stoploss_level_short ,color = strategy.position_size < 0 and show_sl_tp and v2 ? stoploss_colour : na , style = plot.style_steplinebr,linewidth = 2)
// plot(v2takeprofit_level_long  ,color = strategy.position_size > 0 and show_sl_tp and v2 ? up_trend_line_colour : na , style = plot.style_steplinebr,linewidth = 2)
// plot(v2takeprofit_level_short ,color = strategy.position_size < 0 and show_sl_tp and v2 ? up_trend_line_colour : na , style = plot.style_steplinebr,linewidth = 2)


TS2 = plot(Trail2, 'Ema Strategy', style=plot.style_line, color=show_trend_line and Trail1 < Trail2 ? down_trend_line_colour : show_trend_line ? up_trend_line_colour  : na, linewidth=2)

// bgcolor(buy_signal ? color.rgb(0, 230, 119, 80) : na)
// bgcolor(sell_signal ? color.rgb(255, 82, 82, 80) : na)

Time_interval = true
buy_signal = Trail1 > Trail2 and direction < 0 and rsi_mom > mom_rsi_val and Time_interval
sell_signal =Trail1 < Trail2 and direction > 0 and rsi_mom > mom_rsi_val and Time_interval


// Strategy entries
if strategy.opentrades == 0 and buy_signal and ( trade_direction == 'LONG' or trade_direction == 'BOTH')
    strategy.entry('Long_0', strategy.long, qty=dollar / close)

if strategy.opentrades == 0 and sell_signal and ( trade_direction == 'SHORT' or trade_direction == 'BOTH')
    strategy.entry('Short_0', strategy.short, qty=dollar / close)


if close < supertrend and v1
    strategy.exit('Long_Close',from_entry = "Long_0", stop=supertrend, qty_percent=100)
if  v2 and strategy.position_size > 0
    strategy.exit('Long_Close',from_entry = "Long_0", stop=v2stoploss_level_long,limit= v2takeprofit_level_long  , qty_percent=100)

if close > supertrend and v1
    strategy.exit('Short_Close',from_entry = "Short_0", stop=supertrend, qty_percent=100)
if  v2 and strategy.position_size < 0
    strategy.exit('Short_Close',from_entry = "Short_0", stop=v2stoploss_level_short,limit= v2takeprofit_level_short ,qty_percent=100)