Estratégia de negociação quantitativa do fractal Williams combinada com o indicador ZZ
Visão geral
Trata-se de uma estratégia de negociação quantitativa que utiliza a teoria da fração de Bill Williams e o indicador ZZ. A estratégia determina a tendência do mercado com base no cálculo da fração de Williams e, em combinação com o indicador ZZ, traça linhas de resistência de suporte para descobrir possíveis pontos de ruptura, permitindo a negociação de seguimento de tendência.
Princípio da estratégia
A estratégia primeiro calcula a fração de Williams para determinar se o momento está em uma fração ascendente ou descendente. Se for uma fração ascendente, considere que está em uma tendência ascendente; se for uma fração descendente, considere que está em uma tendência descendente.
A linha de suporte e resistência do indicador ZZ são então traçadas de acordo com o ponto de divisão. Se o preço quebrar a resistência correspondente à linha de divisão de alta, faça mais; se o preço quebrar a linha de suporte correspondente à de baixa, faça zero.
Com esta combinação, pode-se capturar a mudança de tendência em tempo hábil, permitindo o acompanhamento de tendências.
Análise de vantagens estratégicas
Esta estratégia combina o uso de dois métodos diferentes de análise técnica, a deformação de Williams e o ZZ Indicator, para explorar mais oportunidades de negociação.
Ele pode determinar a mudança de tendência do mercado em tempo útil e definir boas condições de stop loss, ajudando a entender a direção da tendência principal. Além disso, o indicador ZZ pode filtrar algumas situações de falsas rupturas e evitar perdas desnecessárias.
No geral, a estratégia leva em consideração tanto o julgamento de tendências como a escolha de pontos de entrada específicos, fazendo um equilíbrio entre riscos e benefícios.
Análise de risco estratégico
O maior risco desta estratégia é que o discernimento de fracturas e o ZZ Indicador podem emitir sinais de negociação errados, resultando em prejuízos desnecessários. Por exemplo, após a ruptura da linha de resistência, o preço pode recuar rapidamente e não subir de forma sustentada.
Além disso, o método de cálculo da fração pode ser mal avaliado devido à configuração inadequada do ciclo de tempo. Se o ciclo de tempo for muito curto, a probabilidade de falsa ruptura aumentará.
Para reduzir esses riscos, pode-se ajustar adequadamente os parâmetros de cálculo da deformação, ou pode-se reduzir os sinais errados por meio do aumento das condições de filtragem. Além disso, pode-se definir uma maior amplitude de stop loss para controlar os perdas individuais.
Direção de otimização da estratégia
A estratégia pode ser melhorada através de:
A adição de filtros de indicadores de força, como MACD ou indicadores de faixa de Bryn, pode evitar algumas falsas rupturas.
Optimizar a configuração dos parâmetros de fracionamento, ajustar a forma de cálculo dos pontos altos e baixos, reduzir o período de tempo para obter um julgamento de tendência mais preciso.
Aumentar a precisão dos algoritmos de aprendizagem de máquina para avaliar tendências e usar o discernimento da IA para evitar limitações de configuração manual.
A adição de um mecanismo de suspensão de prejuízos adaptativo, que permite ajustar a quantidade de suspensão de prejuízos de acordo com a volatilidade do mercado.
O algoritmo de aprendizagem profunda é usado para otimizar a configuração dos parâmetros globais.
Resumir
Esta estratégia, através de uma combinação inteligente de teoria de divisão de Williams e indicadores ZZ, permite o julgamento e captura de mudanças de tendências de mercado em tempo hábil. Ela mantém uma alta taxa de vitória e espera obter um lucro excedente de estabilidade a longo prazo.
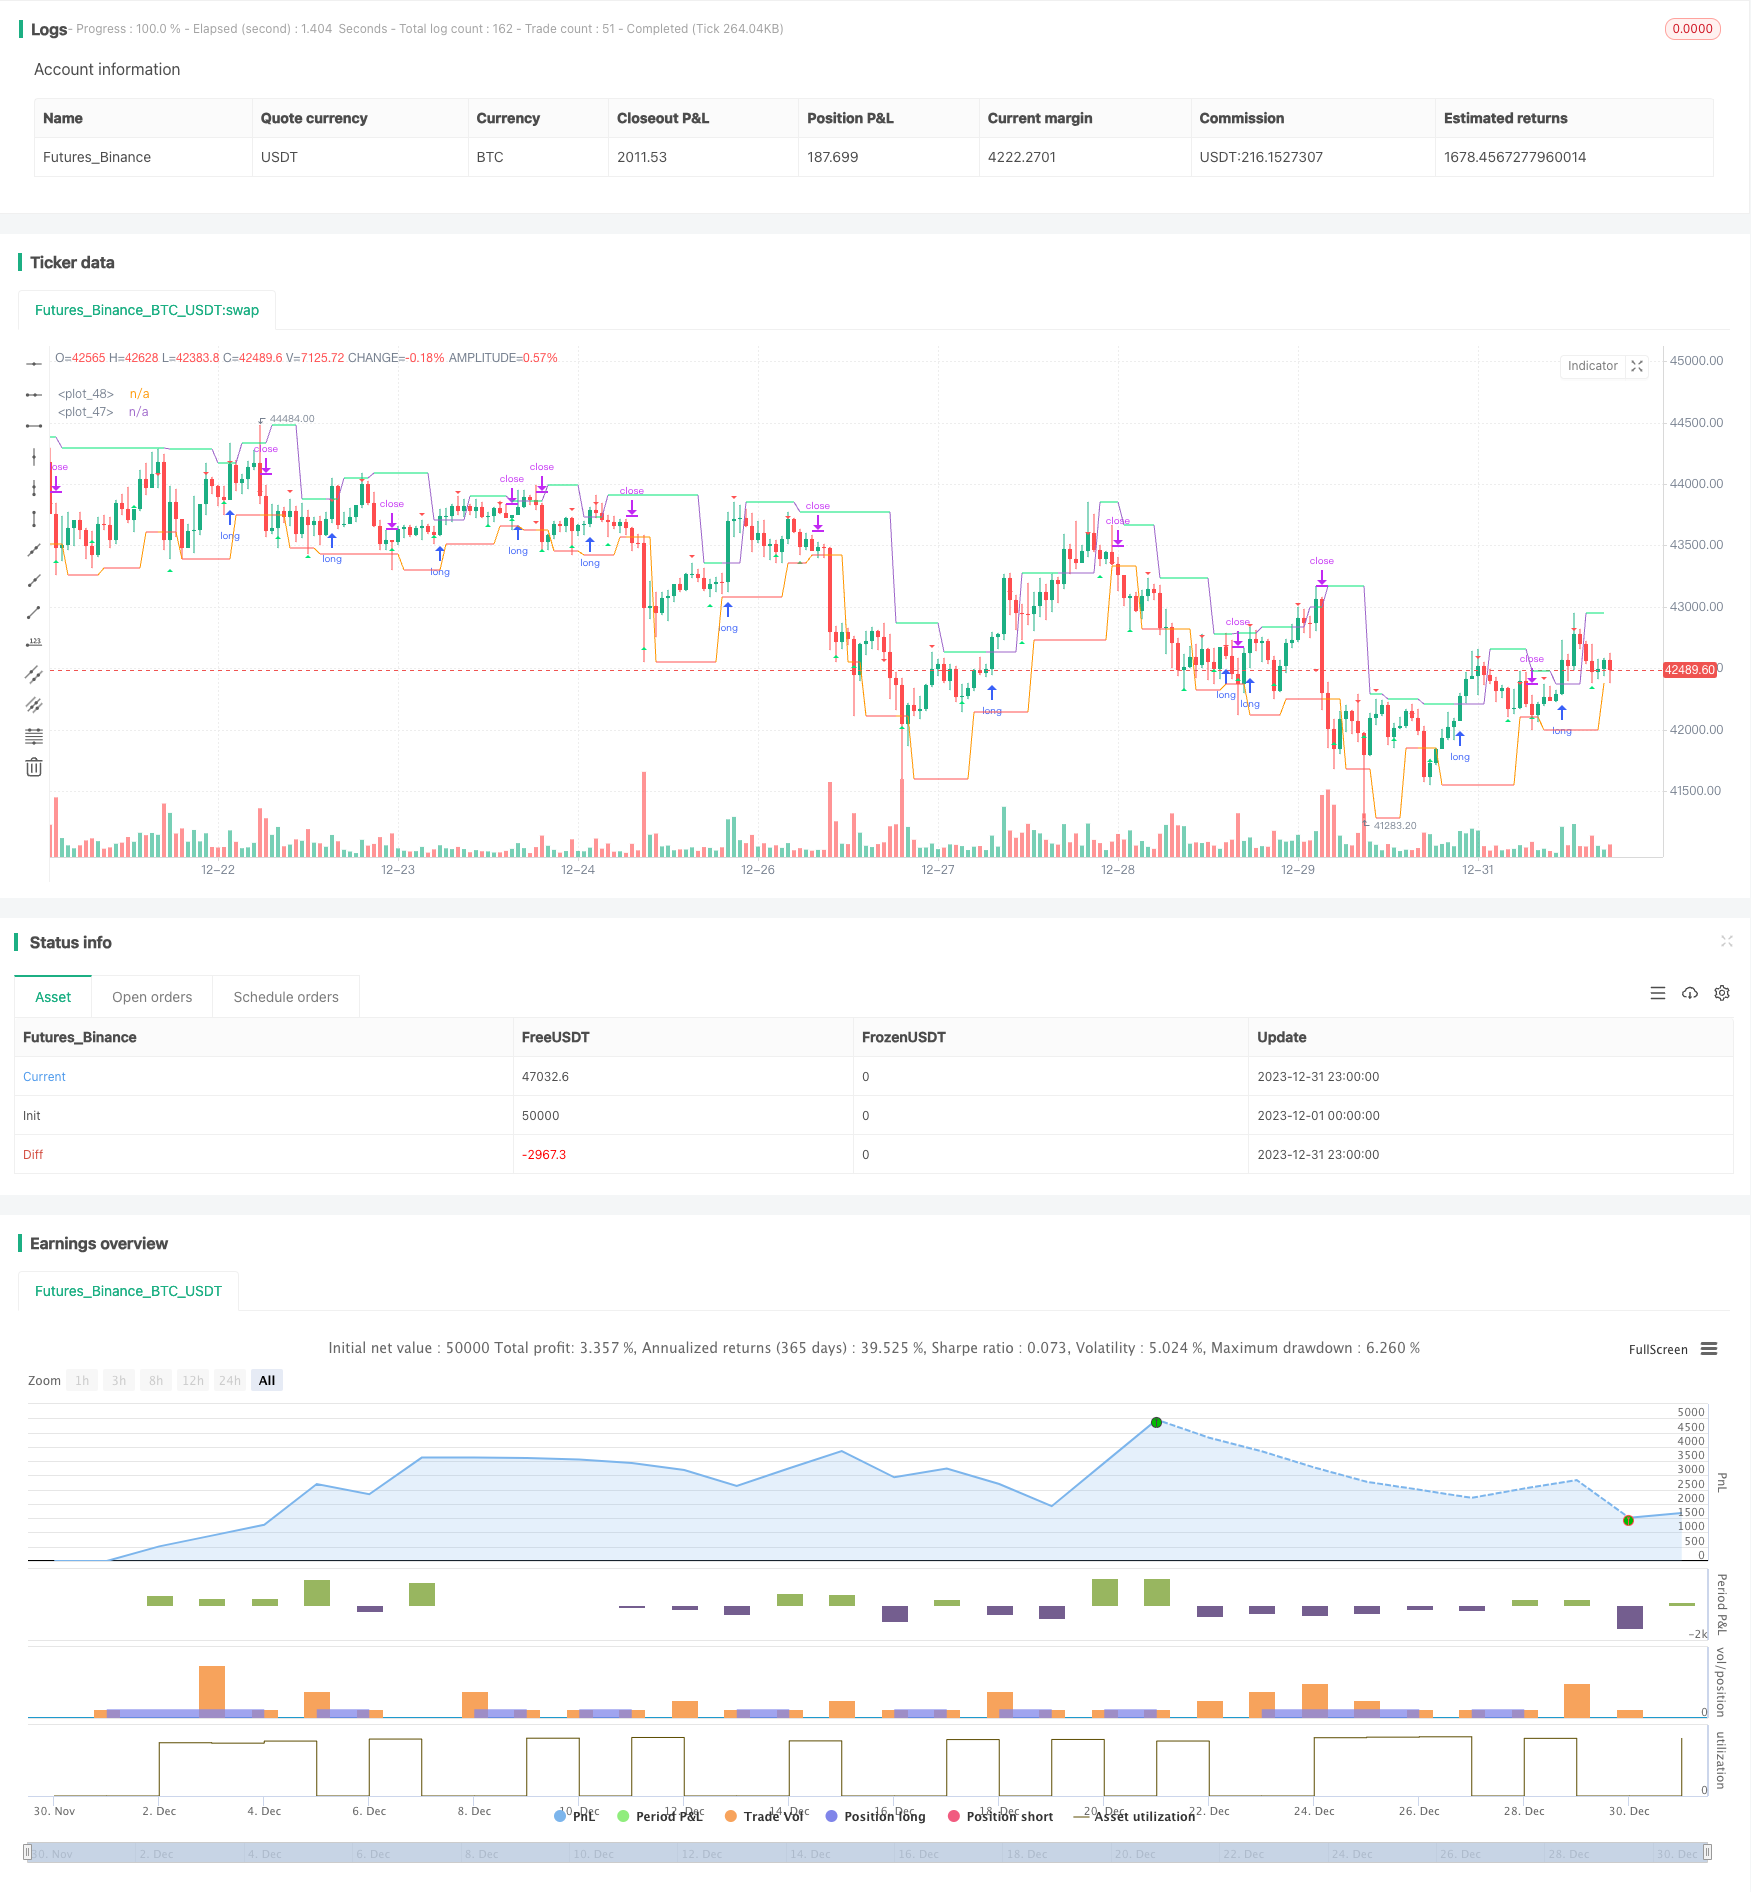
/*backtest
start: 2023-12-01 00:00:00
end: 2023-12-31 23:59:59
period: 1h
basePeriod: 15m
exchanges: [{"eid":"Futures_Binance","currency":"BTC_USDT"}]
*/

//@version=4
strategy(title = "robotrading ZZ-8 fractals", shorttitle = "ZZ-8", overlay = true, default_qty_type = strategy.percent_of_equity, initial_capital = 100, default_qty_value = 100, commission_value = 0.1)

//Settings
needlong  = input(true, defval = true, title = "Long")
needshort = input(false, defval = true, title = "Short")
filterBW = input(false, title="filter Bill Williams Fractals")
showll = input(true, title = "Show levels")
showff = input(true, title = "Show fractals (repaint!)")
showdd = input(true, title = "Show dots (repaint!)")
showbg = input(false, title = "Show background")
showlb = input(false, title = "Show drawdown")
startTime = input(defval = timestamp("01 Jan 2000 00:00 +0000"), title = "Start Time", type = input.time, inline = "time1")
finalTime = input(defval = timestamp("31 Dec 2099 23:59 +0000"), title = "Final Time", type = input.time, inline = "time1")

//Variables
loss = 0.0
maxloss = 0.0
equity = 0.0
truetime = true

//Fractals
isRegularFractal(mode) =>
    ret = mode == 1 ? high[4] < high[3] and high[3] < high[2] and high[2] > high[1] and high[1] > high[0] : mode == -1 ? low[4] > low[3] and low[3] > low[2] and low[2] < low[1] and low[1] < low[0] : false
isBWFractal(mode) =>
    ret = mode == 1 ? high[4] < high[2] and high[3] <= high[2] and high[2] >= high[1] and high[2] > high[0] : mode == -1 ? low[4] > low[2] and low[3] >= low[2] and low[2] <= low[1] and low[2] < low[0] : false
filteredtopf = filterBW ? isRegularFractal(1) : isBWFractal(1)
filteredbotf = filterBW ? isRegularFractal(-1) : isBWFractal(-1)

//Triangles
plotshape(filteredtopf and showff, title='Filtered Top Fractals', style=shape.triangledown, location=location.abovebar, color= color.red, offset=-2)
plotshape(filteredbotf and showff, title='Filtered Bottom Fractals', style=shape.triangleup, location=location.belowbar, color= color.lime, offset=-2)

//Levels
hh = 0.0
ll = 0.0
hh := filteredtopf ? high[2] : hh[1]
ll := filteredbotf ? low[2] : ll[1]

//Trend
trend = 0
trend := high >= hh[1] ? 1 : low <= ll[1] ? -1 : trend[1]

//Lines
hcol = showll and hh == hh[1] and close < hh ? color.lime : na
lcol = showll and ll == ll[1] and close > ll ? color.red : na
plot(hh, color = hcol)
plot(ll, color = lcol)

//Dots
// var line hline = na
// if hh != hh[1] and showdd
//     hline := line.new(bar_index - 0, hh[0], bar_index - 2, hh[0], xloc = xloc.bar_index, extend = extend.none, style = line.style_dotted, color = color.lime, width = 1)
// var line lline = na
// if ll != ll[1] and showdd
//     lline := line.new(bar_index - 0, ll[0] - syminfo.mintick, bar_index - 2, ll[0] - syminfo.mintick, xloc = xloc.bar_index, extend = extend.none, style = line.style_dotted, color = color.red, width = 1)

//Background
bgcol = showbg == false ? na : trend == 1 ? color.lime : trend == -1 ? color.red : na
bgcolor(bgcol, transp = 80)

//Orders
if hh > 0 and needlong
    strategy.entry("Long", strategy.long, na, stop = hh, when = needlong and truetime)
    strategy.exit("Exit Long", "Long", stop = ll, when = needshort == false)
if ll > 0 and startTime
    strategy.entry("Short", strategy.short, na, stop = ll, when = needshort and truetime)
    strategy.exit("Exit Short", "Short", stop = hh, when = needlong == false)
if time > finalTime
    strategy.close_all()
    strategy.cancel("Long")
    strategy.cancel("Short")

if showlb

    //Drawdown
    max = 0.0
    max := max(strategy.equity, nz(max[1]))
    dd = (strategy.equity / max - 1) * 100
    min = 100.0
    min := min(dd, nz(min[1]))

    //Max loss size
    equity := strategy.position_size != strategy.position_size[1] ? strategy.equity : equity[1]
    loss := equity < equity[1] ? ((equity / equity[1]) - 1) * 100 : 0
    maxloss := min(nz(maxloss[1]), loss)

    //Label
    min := round(min * 100) / 100
    maxloss := round(maxloss * 100) / 100
    labeltext = "Drawdown: " + tostring(min) + "%" + "\nMax.loss " + tostring(maxloss) + "%"
    var label la = na
    label.delete(la)
    tc = min > -100 ? color.white : color.red
    osx = timenow + round(change(time)*50)
    osy = highest(100)
    la := label.new(x = osx, y = osy, text = labeltext, xloc = xloc.bar_time, yloc = yloc.price, color = color.black, style = label.style_labelup, textcolor = tc)