Стратегия следования за трендом Momentum

1
Follow
1779
Followers
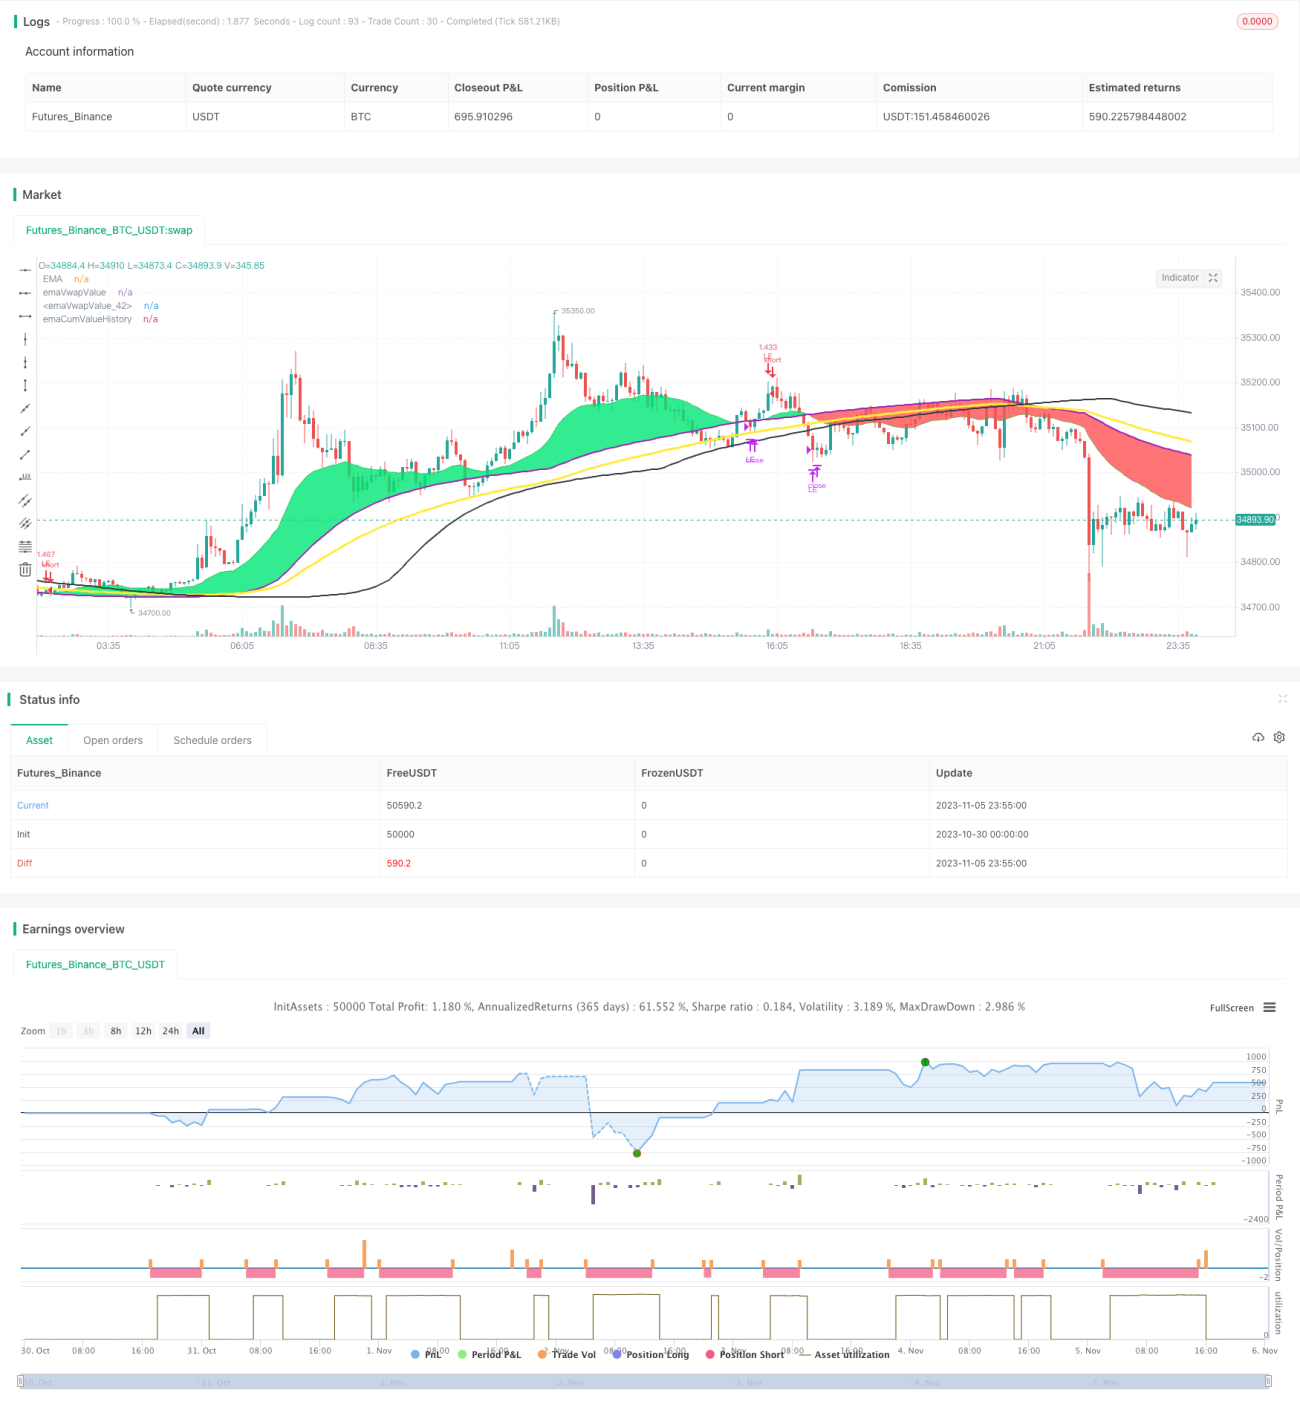
Обзор
Стратегия основана на анализе тенденций в движущихся средних и объемах сделок, установлении динамических показателей и проведении торгов в соответствии с тенденциями.
Стратегический принцип
- Вычислить среднюю линию EMA по цене закрытия и среднюю линию EMA по объему сделок
- Когда close попадает на EMA, он оценивается как восходящий тренд, и используется для многосторонних операций.
- Когда продолжается повышение, закрытие на прохождении 2-кратного среднего уровня накопленной EMA, добавление лишних позиций
- Настройка RSI, когда RSI превышает 90 и выровняет 1/3 позиции, чтобы получить конец
- При закрытии EMA, она будет расцениваться как понижающая тенденция и ликвидирована.
- При закрытии, когда EMA пересекается, оценивается как нисходящая тенденция, делается операция на пустом месте
- Установите стоп-линию, стоп-линия является фиксированным процентом от цены входа
- Пустые головы приносят прибыль так же, как и многоголовые.
Анализ преимуществ
Основные преимущества этой стратегии:
- Используя среднюю линию EMA, можно эффективно отслеживать тенденции
- Накопленная EMA по объему сделок используется для оценки реальных изменений в тренде
- Следить за динамическим RSI, чтобы получить прибыль
- Риск под контролем, есть линейка остановки
- Возможность адаптации к различным ситуациям, гибкая настройка параметров
Анализ рисков
Основные риски этой стратегии:
- EMA отстает от средней и может пропустить поворотный момент
- Количество сделок не всегда отражает реальные тенденции
- Фиксированный процентный стоп может быть слишком механизированным
- Параметры слишком большие, чтобы их можно было использовать.
- Частые транзакции с высокими затратами
Как решить проблему риска:
- Оптимизация параметров EMA, снижение задержки
- Сигналы подтверждения загрузки в сочетании с другими показателями
- Оптимизация стоп-лосса в зависимости от рыночных условий
- Упрощение параметров, сохранение только основных настроек
- Надлежащее ослабление линий остановки и частоты торгов
Направление оптимизации
Эта стратегия может быть оптимизирована в следующих аспектах:
- Тестирование различных параметров EMA, чтобы найти оптимальную комбинацию параметров
- Увеличение кратного числа VOLUME, определяемого как сильный или слабый входящий сигнал
- Вместе с MACD, KD и другими показателями подтверждение поступления
- Оптимизация стоп-лосса в зависимости от специфики акции
- Оптимизация частоты транзакций и снижение их стоимости
Подвести итог
Эта стратегия в целом является стратегией отслеживания тенденций, основанной на равнолинейной системе. Основная идея заключается в том, чтобы использовать EMA для определения направления тенденции и подтверждения входа в игру в сочетании с динамическим показателем VOLUME.
Source
Pine
Strategy parameters
Related strategies
Comment
All comments (0)
No data
- 1