Стратегия бэктестинга Rainbow Oscillator
Обзор
Стратегия отсчета радужного колебателя - это количественная торговая стратегия, основанная на индикаторе радужного колебателя. Эта стратегия определяет направление и силу тенденции рынка, рассчитывая степень отклонения между ценой акций и средней линией, чтобы судить о направлении длинных и коротких позиций.
Стратегический принцип
Центральным показателем этой стратегии является Rainbow Oscillator (RO), формула которого такова:
RO = 100 * ((收盘价 - 10日移动平均线) / (最高价的最高值 - 最低价的最低值))
Десятидневная скользящая средняя - это простая скользящая средняя за 10 циклов закрытия цены. Этот показатель отражает отклонение цены от собственной средней линии. Когда RO > 0, это означает, что цена выше средней линии, и это является позитивным сигналом; когда RO < 0, это означает, что цена ниже средней линии, и это является позитивным сигналом.
Стратегия также рассчитывает вспомогательный показатель - пропускная способность (Bandwidth, RB), формула которого выглядит следующим образом:
RB = 100 * ((均线的最高值 - 均线的最低值) / (最高价的最高值 - 最低价的最低值))
RB отражает ширину между средними линиями. Чем больше RB, тем больше колебания цен, а наоборот, стабильность цен. Показатель RB может быть использован для оценки стабильности рынка.
В зависимости от значений показателей RO и RB, стратегия определяет степень отклонения цен и стабильность рынка, чтобы создать торговый сигнал для длинных и коротких позиций.
Стратегические преимущества
Эта стратегия имеет следующие преимущества:
- Основываясь на двух показателях, избегайте ограничений, связанных с одним показателем.
- Это позволяет одновременно оценивать ценовые тенденции и стабильность рынка.
- Расчеты просты, легко понять и реализовать.
- Визуализация показателей, создавая эффект радужной ленты, легко читается.
Стратегический риск
Однако эта стратегия также несет в себе некоторые риски:
- Неправильная настройка параметров показателей RO и RB может привести к ошибкам в торговых сигналах.
- Двухлинейная стратегия может привести к ошибочным сигналам и частым сделкам.
- Неправильный выбор сортов и периодичность отбора влияют на эффективность стратегии.
- Если не учитывать стоимость транзакций, это может быть не очень эффективно.
Ответ:
- Параметры оптимизации показателей RO и RB.
- Добавить фильтрующие условия, чтобы избежать частых сделок.
- Выбор подходящего периода отбора и разновидности.
- Расчет и учет стоимости сделки.
Оптимизация стратегии
Эта стратегия также может быть оптимизирована в следующих аспектах:
- Добавление функции Smooth к показателю RO позволяет избежать резких колебаний.
- Присоединяйтесь к стратегии Stop Loss и контролируйте свои убытки.
- Повышение вероятности получения прибыли в комбинации с другими показателями.
- Добавление моделей машинного обучения для прогнозирования и оценки эффективности показателей.
- Оптимизация параметров для различных сортов, повышение адаптации.
Подвести итог
Стратегия отсчета радужного колебателя определяет рыночные тенденции и стабильность путем расчета отклонения между ценой и средней линией, с тем чтобы совершать длинные и короткие сделки. Эта стратегия является интуитивно понятной, простой в реализации и имеет определенную практическую ценность. Но также существуют некоторые риски, которые необходимо оптимизировать с учетом параметров и правил торговли, снизить риск и повысить эффективность на диске.
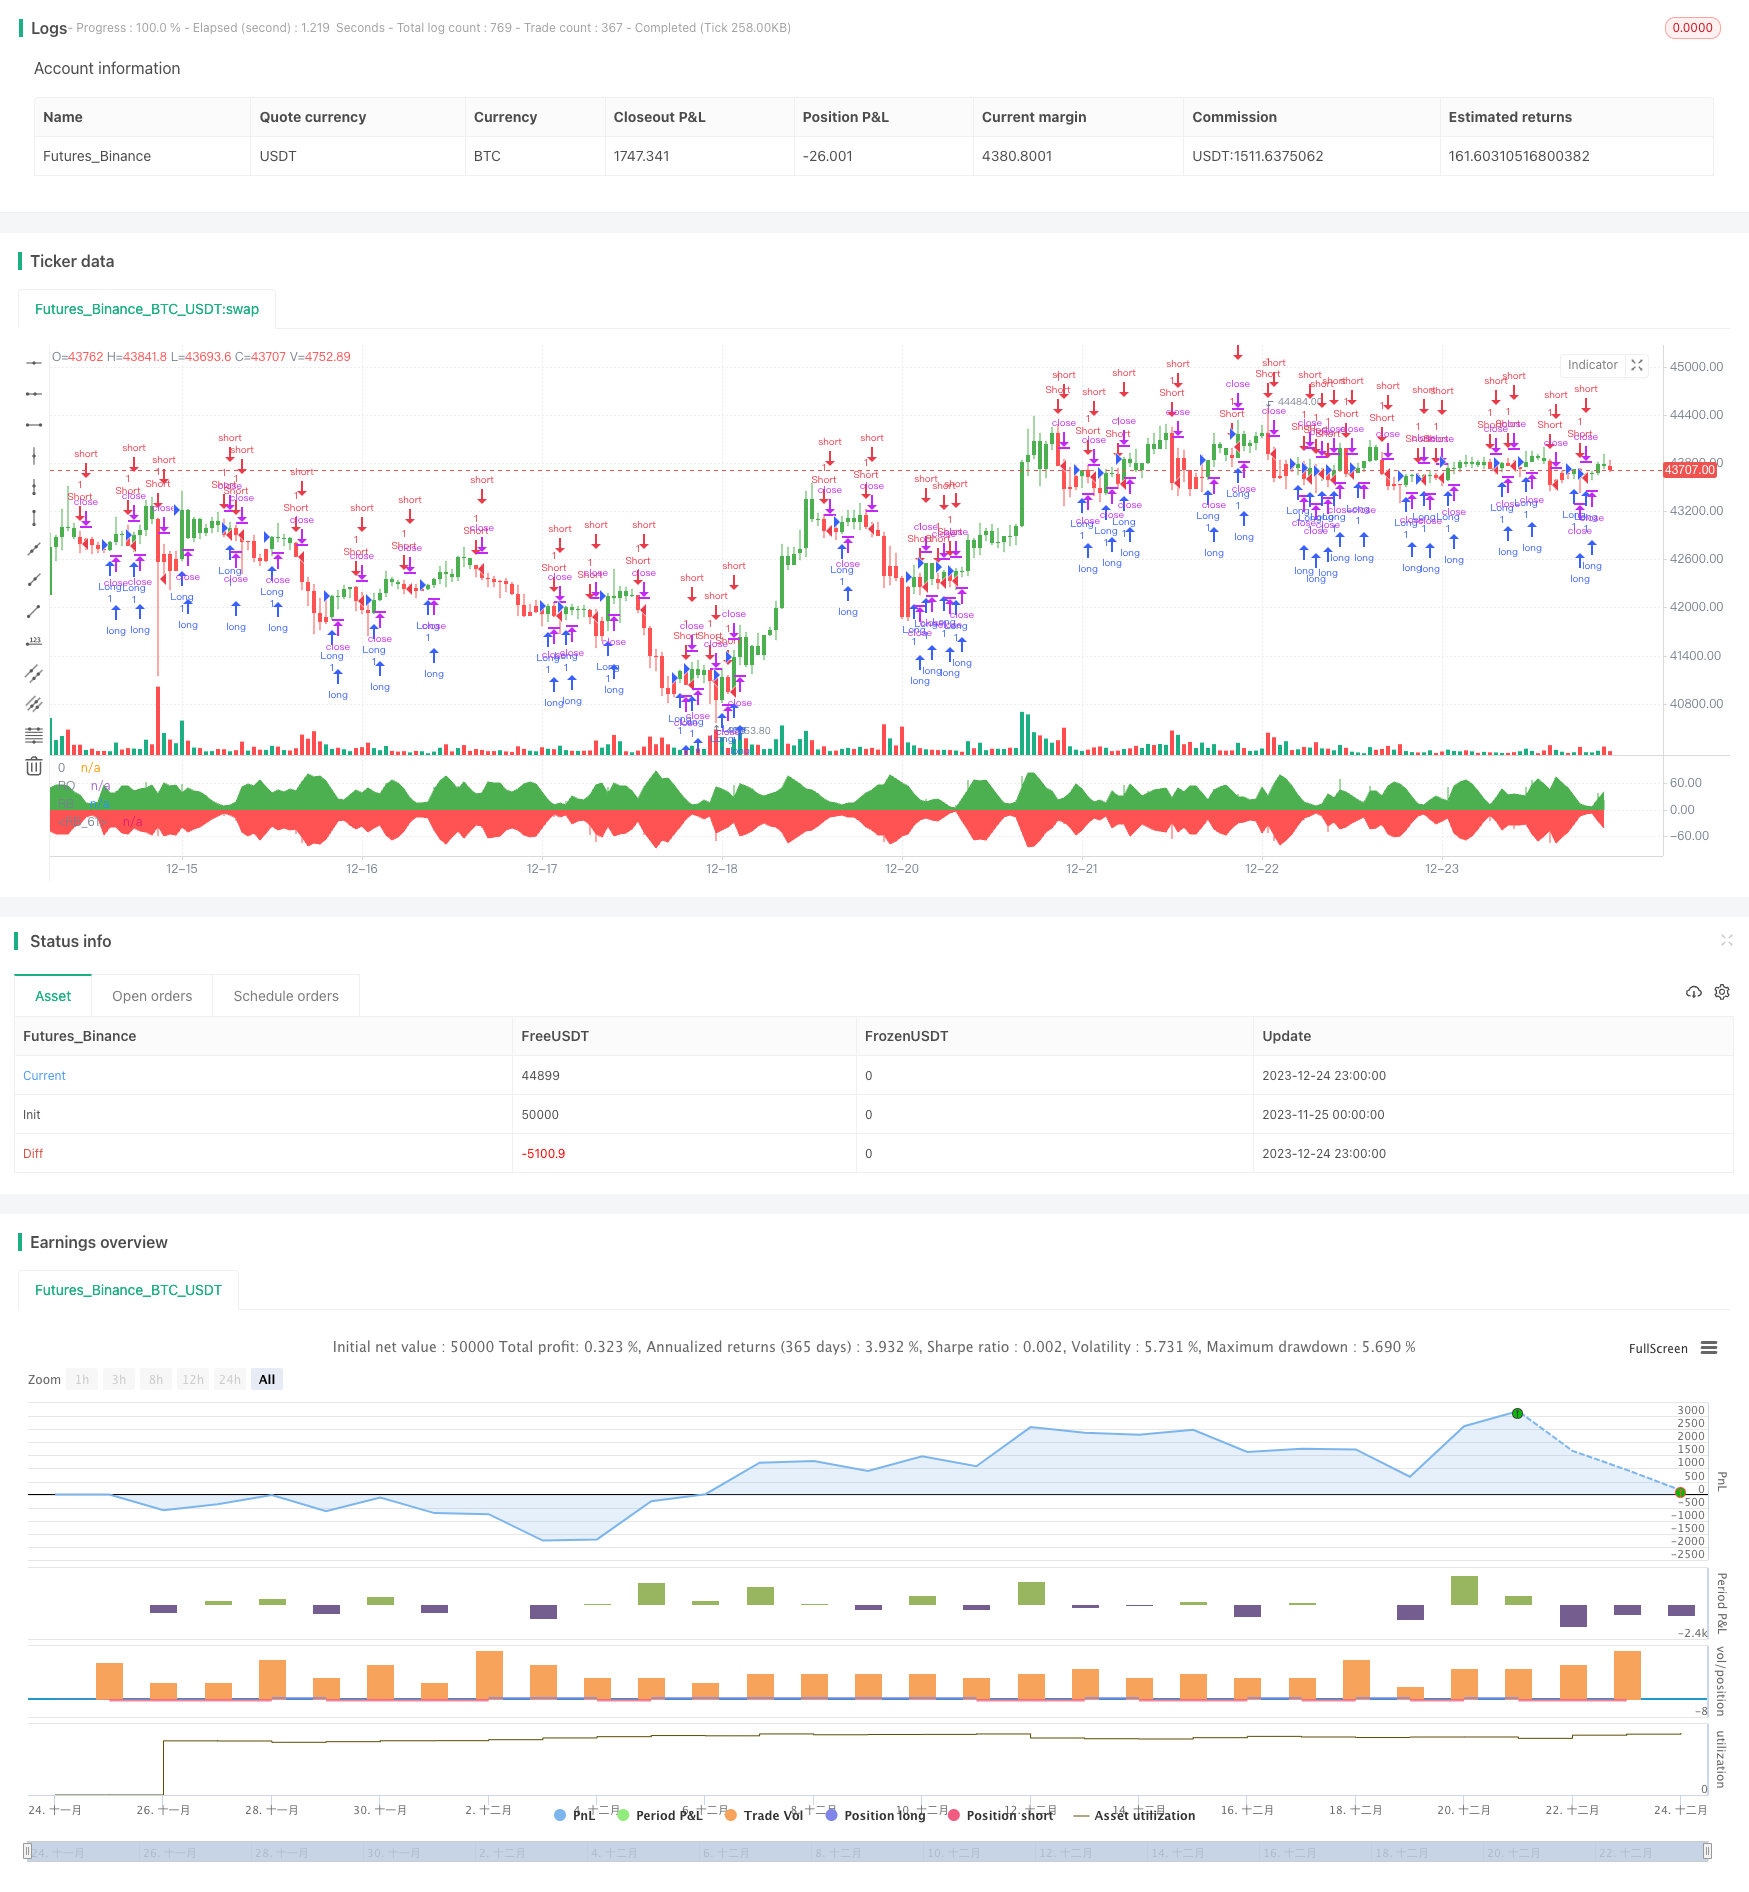
/*backtest
start: 2023-11-25 00:00:00
end: 2023-12-25 00:00:00
period: 1h
basePeriod: 15m
exchanges: [{"eid":"Futures_Binance","currency":"BTC_USDT"}]
*/

//@version=2
////////////////////////////////////////////////////////////
//  Copyright by HPotter v1.0 18/03/2018
// Ever since the people concluded that stock market price movements are not
// random or chaotic, but follow specific trends that can be forecasted, they
// tried to develop different tools or procedures that could help them identify
// those trends. And one of those financial indicators is the Rainbow Oscillator
// Indicator. The Rainbow Oscillator Indicator is relatively new, originally
// introduced in 1997, and it is used to forecast the changes of trend direction.
//
// As market prices go up and down, the oscillator appears as a direction of the
// trend, but also as the safety of the market and the depth of that trend. As
// the rainbow grows in width, the current trend gives signs of continuity, and
// if the value of the oscillator goes beyond 80, the market becomes more and more
// unstable, being prone to a sudden reversal. When prices move towards the rainbow
// and the oscillator becomes more and more flat, the market tends to remain more
// stable and the bandwidth decreases. Still, if the oscillator value goes below 20,
// the market is again, prone to sudden reversals. The safest bandwidth value where
// the market is stable is between 20 and 80, in the Rainbow Oscillator indicator value.
// The depth a certain price has on a chart and into the rainbow can be used to judge
// the strength of the move.
//
// You can change long to short in the Input Settings
// WARNING:
//  - For purpose educate only
//  - This script to change bars colors.
////////////////////////////////////////////////////////////
strategy(title="Rainbow Oscillator Backtest")
Length = input(2, minval=1)
LengthHHLL = input(10, minval=2, title="HHV/LLV Lookback")
reverse = input(false, title="Trade reverse")
xMA1 = sma(close, Length)
xMA2 = sma(xMA1, Length)
xMA3 = sma(xMA2, Length)
xMA4 = sma(xMA3, Length)
xMA5 = sma(xMA4, Length)
xMA6 = sma(xMA5, Length)
xMA7 = sma(xMA6, Length)
xMA8 = sma(xMA7, Length)
xMA9 = sma(xMA8, Length)
xMA10 = sma(xMA9, Length)
xHH = highest(close, LengthHHLL)
xLL = lowest(close, LengthHHLL)
xHHMAs = max(xMA1,max(xMA2,max(xMA3,max(xMA4,max(xMA5,max(xMA6,max(xMA7,max(xMA8,max(xMA9,xMA10)))))))))
xLLMAs = min(xMA1,min(xMA2,min(xMA3,min(xMA4,min(xMA5,min(xMA6,min(xMA7,min(xMA8,min(xMA9,xMA10)))))))))
xRBO = 100 * ((close - ((xMA1+xMA2+xMA3+xMA4+xMA5+xMA6+xMA7+xMA8+xMA9+xMA10) / 10)) / (xHH - xLL))
xRB = 100 * ((xHHMAs - xLLMAs) / (xHH - xLL))
clr = iff(xRBO >= 0, green, red)
pos = iff(xRBO > 0, 1,
       iff(xRBO < 0, -1, nz(pos[1], 0)))
possig = iff(reverse and pos == 1, -1,
          iff(reverse and pos == -1, 1, pos))
if (possig == 1)
    strategy.entry("Long", strategy.long)
if (possig == -1)
    strategy.entry("Short", strategy.short)
barcolor(possig == -1 ? red: possig == 1 ? green : blue )
plot(xRBO, color=clr, title="RO", style= histogram, linewidth=2)
p0 = plot(0, color = gray, title="0")
p1 = plot(xRB, color=green, title="RB")
p2 = plot(-xRB, color=red, title="RB")
fill(p1, p0, color=green)
fill(p2, p0, color=red)