Стратегия управления позицией на основе кривой капитала
Обзор стратегии
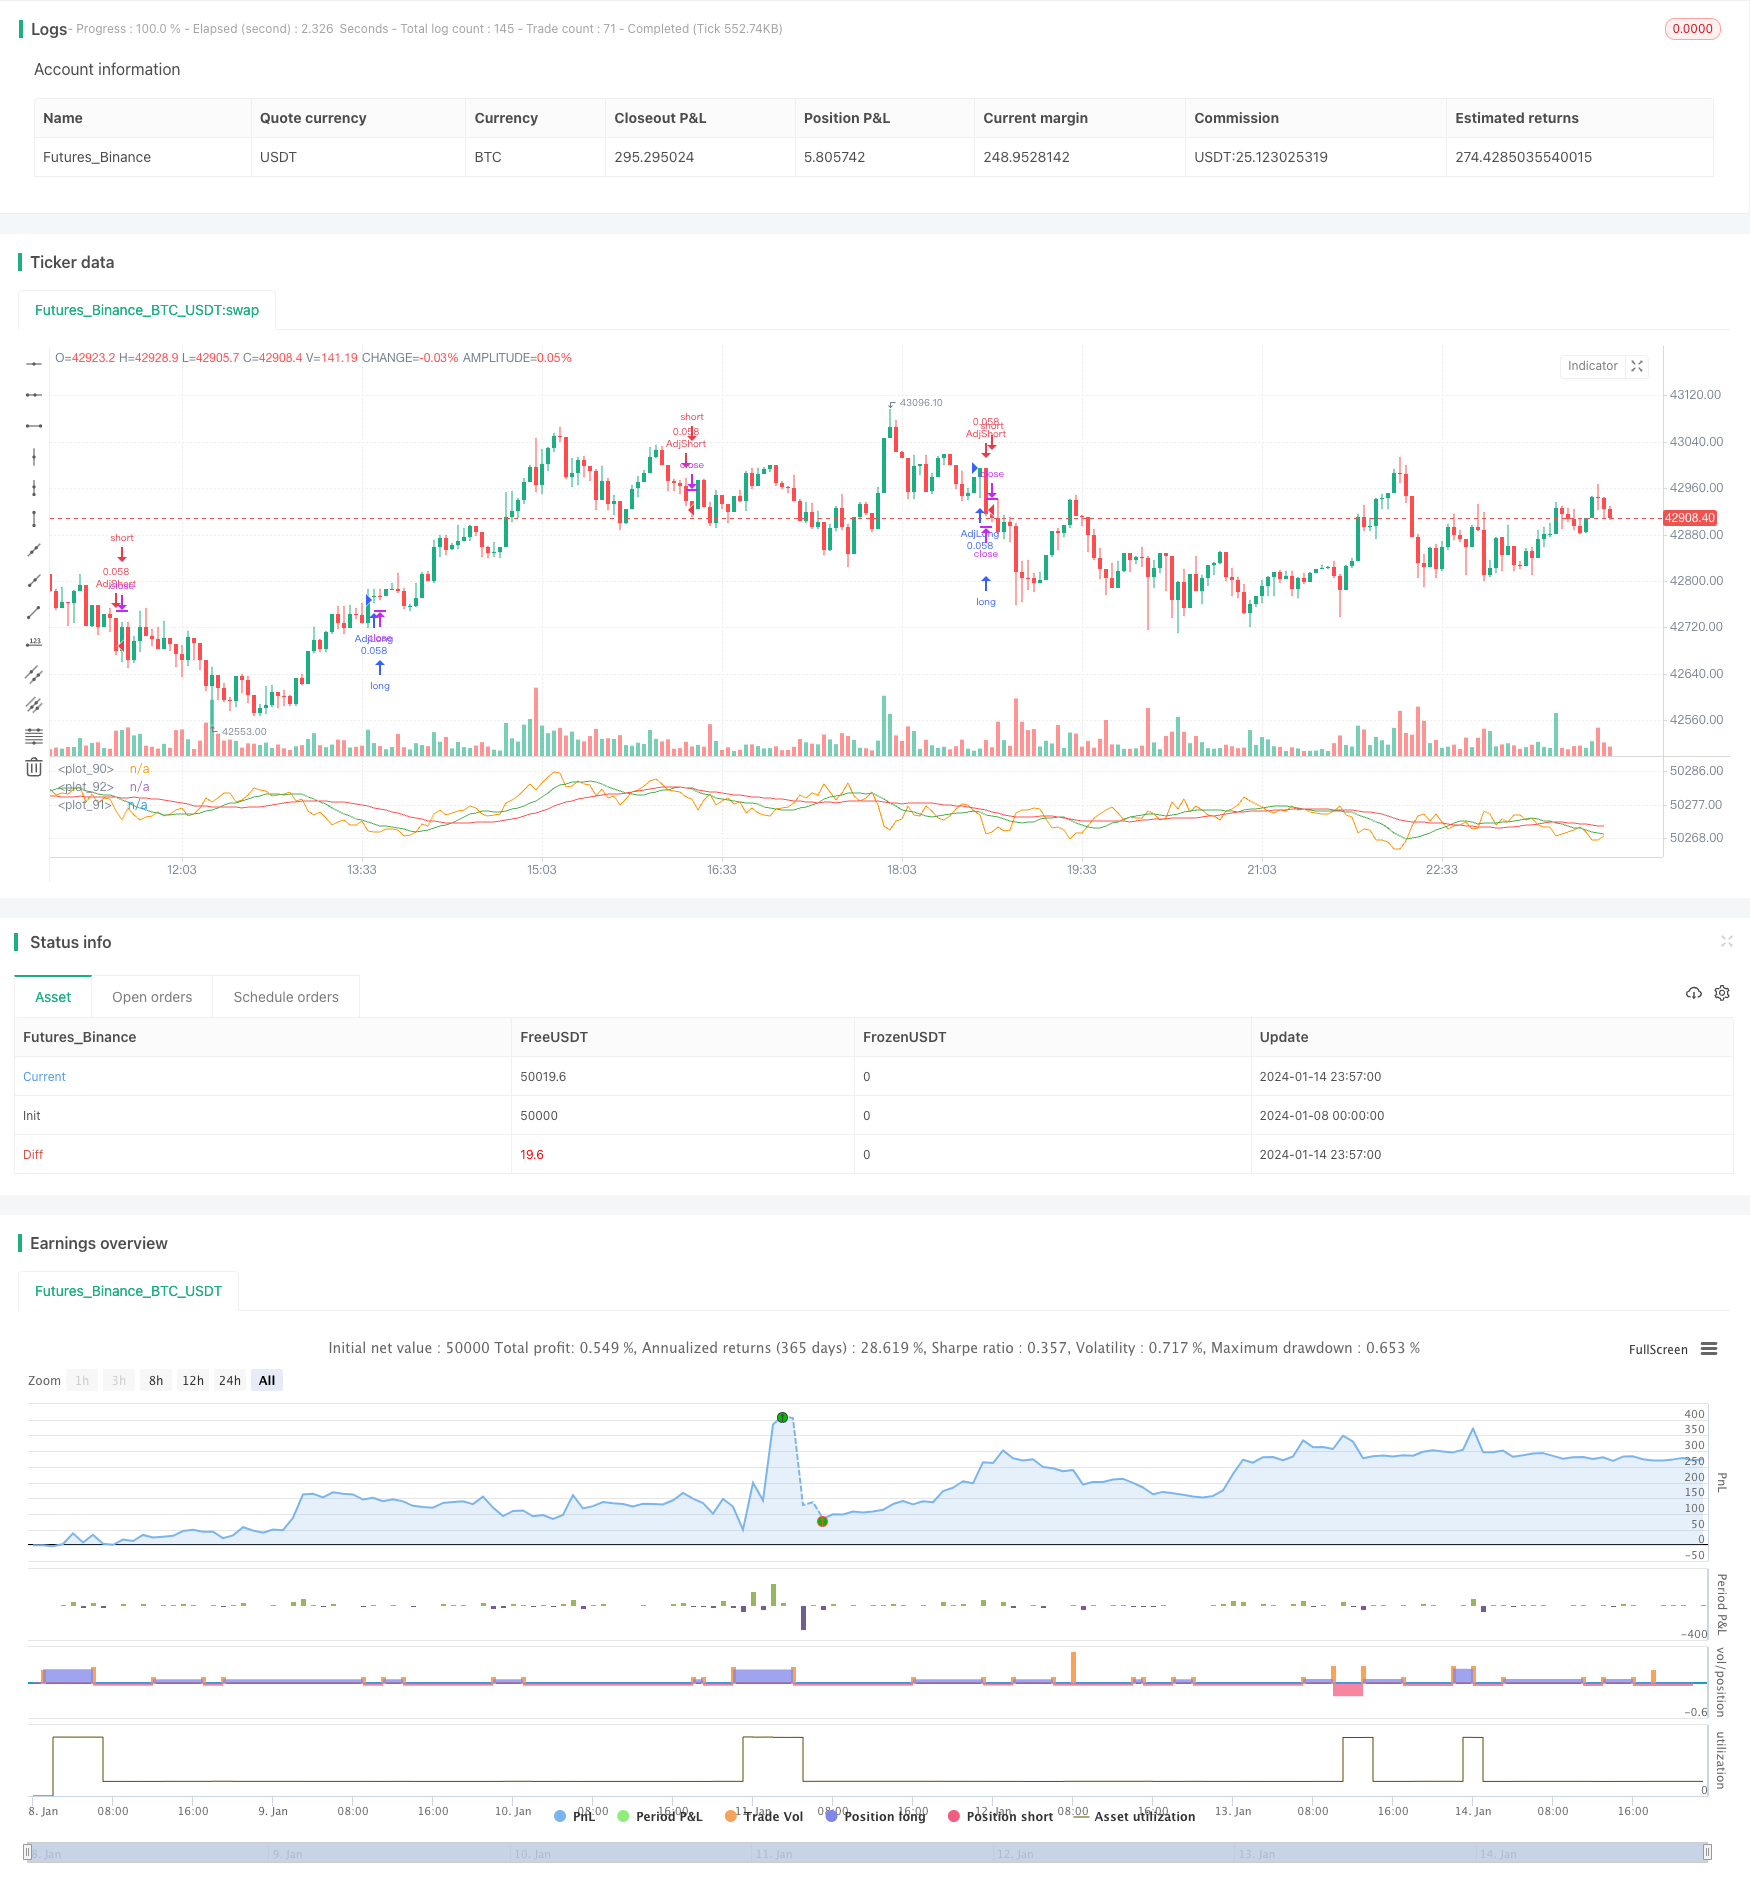
Основная идея этой стратегии заключается в том, чтобы динамически корректировать размер позиции в зависимости от движения кривой капитала, увеличивая позиции при прибыли и уменьшая позиции при убытках, чтобы контролировать общий риск. Эта стратегия одновременно сочетает в себе индикаторы динамики Chande, SuperTrend и Dynamic Indicator для идентификации торговых сигналов.
Стратегический принцип
Эта стратегия использует два способа определить, находится ли кривая капитала в нисходящем тренде: 1) рассчитывает быстрые и медленные простые движущиеся средние по кривой капитала, и если быстрый SMA ниже медленного SMA, то считается нисходящим; 2) рассчитывает простые движущиеся средние по кривой капитала с ее собственным более длительным периодом, и если кривая капитала ниже этой движущейся средней, то считается нисходящим.
При определении понижения кривой капитала позиция будет уменьшаться или увеличиваться в зависимости от установленной пропорции. Например, если установлено уменьшение на 50%, первоначальная позиция 10% будет уменьшена до 5% . Эта стратегия позволяет увеличить размер позиции при прибыли и уменьшить размер позиции при убытке, чтобы контролировать общий риск .
Стратегические преимущества
- Использование кривой капитала для оценки общей убыточности системы, динамическая корректировка позиций помогает контролировать риск
- Включение нескольких показателей для определения доступа повышает вероятность получения прибыли
- Настраиваемые параметры для корректировки позиции в соответствии с различными рисковыми предпочтениями
Стратегический риск
- Если вы увеличиваете позиции, вы увеличиваете и убытки.
- Неправильная параметровая настройка может привести к слишком радикальному изменению позиции
- Управление позициями не может полностью избежать системного риска
Оптимизация
- Тестирование эффективности параметров корректировки различных позиций
- Попытайтесь определить движение кривой по другим пакетам показателей.
- Оптимизация условий приема и повышение успеваемости
Подвести итог
Общая идея этой стратегии ясна, динамика корректировки позиций с использованием кривой капитала позволяет эффективно контролировать риск и заслуживает дальнейшего тестирования и оптимизации. Параметрная настройка и стратегия остановки убытков также требуют должного рассмотрения, чтобы избежать рисков, связанных с радикальными операциями.
/*backtest
start: 2024-01-08 00:00:00
end: 2024-01-15 00:00:00
period: 3m
basePeriod: 1m
exchanges: [{"eid":"Futures_Binance","currency":"BTC_USDT"}]
*/

// This source code is subject to the terms of the Mozilla Public License 2.0 at https://mozilla.org/MPL/2.0/
// © shardison
//@version=5

//EXPLANATION
//"Trading the equity curve" as a risk management method is the
//process of acting on trade signals depending on whether a system’s performance
//is indicating the strategy is in a profitable or losing phase.
//The point of managing equity curve is to minimize risk in trading when the equity curve is  in a downtrend.
//This strategy has two modes to determine the equity curve downtrend:
//By creating two simple moving averages of a portfolio's equity curve - a short-term
//and a longer-term one - and acting on their crossings. If the fast SMA is below
//the slow SMA, equity downtrend is detected (smafastequity < smaslowequity).
//The second method is by using the crossings of equity itself with the longer-period SMA (equity < smasloweequity).
//When "Reduce size by %" is active, the position size will be reduced by a specified percentage
//if the equity is "under water" according to a selected rule. If you're a risk seeker, select "Increase size by %"
//- for some robust systems, it could help overcome their small drawdowns quicker.

strategy("Use Trading the Equity Curve Postion Sizing", shorttitle="TEC", default_qty_type = strategy.percent_of_equity, default_qty_value = 10, initial_capital = 100000)

//TRADING THE EQUITY CURVE INPUTS
useTEC           = input.bool(true, title="Use Trading the Equity Curve Position Sizing")
defulttraderule  = useTEC ? false: true
initialsize      = input.float(defval=10.0, title="Initial % Equity")
slowequitylength = input.int(25, title="Slow SMA Period")
fastequitylength = input.int(9, title="Fast SMA Period")
seedequity = 100000 * .10
if strategy.equity == 0
    seedequity
else
    strategy.equity
slowequityseed   = strategy.equity > seedequity ? strategy.equity : seedequity
fastequityseed   = strategy.equity > seedequity ? strategy.equity : seedequity
smaslowequity    = ta.sma(slowequityseed, slowequitylength)
smafastequity    = ta.sma(fastequityseed, fastequitylength)
equitycalc       = input.bool(true, title="Use Fast/Slow Avg", tooltip="Fast Equity Avg is below Slow---otherwise if unchecked uses Slow Equity Avg below Equity")
sizeadjstring    = input.string("Reduce size by (%)", title="Position Size Adjustment", options=["Reduce size by (%)","Increase size by (%)"])
sizeadjint       = input.int(50, title="Increase/Decrease % Equity by:")
equitydowntrendavgs = smafastequity < smaslowequity
slowequitylessequity = strategy.equity < smaslowequity

equitymethod = equitycalc ? equitydowntrendavgs : slowequitylessequity

if sizeadjstring == ("Reduce size by (%)")
    sizeadjdown = initialsize * (1 - (sizeadjint/100))
else
    sizeadjup = initialsize * (1 + (sizeadjint/100))
c = close
qty = 100000 * (initialsize / 100) / c
if useTEC and equitymethod
    if sizeadjstring == "Reduce size by (%)"
        qty := (strategy.equity * (initialsize / 100) * (1 - (sizeadjint/100))) / c
    else
        qty := (strategy.equity * (initialsize / 100) * (1 + (sizeadjint/100))) / c

//EXAMPLE TRADING STRATEGY INPUTS
CMO_Length = input.int(defval=9, minval=1, title='Chande Momentum Length')
CMO_Signal = input.int(defval=10, minval=1, title='Chande Momentum Signal')

chandeMO = ta.cmo(close, CMO_Length)
cmosignal = ta.sma(chandeMO, CMO_Signal)

SuperTrend_atrPeriod = input.int(10, "SuperTrend ATR Length")
SuperTrend_Factor = input.float(3.0, "SuperTrend Factor", step = 0.01)
Momentum_Length = input.int(12, "Momentum Length")
price = close

mom0 = ta.mom(price, Momentum_Length)
mom1 = ta.mom( mom0, 1)
[supertrend, direction] = ta.supertrend(SuperTrend_Factor, SuperTrend_atrPeriod)
stupind = (direction < 0 ? supertrend : na)
stdownind = (direction < 0? na : supertrend)

//TRADING CONDITIONS
longConditiondefault = ta.crossover(chandeMO, cmosignal) and (mom0 > 0 and mom1 > 0 and close > stupind) and defulttraderule
if (longConditiondefault)
    strategy.entry("DefLong", strategy.long, qty=qty)

shortConditiondefault = ta.crossunder(chandeMO, cmosignal) and (mom0 < 0 and mom1 < 0 and close < stdownind) and defulttraderule
if (shortConditiondefault)
    strategy.entry("DefShort", strategy.short, qty=qty)

longCondition = ta.crossover(chandeMO, cmosignal) and (mom0 > 0 and mom1 > 0 and close > stupind) and useTEC
if (longCondition)
    strategy.entry("AdjLong", strategy.long, qty = qty)

shortCondition = ta.crossunder(chandeMO, cmosignal) and (mom0 < 0 and mom1 < 0 and close < stdownind) and useTEC
if (shortCondition)
    strategy.entry("AdjShort", strategy.short, qty = qty)
plot(strategy.equity)
plot(smaslowequity, color=color.new(color.red, 0))
plot(smafastequity, color=color.new(color.green, 0))