Chiến lược theo xu hướng động lượng

1
Follow
1779
Followers
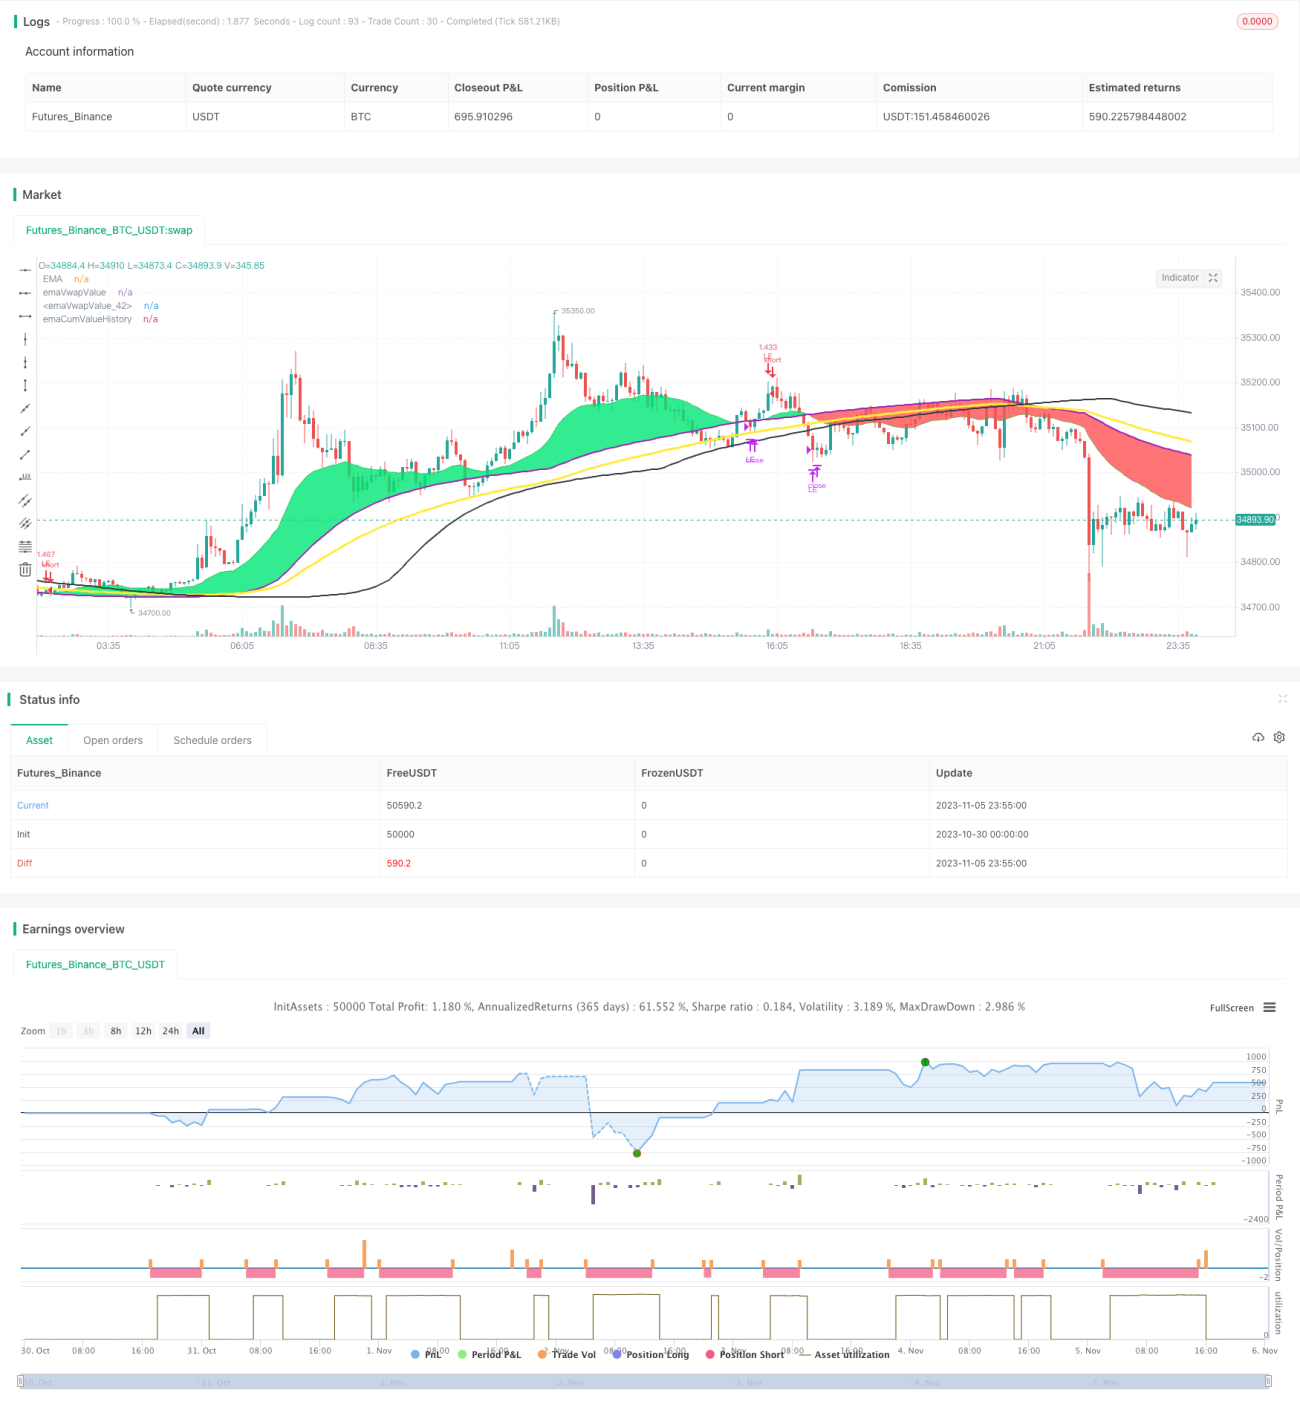
Tổng quan
Chiến lược này dựa trên phân tích xu hướng của trung bình di chuyển và khối lượng giao dịch, thiết lập chỉ số động lượng và thực hiện giao dịch theo xu hướng.
Nguyên tắc chiến lược
- Tính EMA trung bình của giá đóng và EMA trung bình tích lũy của khối lượng giao dịch
- Khi gần trên đeo EMA đánh giá là xu hướng tăng lên, thực hiện thao tác đa đầu
- Khi tiếp tục tăng, đóng cửa trên đường trung bình 2 lần của EMA tích lũy, thêm nhiều vị trí
- Thiết lập chỉ số RSI, khi RSI vượt quá 90 thì giảm 1/3 lệnh và kết thúc
- Khi Close vượt qua EMA, đánh giá là xu hướng giảm và xóa tất cả các vị trí đầu nhiều
- Khi Close vượt qua EMA, đánh giá là xu hướng giảm, thực hiện giao dịch tháo gỡ
- Thiết lập một đường dừng lỗ, đường dừng là một phần trăm cố định của giá nhập
- Tiếp theo, bạn có thể sử dụng các công cụ khác nhau để tạo ra các kết quả.
Phân tích lợi thế
Những lợi thế chính của chiến lược này là:
- Sử dụng đường trung bình EMA để đánh giá xu hướng, có thể theo dõi xu hướng hiệu quả
- Sử dụng EMA tích lũy của khối lượng giao dịch để đánh giá sự thay đổi xu hướng thực sự
- Theo dõi chỉ số động lực RSI để kiếm lợi nhuận
- Kiểm soát rủi ro, có đường dừng lỗ
- Các tham số có thể được điều chỉnh linh hoạt để phù hợp với các tình huống khác nhau
Phân tích rủi ro
Những rủi ro chính của chiến lược này là:
- EMA trung bình tạo ra sự chậm trễ, có thể bỏ lỡ điểm biến
- Số lượng giao dịch không nhất thiết phản ánh xu hướng thực tế
- Lãi suất dừng cố định có thể quá cơ khí
- Có quá nhiều tham số, rất khó để điều chỉnh.
- Giao dịch thường xuyên, chi phí giao dịch cao
Những giải pháp rủi ro:
- Tối ưu hóa các tham số EMA, giảm sự chậm trễ
- Giao dịch tín hiệu xác nhận kết hợp với các chỉ số khác
- Tối ưu hóa điểm dừng lỗ theo tình hình thị trường
- Giảm thiểu các tham số, chỉ giữ lại các thiết lập chính
- Giới hạn hạn lỗ hổng và tần suất giao dịch thích hợp
Hướng tối ưu hóa
Chiến lược này có thể được tối ưu hóa theo các khía cạnh sau:
- Kiểm tra các thiết lập tham số EMA khác nhau để tìm ra sự kết hợp tối ưu
- Tăng VOLUME nhân để xác định tín hiệu nhập vào mạnh hoặc yếu
- Kết hợp các chỉ số khác như MACD, KD và xác nhận nhập học
- Tối ưu hóa tỷ lệ dừng lỗ theo đặc điểm của một cổ phiếu cụ thể
- Tối ưu hóa tần số giao dịch, giảm phí giao dịch
Tóm tắt
Chiến lược này nói chung là một chiến lược theo dõi xu hướng dựa trên hệ thống đường bằng. Ý tưởng cốt lõi là sử dụng EMA để xác định hướng xu hướng và kết hợp với chỉ số động lực VOLUME để xác nhận nhập. Có thể được tối ưu hóa liên tục thông qua tối ưu hóa tham số và hỗ trợ các chỉ số khác để xác nhận thêm. Nói chung là một chiến lược theo dõi xu hướng linh hoạt, có thể thu được lợi nhuận tốt sau khi sử dụng khéo léo.
Source
Pine
Strategy parameters
Related strategies
Comment
All comments (0)
No data
- 1