
Chiến lược giao dịch định lượng theo dõi xu hướng. Chiến lược này sử dụng cơ chế hai đường dẫn để xác định xu hướng thị trường, kết hợp với tín hiệu giao nhau bằng đường thẳng. Cụ thể, chiến lược sử dụng các đường trung bình của các chu kỳ khác nhau để xây dựng hai đường dẫn, xác định xu hướng bằng cách phá vỡ giá lên đường hoặc xuống đường; sau đó kết hợp với tín hiệu giao nhau bằng đường thẳng nhanh và chậm để lọc thời gian vào thị trường.
Chiến lược vượt qua đường hai đường bằng đường chéo bao gồm:
Mô-đun đánh giá xu hướng: Sử dụng đường trung bình chu kỳ khác nhau để xây dựng hai đường ray, giá phá vỡ đường ray trên được đánh giá là xu hướng tăng, phá vỡ đường ray dưới được đánh giá là xu hướng giảm.
Mô-đun nhập học: Đường trung bình trên đường trung bình nhanh hơn, đường trung bình dài hơn, và đường dưới trống hơn. Đồng thời cần phải đánh giá hướng xu hướng.
Mô-đun xuất hiện: nhanh trung bình dưới đường đi qua đường dài trung bình khi bằng phẳng.
Chiến lược đầu tiên sử dụng tham số Trend Required để thiết lập cường độ xu hướng cần được đánh giá. Khi giá phá vỡ đường lên hoặc đường xuống, nó được đánh giá là xu hướng được hình thành. Sau đó, khi đường trung bình nhanh vượt qua đường trung bình dài trên đường trung bình nhanh, hãy tham gia nhiều; khi đường trung bình nhanh vượt qua đường trung bình dài dưới đường trung bình dài, hãy tham gia.
Ngoài ra, các chiến lược cũng có các mô-đun dừng lỗ và dừng. Các tham số cụ thể có thể được điều chỉnh và tối ưu hóa để kiểm soát rủi ro và lợi nhuận.
So với chiến lược đơn đường hoặc đơn đường trung bình, chiến lược chéo đường trung bình phá vỡ hai đường tích hợp sự phán đoán xu hướng và lựa chọn thời gian nhập cảnh, có thể nắm bắt nhịp độ thị trường tốt hơn. Các lợi thế cụ thể là:
Thiết lập hai đường ray cho phép bạn đánh giá xu hướng chính xác hơn và tránh bỏ lỡ cơ hội.
Bộ lọc chéo ngang có thể làm giảm khả năng phá vỡ giả để hoạt động ngược hướng.
Có thể điều chỉnh thông qua các tham số để tối ưu hóa rủi ro và lợi nhuận.
Lập luận của chiến lược đơn giản, rõ ràng, dễ hiểu, dễ theo dõi.
Chiến lược giao tuyến song song song song song song song song song cũng có một số rủi ro, đặc biệt là:
Thiết lập đường hai không hoàn toàn tránh được khả năng đánh giá sai xu hướng.
Thiết lập tham số đường trung bình không chính xác có thể dẫn đến tần suất giao dịch quá cao hoặc hoạt động ngược.
Cài đặt điểm dừng quá lỏng lẻo, không thể kiểm soát hiệu quả tổn thất đơn lẻ.
Các giải pháp tương ứng là:
Điều chỉnh tham số hai đường ray, giải phóng thích hợp phạm vi phán đoán đột phá.
Tối ưu hóa danh mục chu kỳ trung bình để đảm bảo tần suất giao dịch hợp lý.
Kiểm tra các mức điểm dừng khác nhau để tìm các tham số tối ưu.
Một số hướng tối ưu hóa khác của chiến lược giao tuyến song tuyến vượt qua hai đường ray là:
Kiểm tra các tham số chu kỳ trung bình khác nhau để tìm ra sự kết hợp tối ưu.
Cố gắng thêm nhiều dòng đồng nhất, xây dựng hệ thống lọc nhiều dòng đồng nhất.
Kiểm tra các thuật toán dừng lỗ khác nhau, chẳng hạn như dừng theo dõi, dừng rung, v.v.
Tham gia cơ chế trả lại, tối ưu hóa hiệu quả sử dụng vốn.
Bộ lọc kết hợp với các chỉ số khác, chẳng hạn như băng Brin, KDJ, v.v.
Chiến lược chéo tuyến tính vượt qua hai đường đua tổng hợp xem xét phán đoán xu hướng và lựa chọn thời gian nhập cảnh, có thể nắm bắt nhịp độ thị trường hiệu quả. Chiến lược này có tính năng phán đoán chính xác hơn, lọc tốt hơn so với chỉ số đơn lẻ. Bằng cách tối ưu hóa tham số và nâng cấp mô-đun, có khả năng tăng thêm sự ổn định và lợi nhuận của chiến lược.
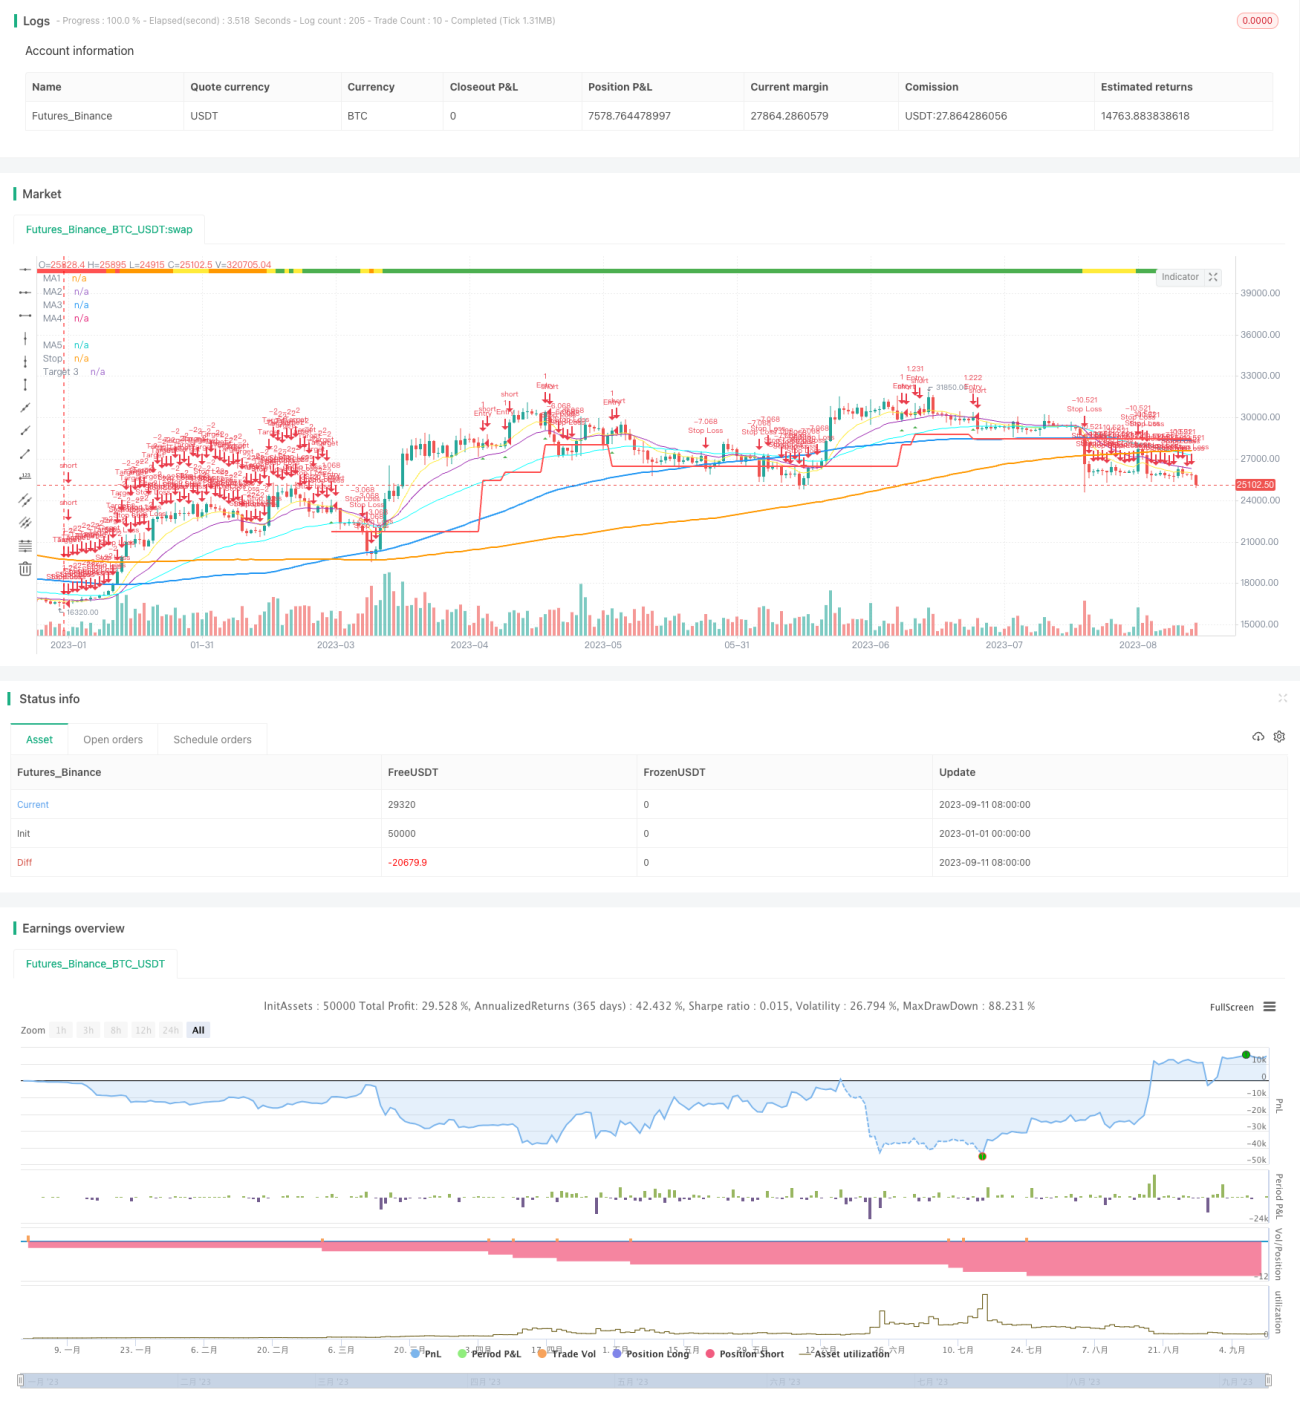
/*backtest
start: 2023-01-01 00:00:00
end: 2023-09-12 00:00:00
period: 1d
basePeriod: 1h
exchanges: [{"eid":"Futures_Binance","currency":"BTC_USDT"}]
*/
//@version=4
//Author = Dustin Drummond https://www.tradingview.com/u/Dustin_D_RLT/
//Strategy based in part on original 10ema Basic Swing Trade Strategy by Matt Delong: https://www.tradingview.com/u/MattDeLong/
//Link to original 10ema Basic Swing Trade Strategy: https://www.tradingview.com/script/8yhGnGCM-10ema-Basic-Swing-Trade-Strategy/
//This is the Original EMAC - Exponential Moving Average Cross Strategy built as a class for reallifetrading dot com and so has all the default settings and has not been optimized
//I would not recomend using this strategy with the default settings and is for educational purposes only
//For the fully optimized version please come back around the same time tomorrow 6/16/21 for the EMAC - Exponential Moving Average Cross - Optimized
//EMAC - Exponential Moving Average Cross
strategy(title="EMAC - Exponential Moving Average Cross", shorttitle = "EMAC", overlay = true, calc_on_every_tick=false, default_qty_value = 100, initial_capital = 100000, default_qty_type = strategy.fixed, pyramiding = 0, process_orders_on_close=true)
//creates a time filter to prevent "too many orders error" and allows user to see Strategy results per year by changing input in settings in Stratey Tester
startYear = input(2015, title="Start Year", minval=1980, step=1)
timeFilter = (year >= startYear) and (month >= 1) and (dayofmonth >= 1)
//R Size (Risk Amount)
rStaticOrPercent = input(title="R Static or Percent", defval="Static", options=["Static", "Percent"])
rSizeStatic = input(2000, title="R Size Static", minval=1, step=100)
rSizePercent = input(3, title="R Size Percent", minval=.01, step=.01)
rSize = rStaticOrPercent == "Static" ? rSizeStatic : rStaticOrPercent == "Percent" ? (rSizePercent * .01 * strategy.equity) : 1
//Recent Trend Indicator "See the standalone version for detailed description"
res = input(title="Trend Timeframe", type=input.resolution, defval="W")
trend = input(26, minval=1, title="# of Bars for Trend")
trendMult = input(15, minval=0, title="Trend Growth %", step=.25) / 100
currentClose = security(syminfo.tickerid, res, close)
pastClose = security(syminfo.tickerid, res, close[trend])
//Trend Indicator
upTrend = (currentClose >= (pastClose * (1 + trendMult)))
downTrend = (currentClose <= (pastClose * (1 - trendMult)))
sidewaysUpTrend = (currentClose < (pastClose * (1 + trendMult)) and (currentClose > pastClose))
sidewaysDownTrend = (currentClose > (pastClose * (1 - trendMult)) and (currentClose < pastClose))
//Plot Trend on Chart
plotshape(upTrend, "Up Trend", style=shape.square, location=location.top, color=color.green, size=size.small)
plotshape(downTrend, "Down Trend", style=shape.square, location=location.top, color=color.red, size=size.small)
plotshape(sidewaysUpTrend, "Sideways Up Trend", style=shape.square, location=location.top, color=color.yellow, size=size.small)
plotshape(sidewaysDownTrend, "Sideways Down Trend", style=shape.square, location=location.top, color=color.orange, size=size.small)
//What trend signals to use in entrySignal
trendRequired = input(title="Trend Required", defval="Orange", options=["Green", "Yellow", "Orange", "Red"])
goTrend = trendRequired == "Orange" ? upTrend or sidewaysUpTrend or sidewaysDownTrend : trendRequired == "Yellow" ? upTrend or sidewaysUpTrend : trendRequired == "Green" ? upTrend : trendRequired == "Red" ? upTrend or sidewaysUpTrend or sidewaysDownTrend or downTrend : na
//MAs Inputs Defalt is 10 EMA, 20 EMA, 50 EMA, 100 SMA and 200 SMA
ma1Length = input(10, title="MA1 Period", minval=1, step=1)
ma1Type = input(title="MA1 Type", defval="EMA", options=["SMA", "EMA", "WMA"])
ma2Length = input(20, title="MA2 Period", minval=1, step=1)
ma2Type = input(title="MA2 Type", defval="EMA", options=["SMA", "EMA", "WMA"])
ma3Length = input(50, title="MA3 Period", minval=1, step=1)
ma3Type = input(title="MA3 Type", defval="EMA", options=["SMA", "EMA", "WMA"])
ma4Length = input(100, title="MA4 Period", minval=1, step=1)
ma4Type = input(title="MA4 Type", defval="SMA", options=["SMA", "EMA", "WMA"])
ma5Length = input(200, title="MA5 Period", minval=1, step=1)
ma5Type = input(title="MA5 Type", defval="SMA", options=["SMA", "EMA", "WMA"])
//MAs defined
ma1 = ma1Type == "EMA" ? ema(close, ma1Length) : ma1Type == "SMA" ? sma(close, ma1Length) : wma(close, ma1Length)
ma2 = ma2Type == "EMA" ? ema(close, ma2Length) : ma2Type == "SMA" ? sma(close, ma2Length) : wma(close, ma2Length)
ma3 = ma3Type == "EMA" ? ema(close, ma3Length) : ma3Type == "SMA" ? sma(close, ma3Length) : wma(close, ma3Length)
ma4 = ma4Type == "SMA" ? sma(close, ma4Length) : ma4Type == "EMA" ? ema(close, ma4Length) : wma(close, ma4Length)
ma5 = ma5Type == "SMA" ? sma(close, ma5Length) : ma5Type == "EMA" ? ema(close, ma5Length) : wma(close, ma5Length)
//Plot MAs
plot(ma1, title="MA1", color=color.yellow, linewidth=1, style=plot.style_line)
plot(ma2, title="MA2", color=color.purple, linewidth=1, style=plot.style_line)
plot(ma3, title="MA3", color=#00FFFF, linewidth=1, style=plot.style_line)
plot(ma4, title="MA4", color=color.blue, linewidth=2, style=plot.style_line)
plot(ma5, title="MA5", color=color.orange, linewidth=2, style=plot.style_line)
//Allows user to toggle on/off ma1 > ma2 filter
enableShortMAs = input(title="Enable Short MA Cross Filter", defval="Yes", options=["Yes", "No"])
shortMACross = enableShortMAs == "Yes" and ma1 > ma2 or enableShortMAs == "No"
//Allows user to toggle on/off ma4 > ma5 filter
enableLongMAs = input(title="Enable Long MA Cross Filter", defval="Yes", options=["Yes", "No"])
longMACross = enableLongMAs == "Yes" and ma4 >= ma5 or enableLongMAs == "No"
//Entry Signals
entrySignal = (strategy.position_size <= 0 and close[1] < ma1[1] and close > ma1 and close > ma2 and close > ma3 and shortMACross and ma1 > ma3 and longMACross and goTrend)
secondSignal = (strategy.position_size > 0 and close[1] < ma1[1] and close > ma1 and close > ma2 and close > ma3 and shortMACross and ma1 > ma3 and longMACross and goTrend)
plotshape(entrySignal, style=shape.triangleup, location=location.belowbar, color=color.green, size=size.small)
plotshape(secondSignal, style=shape.triangleup, location=location.belowbar, color=color.lime, size=size.small)
//ATR for Stops
atrValue = (atr(14))
//to test ATR enable next line
//plot(atrValue, linewidth=1, color=color.black, style=plot.style_line)
atrMult = input(2.5, minval=.25, step=.25, title="Stop ATR Multiple")
//Only target3Mult is used in current strategy target1 and target2 might be used in the future with pyramiding
//target1Mult = input(1.0, minval=.25, step=.25, title="Targert 1 Multiple")
//target2Mult = input(2.0, minval=.25, step=.25, title="Targert 2 Multiple")
target3Mult = input(3.0, minval=.25, step=.25, title="Target Multiple")
enableAtrStop = input(title="Enable ATR Stops", defval="Yes", options=["Yes", "No"])
//Intitial Recomended Stop Location
atrStop = entrySignal and ((high - (atrMult * atrValue)) < low) ? (high - (atrMult * atrValue)) : low
//oneAtrStop is used for testing only enable next 2 lines to test
//oneAtrStop = entrySignal ? (high - atrValue) : na
//plot(oneAtrStop, "One ATR Stop", linewidth=2, color=color.orange, style=plot.style_linebr)
initialStop = entrySignal and enableAtrStop == "Yes" ? atrStop : entrySignal ? low : na
//Stops changed to stoploss to hold value for orders the next line is old code "bug"
//plot(initialStop, "Initial Stop", linewidth=2, color=color.red, style=plot.style_linebr)
//Set Initial Stop and hold value "debug code"
stoploss = valuewhen(entrySignal, initialStop, 0)
plot(stoploss, title="Stop", linewidth=2, color=color.red)
enableStops = input(title="Enable Stops", defval="Yes", options=["Yes", "No"])
yesStops = enableStops == "Yes" ? 1 : enableStops == "No" ? 0 : na
//Calculate size of trade based on R Size
//Original buggy code:
//positionSize = (rSize/(close - initialStop))
//Added a minimum order size of 1 "debug code"
positionSize = (rSize/(close - initialStop)) > 1 ? (rSize/(close - initialStop)) : 1
//Targets
//Enable or Disable Targets
enableTargets = input(title="Enable Targets", defval="Yes", options=["Yes", "No"])
yesTargets = enableTargets == "Yes" ? 1 : enableTargets == "No" ? 0 : na
//Only target3 is used in current strategy target1 and target2 might be used in the future with pyramiding
//target1 = entrySignal ? (close + ((close - initialStop) * target1Mult)) : na
//target2 = entrySignal ? (close + ((close - initialStop) * target2Mult)) : na
target3 = entrySignal ? (close + ((close - initialStop) * target3Mult)) : na
//plot(target1, "Target 1", linewidth=2, color=color.green, style=plot.style_linebr)
//plot(target2, "Target 2", linewidth=2, color=color.green, style=plot.style_linebr)
plot(target3, "Target 3", linewidth=2, color=color.green, style=plot.style_linebr)
//Set Target and hold value "debug code"
t3 = valuewhen(entrySignal, target3, 0)
//To test t3 and see plot enable next line
//plot(t3, title="Target", linewidth=2, color=color.green)
//MA1 Cross Exit
enableEarlyExit = input(title="Enable Early Exit", defval="Yes", options=["Yes", "No"])
earlyExit = enableEarlyExit == "Yes" ? 1 : enableEarlyExit == "No" ? 0 : na
ma1CrossExit = strategy.position_size > 0 and close < ma1
//Entry Order
strategy.order("Entry", long = true, qty = positionSize, when = (strategy.position_size <= 0 and entrySignal and timeFilter))
//Early Exit Order
strategy.close_all(when = ma1CrossExit and timeFilter and earlyExit, comment = "MA1 Cross Exit")
//Stop and Target Orders
//strategy.cancel orders are needed to prevent bug with Early Exit Order
strategy.order("Stop Loss", false, qty = strategy.position_size, stop=stoploss, oca_name="Exit",when = timeFilter and yesStops, comment = "Stop Loss")
strategy.cancel("Stop Loss", when = ma1CrossExit and timeFilter and earlyExit)
strategy.order("Target", false, qty = strategy.position_size, limit=t3, oca_name="Exit", when = timeFilter and yesTargets, comment = "Target")
strategy.cancel("Target", when = ma1CrossExit and timeFilter and earlyExit)