Chiến lược điểm then chốt trong giao dịch trong ngày

Tổng quan
Đây là một chiến lược điểm quan trọng trong giao dịch trong ngày của Ấn Độ, chủ yếu sử dụng giá mở, giá cao nhất, giá thấp nhất và giá đóng để tính toán các điểm hỗ trợ và kháng cự quan trọng và giao dịch khi giá phá vỡ tại các điểm này.
Nguyên tắc chiến lược
- Tính toán giá cao nhất, giá thấp nhất và giá đóng cửa của ngày giao dịch trước
- Tính toán điểm hỗ trợ chính S1, điểm kháng cự R1 và điểm quan trọng PP theo công thức
- Khi giá vượt qua các điểm quan trọng này, hãy tham gia vào các vị trí mua hoặc bán
- Thiết lập cơ chế rút lui
Công thức tính toán các điểm quan trọng chính như sau:
PP = (最高价+最低价+收盘价)/3
R1 = 2*PP - 最低价
S1 = 2*PP - 最高价
Phân tích lợi thế
- Sử dụng các điểm mấu chốt để tạo ra các lỗ hổng có khả năng cao, tăng cơ hội lợi nhuận
- Điểm mấu chốt dễ xác định, quy tắc giao dịch rõ ràng
- Điểm dừng lỗ dễ thiết lập, kiểm soát rủi ro hiệu quả
Phân tích rủi ro
- Các điểm mấu chốt có thể bị phá vỡ và gây thiệt hại
- Các điểm mấu chốt cần được xác minh và không phải lúc nào cũng có hiệu quả.
- Cài đặt điểm dừng không đúng có thể làm tăng tổn thất
Phương pháp giải quyết rủi ro:
- combining with other indicators to filter false breakouts
- backtesting to validate strategy over long timeframes
- optimize stop loss placement
Hướng tối ưu hóa
- Kết hợp với các chỉ số kỹ thuật khác để lọc tín hiệu đột phá giả
- Tối ưu hóa các tham số cho các giống khác nhau
- Động lực điều chỉnh điểm dừng
Tóm tắt
Chiến lược này nói chung là đơn giản, trực tiếp, dễ dàng xác minh hiệu quả thông qua dữ liệu lịch sử. Là một chiến lược giao dịch trong ngày, nó sử dụng các điểm quan trọng để cung cấp một lỗ hổng có xác suất cao, có thể đạt được hiệu quả tốt. Tuy nhiên, do phụ thuộc vào các điểm quan trọng, cũng có một số rủi ro phá vỡ giả, cần được tối ưu hóa hơn nữa để giảm. Nói chung, đây là một chiến lược giao dịch trong ngày dễ thực hiện, có thể kiểm soát rủi ro.
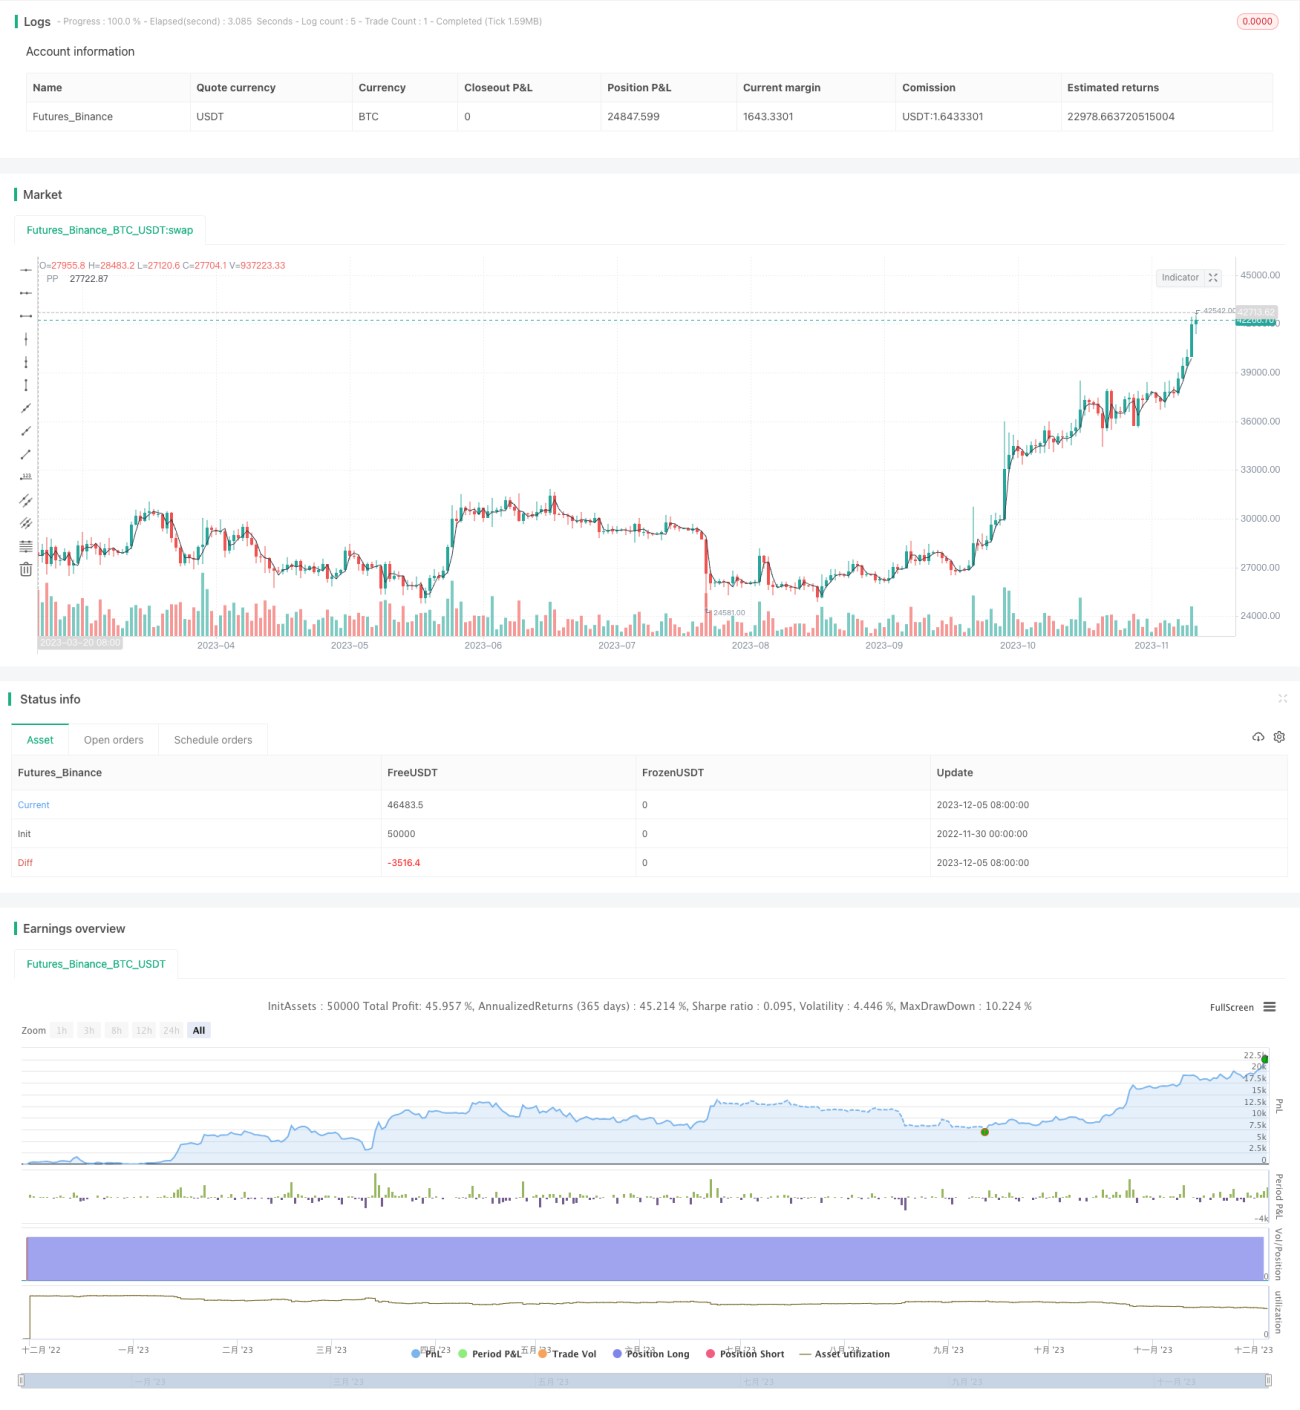
/*backtest
start: 2022-11-30 00:00:00
end: 2023-12-06 00:00:00
period: 1d
basePeriod: 1h
exchanges: [{"eid":"Futures_Binance","currency":"BTC_USDT"}]
*/

// This source code is subject to the terms of the Mozilla Public License 2.0 at https://mozilla.org/MPL/2.0/
// © arameshraju
//Reference credit goes to All
- 1