Chiến lược bom nhấn chìm siêu xu hướng


Ngày tạo: 2023-12-08 15:40:26 sửa đổi lần cuối: 2023-12-08 15:40:26
sao chép: 0 Số nhấp chuột: 708
1
tập trung vào
1621
Người theo dõi

Chiến lược bom nhấn chìm siêu xu hướng

Tổng quan

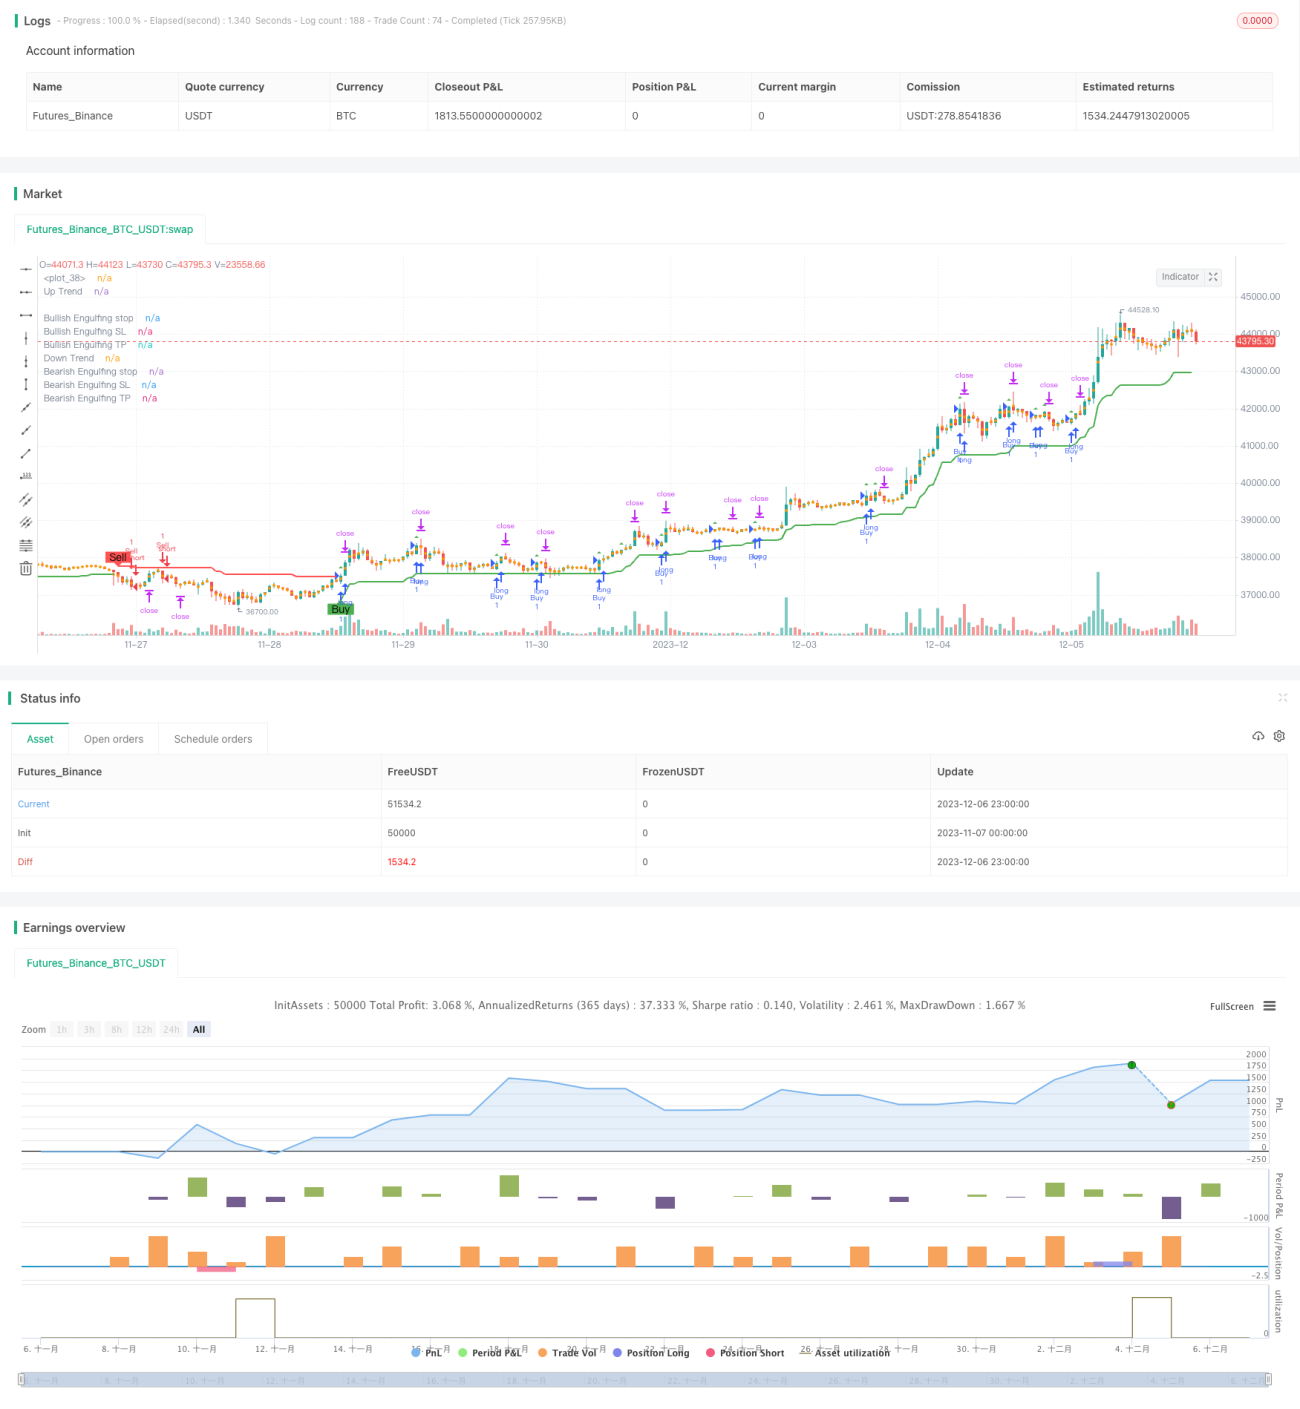
Chiến lược bùng nổ tiêu thụ quá xu hướng là một chiến lược theo dõi xu hướng kết hợp với chiều trung bình của sóng thực (ATR), chỉ số quá xu hướng và hình dạng tiêu thụ để xác định xu hướng và tìm kiếm cơ hội nhập cảnh có tỷ lệ thuận lợi trong khi xác nhận xu hướng của hình dạng tiêu thụ.

Nguyên tắc chiến lược

Chiến lược này đầu tiên sử dụng ATR và chỉ số siêu xu hướng để xác định hướng xu hướng thị trường hiện tại. Cụ thể, nó được định nghĩa là xu hướng giảm khi giá thấp hơn đường lên và xu hướng tăng khi giá cao hơn đường xuống.

Trong một xu hướng tăng, K-line sẽ đóng cửa ở mức cao hơn K-line mở cửa và K-line đóng cửa ở mức thấp hơn K-line mở cửa. Trong một xu hướng giảm, K-line đóng cửa ở mức thấp hơn K-line mở cửa và K-line đóng cửa ở mức cao hơn K-line mở cửa.

Khi hình thức ăn uống phù hợp với hướng xu hướng, tín hiệu giao dịch sẽ được tạo ra. Ngoài ra, chiến lược cũng sẽ tính toán giá dừng và giá dừng dựa trên hình thức ăn uống. Sau khi tham gia, nếu giá chạm vào giá dừng hoặc giá dừng, thì sẽ thoát khỏi vị trí hiện tại.

Phân tích lợi thế

Chiến lược này kết hợp lợi thế của theo dõi xu hướng và nhận dạng hình dạng, có thể nhận ra tín hiệu đảo ngược trong xu hướng, do đó có thể bắt được xu hướng lớn hơn tại các điểm biến đổi của thị trường. Ngoài ra, cơ chế dừng lỗ cũng có thể kiểm soát hiệu quả rủi ro mất mát.

Phân tích rủi ro

Rủi ro lớn nhất của chiến lược này là hình thức nuốt có thể bị phá vỡ, do đó tạo ra tín hiệu sai. Ngoài ra, các thiết lập dừng và dừng có thể quá tùy tiện, không thể đạt được cân bằng lợi nhuận.

Hướng tối ưu hóa

Các tham số ATR có thể được tối ưu hóa trong thời gian thực để nắm bắt tốt hơn sự thay đổi của biến động thị trường. Ngoài ra, các chỉ số khác cũng có thể được nghiên cứu để xác định xu hướng và tiếp tục cải thiện sự ổn định của chiến lược.

Tóm tắt

Chiến lược bùng nổ tiêu thụ xu hướng vượt trội kết hợp lợi thế của theo dõi xu hướng và nhận dạng hình dạng, chiến lược tiêu thụ hình dạng như một tín hiệu đảo ngược, có thể đạt được hiệu quả cao hơn tại các điểm biến đổi thị trường. Tuy nhiên, chiến lược này cũng có một số rủi ro tín hiệu giả, cần được kiểm tra và tối ưu hóa hơn để kiểm soát rủi ro.

Mã nguồn chiến lược
/*backtest
start: 2023-11-07 00:00:00
end: 2023-12-07 00:00:00
period: 1h
basePeriod: 15m
exchanges: [{"eid":"Futures_Binance","currency":"BTC_USDT"}]
*/

// This source code is subject to the terms of the Mozilla Public License 2.0 at https://mozilla.org/MPL/2.0/
// © Armanhammer

//@version=5
strategy("Engulfing with Trend", overlay=true)

Periods = input.int(title="ATR Period", defval=10)
src = input(hl2, title="Source")
Multiplier = input.float(title="ATR Multiplier", step=0.1, defval=3.0)
changeATR= input.bool(title="Change ATR Calculation Method ?", defval=true)
showsignals = input.bool(title="Show Buy/Sell Signals ?", defval=true)
highlighting = input.bool(title="Highlighter On/Off ?", defval=true)

atr2 = ta.sma(src, Periods)
atr= changeATR ? ta.atr(Periods) : atr2

up=src-(Multiplier*atr)
up1 = nz(up[1],up)
up := close[1] > up1 ? math.max(up,up1) : up
dn=src+(Multiplier*atr)
dn1 = nz(dn[1], dn)
dn := close[1] < dn1 ? math.min(dn, dn1) : dn

var trend = 1
trend := nz(trend[1], trend)
trend := trend == -1 and close > dn1 ? 1 : trend == 1 and close < up1 ? -1 : trend

upPlot = plot(trend == 1 ? up : na, title="Up Trend", style=plot.style_linebr, linewidth=2, color=color.green)
buySignal = trend == 1 and trend[1] == -1
plotshape(buySignal and showsignals ? up : na, title="Buy", style=shape.labelup, location=location.absolute, color=color.new(color.green, 0), text="Buy")
//plotshape(buySignal ? up : na, title="UpTrend Begins", location=location.absolute, style=shape.circle, size=size.tiny, color=color.green, transp=0)
//plotshape(buySignal and showsignals ? up : na, title="Buy", text="Buy", location=location.absolute, style=shape.labelup, size=size.tiny, color=color.green, textcolor=color.white, transp=0)
dnPlot = plot(trend == 1 ? na : dn, title="Down Trend", style=plot.style_linebr, linewidth=2, color=color.red)
sellSignal = trend == -1 and trend[1] == 1
plotshape(sellSignal and showsignals ? dn : na, title="Sell", style=shape.labeldown, location=location.absolute, color=color.new(color.red, 0), text="Sell")
//plotshape(sellSignal ? dn : na, title="DownTrend Begins", location=location.absolute, style=shape.circle, size=size.tiny, color=color.red, transp=0)
//plotshape(sellSignal and showsignals ? dn : na, title="Sell", text="Sell", location=location.absolute, style=shape.labeldown, size=size.tiny, color=color.red, textcolor=color.white, transp=0)
mPlot = plot(ohlc4, title="", style=plot.style_circles, linewidth=0)
longFillColor = highlighting and trend == 1 ? color.new(color.green, 0) : na
shortFillColor = highlighting and trend == -1 ? color.new(color.red, 0) : na
fill(upPlot, dnPlot, color=longFillColor)
fill(dnPlot, upPlot, color=shortFillColor)
alertcondition(buySignal, title="SuperTrend Buy", message="SuperTrend Buy!")
alertcondition(sellSignal, title="SuperTrend Sell", message="SuperTrend Sell!")
changeCond = trend != trend[1]
alertcondition(changeCond, title="SuperTrend Direction Change", message="SuperTrend has changed direction!")

// Define Downtrend and Uptrend conditions
downtrend = trend == -1
uptrend = trend == 1


// Engulfing
boringThreshold = input.float(25, title="Boring Candle Threshold (%)", minval=1, maxval=100)
engulfingThreshold = input.float(50, title="Engulfing Candle Threshold (%)", minval=1, maxval=100)
stopLevel = input.int(200, title="Stop Level (Pips)", minval=1)

// Boring Candle (Inside Bar) and Engulfing Candlestick Conditions
isBoringCandle = math.abs(open[1] - close[1]) * 100 / math.abs(high[1] - low[1]) <= boringThreshold
isEngulfingCandle = math.abs(open - close) * 100 / math.abs(high - low) <= engulfingThreshold

// Bullish and Bearish Engulfing Conditions
bullEngulfing = uptrend and close[1] < open[1] and close > open[1] and not isBoringCandle and not isEngulfingCandle
bearEngulfing = downtrend and close[1] > open[1] and close < open[1] and not isBoringCandle and not isEngulfingCandle

// Stop Loss, Take Profit, and Entry Price Calculation
bullStop = close + (stopLevel * syminfo.mintick)
bearStop = close - (stopLevel * syminfo.mintick)
bullSL = low 
bearSL = high
bullTP = bullStop + (bullStop - low)
bearTP = bearStop - (high - bearStop)

// Entry Conditions
enterLong = bullEngulfing and uptrend
enterShort = bearEngulfing and downtrend

// Exit Conditions
exitLong = ta.crossover(close, bullTP) or ta.crossover(close, bullSL)
exitShort = ta.crossover(close, bearTP) or ta.crossover(close, bearSL)

// Check if exit conditions are met by the next candle
exitLongNextCandle = exitLong and (ta.crossover(close[1], bullTP[1]) or ta.crossover(close[1], bullSL[1]))
exitShortNextCandle = exitShort and (ta.crossover(close[1], bearTP[1]) or ta.crossover(close[1], bearSL[1]))

// Strategy Execution
if enterLong
    strategy.entry("Buy", strategy.long)

if enterShort
    strategy.entry("Sell", strategy.short)

// Exit Conditions for Long (Buy) Positions
if bullEngulfing and not na(bullTP) and not na(bullSL)
    strategy.exit("Exit Long", from_entry="Buy", stop=bullSL, limit=bullTP)

// Exit Conditions for Short (Sell) Positions
if bearEngulfing and not na(bearTP) and not na(bearSL)
    strategy.exit("Exit Short", from_entry="Sell", stop=bearSL, limit=bearTP)


// Plot Shapes and Labels
plotshape(series=bullEngulfing, style=shape.triangleup, location=location.abovebar, color=color.green)
plotshape(series=bearEngulfing, style=shape.triangledown, location=location.abovebar, color=color.red)

// Determine OP, SL, and TP
plot(series=bullEngulfing ? bullStop : na, title="Bullish Engulfing stop", color=color.red, linewidth=3, style=plot.style_linebr)
plot(series=bearEngulfing ? bearStop : na, title="Bearish Engulfing stop", color=color.red, linewidth=3, style=plot.style_linebr)
plot(series=bullEngulfing ? bullSL : na, title="Bullish Engulfing SL", color=color.red, linewidth=3, style=plot.style_linebr)
plot(series=bearEngulfing ? bearSL : na, title="Bearish Engulfing SL", color=color.red, linewidth=3, style=plot.style_linebr)
plot(series=bullEngulfing ? bullTP : na, title="Bullish Engulfing TP", color=color.green, linewidth=3, style=plot.style_linebr)
plot(series=bearEngulfing ? bearTP : na, title="Bearish Engulfing TP", color=color.green, linewidth=3, style=plot.style_linebr)

// Create labels if the condition for bullEngulfing or bearEngulfing is met
//if bullEngulfing
   // label.new(x=bar_index, y=bullSL, text="SL: " + str.tostring(bullSL), color=color.red, textcolor=color.white, style=label.style_labelup, size=size.tiny)

//if bearEngulfing
   // label.new(x=bar_index, y=bearSL, text="SL: " + str.tostring(bearSL), color=color.red, textcolor=color.white, style=label.style_labeldown, size=size.tiny)

//if bullEngulfing
  //  label.new(x=bar_index, y=bullTP, text="TP: " + str.tostring(bullTP), color=color.green, textcolor=color.white, style=label.style_labeldown, size=size.tiny)

//if bearEngulfing
  //  label.new(x=bar_index, y=bearTP, text="TP: " + str.tostring(bearTP), color=color.green, textcolor=color.white, style=label.style_labelup, size=size.tiny)