MACD tuyến tính Mở khóa sự kỳ diệu của hồi quy tuyến tính trong TradingView

Tên chính sách: Chính sách MACD tuyến tính theo động lực
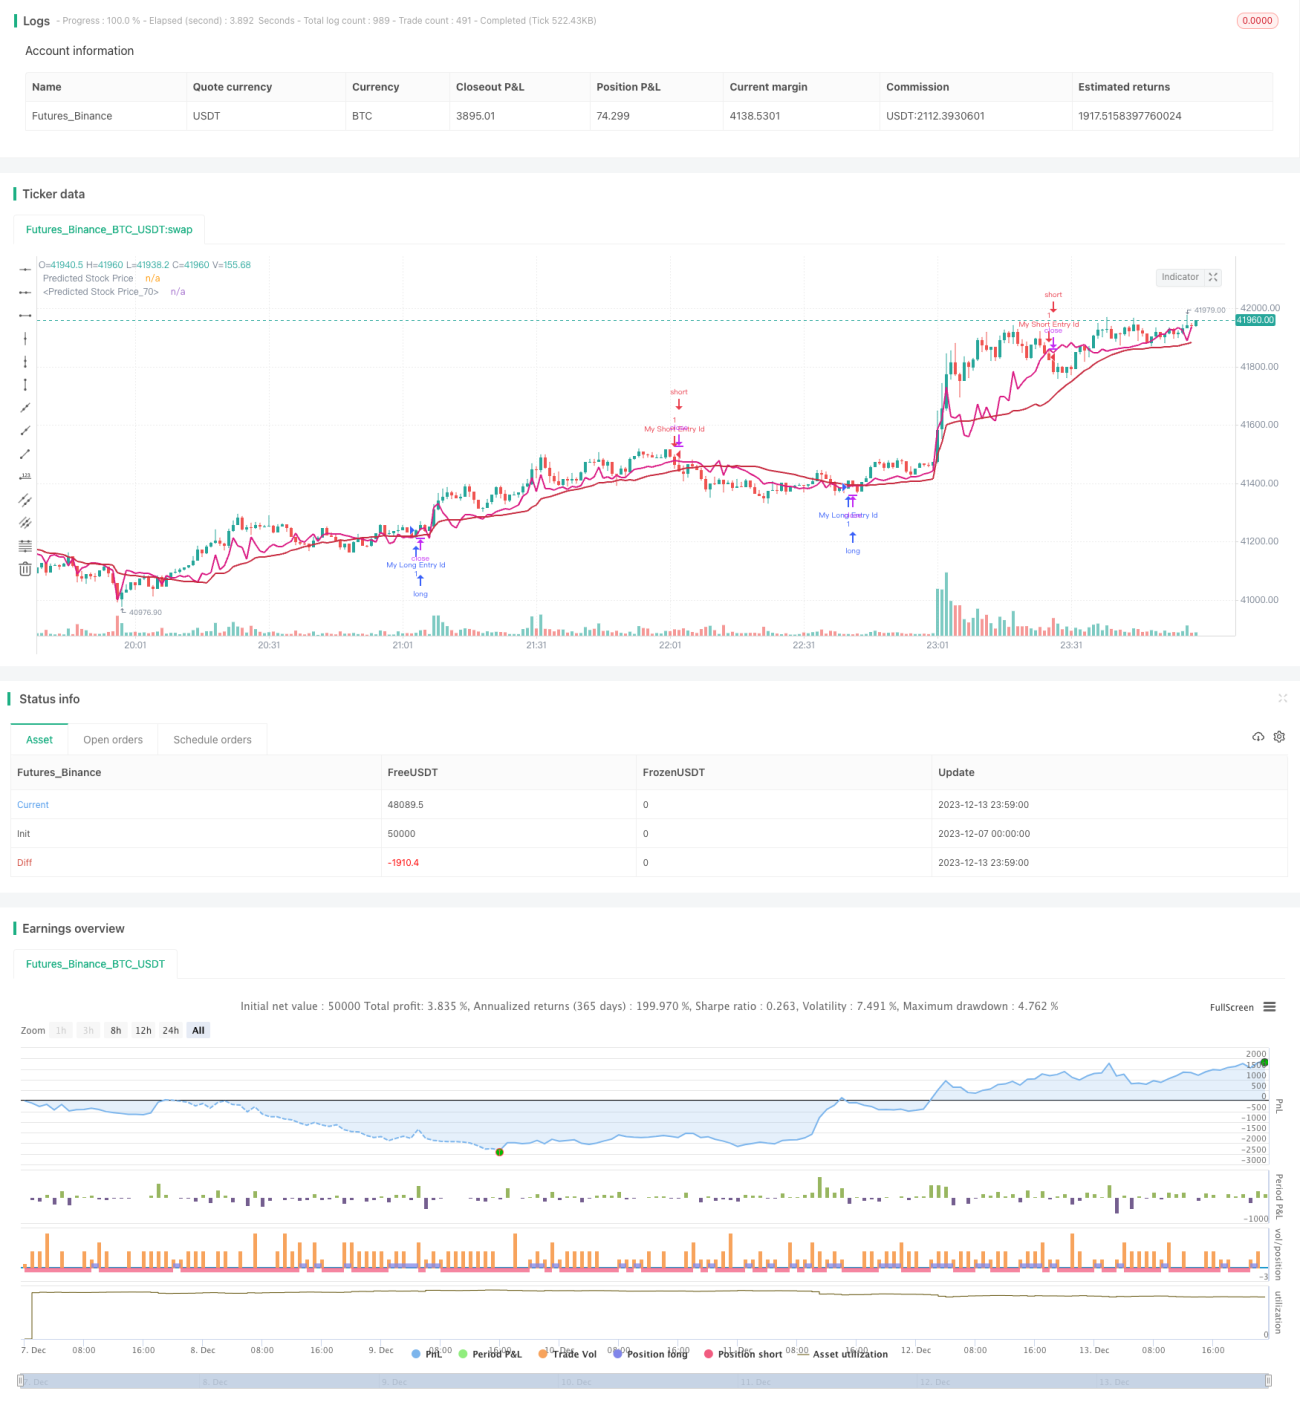
Tóm tắt: Đây là một chiến lược định lượng sử dụng hồi quy tuyến tính để dự đoán giá cổ phiếu và kết hợp với chỉ số MACD. Nó sử dụng hồi quy tuyến tính để phân tích giá cả và khối lượng giao dịch lịch sử để dự đoán xu hướng giá trong tương lai.
Nguyên tắc chiến lược:
- Tính toán hệ số hồi quy tuyến tính của giá: Phù hợp một đường hồi quy tuyến tính dựa trên khối lượng giao dịch lịch sử để dự đoán giá trong tương lai.
- Vẽ giá dự đoán: Vẽ đường dự đoán giá dựa trên hệ số hồi quy trong bước 1.
- Tạo tín hiệu mua: Tạo tín hiệu mua khi giá dự báo nằm giữa giá mở và giá đóng và MACD tăng lên.
- Tạo tín hiệu bán: Tạo tín hiệu bán khi MACD giảm và giá thấp hơn giá dự báo.
Phân tích lợi thế:
Đây là một chiến lược kết hợp giữa dự đoán thống kê và đánh giá chỉ số kỹ thuật. Nó sử dụng sự hồi phục tuyến tính để đưa ra dự đoán giá, tránh phỏng đoán chủ quan. Đồng thời, chỉ số MACD có thể đánh giá hiệu quả đường đi của thị trường và nắm bắt cơ hội chính xác.
Phân tích rủi ro:
Sự hồi phục tuyến tính chỉ phụ thuộc vào dữ liệu lịch sử, không nhạy cảm với các sự kiện bất ngờ như tin tức về lợi nhuận lớn và lỗ hổng, có thể tạo ra tín hiệu sai. Ngoài ra, cài đặt tham số như độ dài chu kỳ hồi phục cũng có thể ảnh hưởng đến hiệu suất chiến lược. Chúng tôi đề nghị sử dụng giá dự báo mịn vwma để giảm tác động của đường cong đối với chiến lược.
Định hướng tối ưu hóa:
Chúng tôi nghĩ rằng chiến lược này có thể được tối ưu hóa trong một số khía cạnh:
- Tham gia vào cơ chế dừng lỗ. Khi giá phá vỡ đường dừng lỗ, kiểm soát hiệu quả tổn thất do tín hiệu sai cá nhân.
- Nhập các mô hình học máy. Sử dụng các mô hình hiệu quả hơn để dự đoán xu hướng giá, nâng cao tính chính xác của chiến lược.
- Kết hợp với chỉ số cảm xúc. Tiếp tục giới thiệu các chỉ số cảm xúc như chỉ số sợ hãi thị trường, đánh giá bầu không khí mua bán thị trường, tăng tỷ lệ chiến lược.
- Kết hợp nhiều khung thời gian. Các dự báo về các chu kỳ thời gian khác nhau có thể xác nhận lẫn nhau, tạo ra chiến lược kết hợp, giảm giới hạn của một khung thời gian đơn.
Tóm lại:
Chiến lược này có lợi thế như: logic dự đoán rõ ràng, rủi ro có thể kiểm soát được, không gian tối ưu hóa rộng rãi. Chúng tôi tin rằng, thông qua tối ưu hóa và lặp đi lặp lại liên tục, hiệu suất của nó sẽ ngày càng tốt hơn. Nó cung cấp cho chúng tôi những suy nghĩ về giao dịch định lượng sử dụng phương pháp dự đoán khoa học, đáng để chúng tôi nghiên cứu và áp dụng sâu hơn.
- 1