Chiến lược giao dịch đảo ngược TD động lượng

Tổng quan
Chiến lược giao dịch biến động TD là một chiến lược giao dịch định lượng sử dụng chỉ số TD Sequential để xác định tín hiệu biến động giá. Chiến lược này dựa trên phân tích biến động giá, thiết lập vị trí mua hoặc bán sau khi xác nhận tín hiệu biến động giá.
Nguyên tắc chiến lược
Chiến lược này sử dụng chỉ số TD Sequential để phân tích biến động giá và xác định hình thức đảo ngược giá của 9 đường K liên tiếp. Cụ thể, khi xác định 9 đường K liên tiếp tăng giá và sau đó có đường K giảm giá, chiến lược đánh giá là cơ hội giảm giá. Ngược lại, khi xác định 9 đường K liên tiếp giảm giá và sau đó có đường K tăng giá, chiến lược đánh giá là nhiều cơ hội.
Sử dụng lợi thế của chỉ số TD Sequential, bạn có thể bắt được tín hiệu đảo ngược giá sớm. Kết hợp với một số cơ chế giết chết giảm theo dõi trong chiến lược này, bạn có thể thiết lập vị trí mua nhiều hoặc bán ngắn trong thời gian, sau khi tín hiệu đảo ngược được xác nhận, do đó có cơ hội nhập vào tốt hơn trong giai đoạn bắt đầu của sự đảo ngược giá.
Phân tích lợi thế
- Sử dụng chỉ số TD Sequential để đoán trước cơ hội biến động giá
- Thiết lập cơ chế theo dõi giảm giá để xác định giá sớm hơn
- Xây dựng cơ sở để có được điểm vào tốt hơn bằng cách đảo ngược giai đoạn hình thành
Phân tích rủi ro
- TD Sequential có thể bị phá vỡ và cần được xác nhận kết hợp với các yếu tố khác
- Cần kiểm soát đúng quy mô và thời gian vị trí để giảm rủi ro
Hướng tối ưu hóa
- Kết hợp với các chỉ số khác để xác định tín hiệu đảo ngược, tránh nguy cơ đột phá giả
- Thiết lập các cơ chế ngăn chặn để kiểm soát tổn thất đơn lẻ
- Tối ưu hóa quy mô và thời gian giữ vị trí, cân bằng quy mô lợi nhuận và kiểm soát rủi ro
Tóm tắt
Chiến lược giao dịch đảo ngược động lực TD là một chiến lược rất phù hợp cho các nhà giao dịch động lực. Chiến lược này có lợi thế trong việc xác định cơ hội đảo ngược, nhưng cần chú ý kiểm soát rủi ro để tránh thiệt hại lớn do phá vỡ giả.
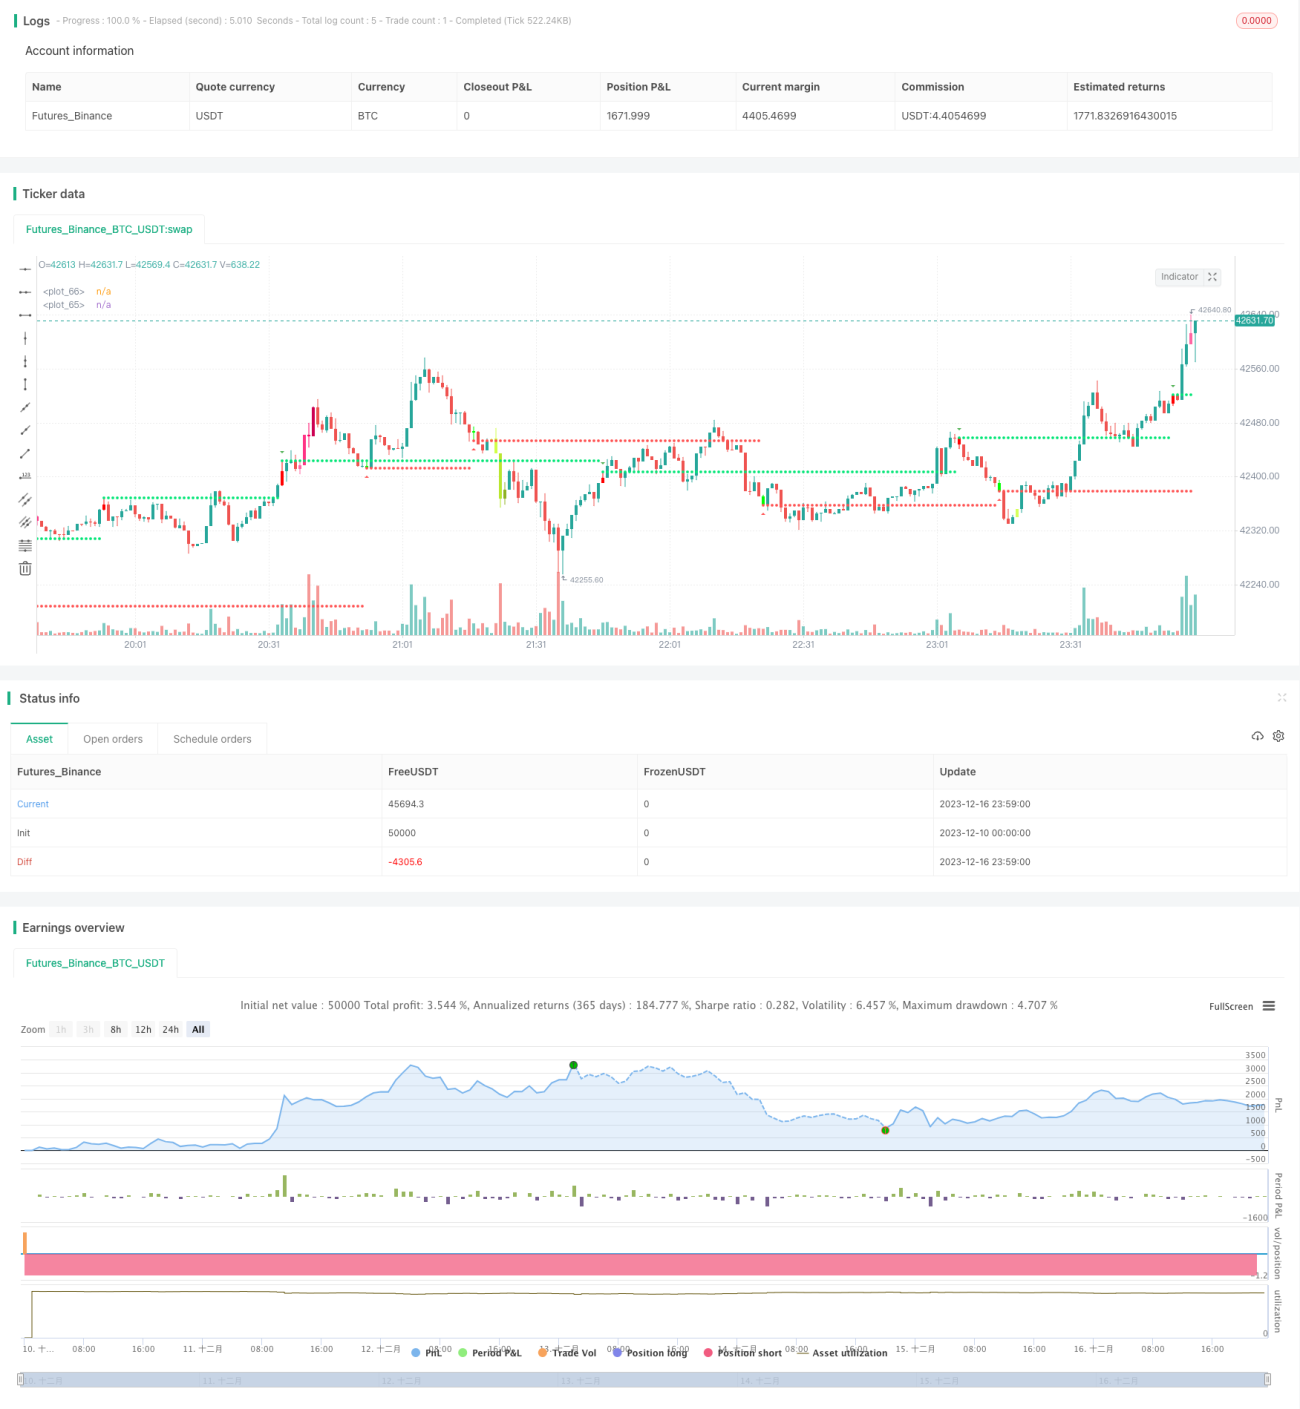
/*backtest
start: 2023-12-10 00:00:00
end: 2023-12-17 00:00:00
period: 1m
basePeriod: 1m
exchanges: [{"eid":"Futures_Binance","currency":"BTC_USDT"}]
*/

//@version=4
//This strategy is based on TD sequential study from glaz.
//I made some improvement and modification to comply with pine script version 4.
//Basically, it is a strategy based on proce action, supports and resistance.- 1