Chiến lược theo dõi xu hướng thép Bohr
Tổng quan
Chiến lược này thực hiện một chiến lược theo dõi xu hướng vững chắc dựa trên phân tích khối lượng giao dịch, moving averages và Boldenone. Chiến lược này được thiết kế để nắm bắt sự đảo ngược xu hướng tiềm năng và tận dụng động lực thị trường.
Nguyên tắc chiến lược
Dải thép Bohr
Sử dụng dây thép Boer để xác định tình trạng quá mua quá bán của thị trường. Quyết định hỗ trợ thông qua hình ảnh rõ ràng về đường ray lên xuống.
Nguyên tắc cơ bản của dây thép Bohr là tính toán đường đua lên xuống dựa trên giá cổ phiếu trung bình và chênh lệch chuẩn trong một chu kỳ nhất định. Giá cổ phiếu trên đường đua là tín hiệu mua quá mức, dưới đường đua là tín hiệu bán quá mức.
Bộ lọc trung bình di động
Thực hiện bộ lọc trung bình di chuyển để tăng cường nhận dạng xu hướng. Người dùng có thể chọn các loại trung bình di chuyển khác nhau, chẳng hạn như trung bình di chuyển đơn giản, trung bình di chuyển chỉ số và trung bình di chuyển trọng lượng.
Một tín hiệu mua và bán được tạo ra khi giá vượt qua hoặc vượt qua đường trung bình di chuyển.
Phân tích số lượng giao dịch
Cho phép người dùng tích hợp phân tích khối lượng giao dịch vào chiến lược để xác nhận tín hiệu. Cột khối lượng có màu khác nhau cho thấy khối lượng giao dịch cao hơn hoặc thấp hơn trung bình.
Số lượng giao dịch vượt mức trung bình có thể được sử dụng để xác nhận tín hiệu giá.
Phân tích lợi thế
Chiến lược theo dõi xu hướng mạnh mẽ
Xu hướng thị trường được xác định dựa trên các đường dây thép Bore, đường trung bình di chuyển và khối lượng giao dịch.
Có khả năng nắm bắt xu hướng giá và theo dõi xu hướng để kiếm lợi nhuận.
Tính linh hoạt và tùy chỉnh
Người dùng có thể lựa chọn các tham số và loại đường trung bình di chuyển để tối ưu hóa.
Các vị trí kho dài và kho trống có thể được kiểm soát riêng biệt.
Hình ảnh và xác nhận
Cơ chế tín hiệu kép, xác nhận tín hiệu giá thép Boolean thông qua đường trung bình di chuyển và khối lượng giao dịch.
Các tín hiệu giao dịch được hiển thị trực quan như đường trung bình di chuyển, đường dừng lỗ.
Quản lý rủi ro
Dựa trên ATR tính toán mức dừng lỗ. Có thể tùy chỉnh chu kỳ ATR và nhân ATR dừng lỗ.
Điều chỉnh kích thước vị trí tùy theo tỷ lệ rủi ro của vị trí. Kiểm soát hiệu quả lỗ đơn.
Phân tích rủi ro
Rủi ro của chu kỳ phản hồi
- Các chu kỳ lịch sử khác nhau có thể ảnh hưởng đến hiệu suất của chiến lược. Đánh giá lại trong các chu kỳ khác nhau để đảm bảo sự ổn định của chiến lược.
Rủi ro đảo ngược xu hướng
- Trong trường hợp xung đột, thường xuyên kích hoạt dừng lỗ. Bạn có thể giảm nguy cơ này bằng cách tối ưu hóa tham số trung bình di chuyển.
Rủi ro của quá tối ưu hóa
- Tối ưu hóa đa tham số có thể dẫn đến tối ưu hóa quá mức, nên sử dụng nhiều tập hợp tham số và kiểm tra độ ổn định.
Rủi ro về sự chậm trễ của chỉ số kỹ thuật
- Có một số chậm trễ trong việc tính toán chỉ số, nên kết hợp với sự phán đoán của các thực thể giá, không thể hoàn toàn dựa vào chỉ số.
Hướng tối ưu hóa
Tối ưu hóa tham số
- Tối ưu hóa các tham số thắt lưng Baer, loại trung bình di chuyển và tham số ATR để phù hợp với các giống và chu kỳ khác nhau.
Tối ưu hóa vị trí
- Kiểm tra mức độ rủi ro của các vị trí khác nhau và tối ưu hóa số lần dừng lỗ.
Tối ưu hóa tín hiệu
- Thử nghiệm thêm các chỉ số phụ trợ khác để lọc tín hiệu, chẳng hạn như KD, MACD, v.v.
Tối ưu hóa mã
- Tối ưu hóa logic phán đoán tín hiệu, giảm bớt việc mở cửa không cần thiết. Sử dụng lập trình hướng đối tượng để tăng khả năng mở rộng.
Tóm tắt
Chiến lược này tích hợp các dây thép Boolean, trung bình di chuyển và phân tích khối lượng giao dịch để xây dựng một hệ thống giao dịch cơ học theo dõi xu hướng. Ưu điểm của chiến lược là cơ chế xác nhận tín hiệu mạnh mẽ, rủi ro được kiểm soát. Tiếp theo, có thể cải thiện sự ổn định và lợi nhuận của chiến lược thông qua các tham số và tín hiệu tối ưu hóa.
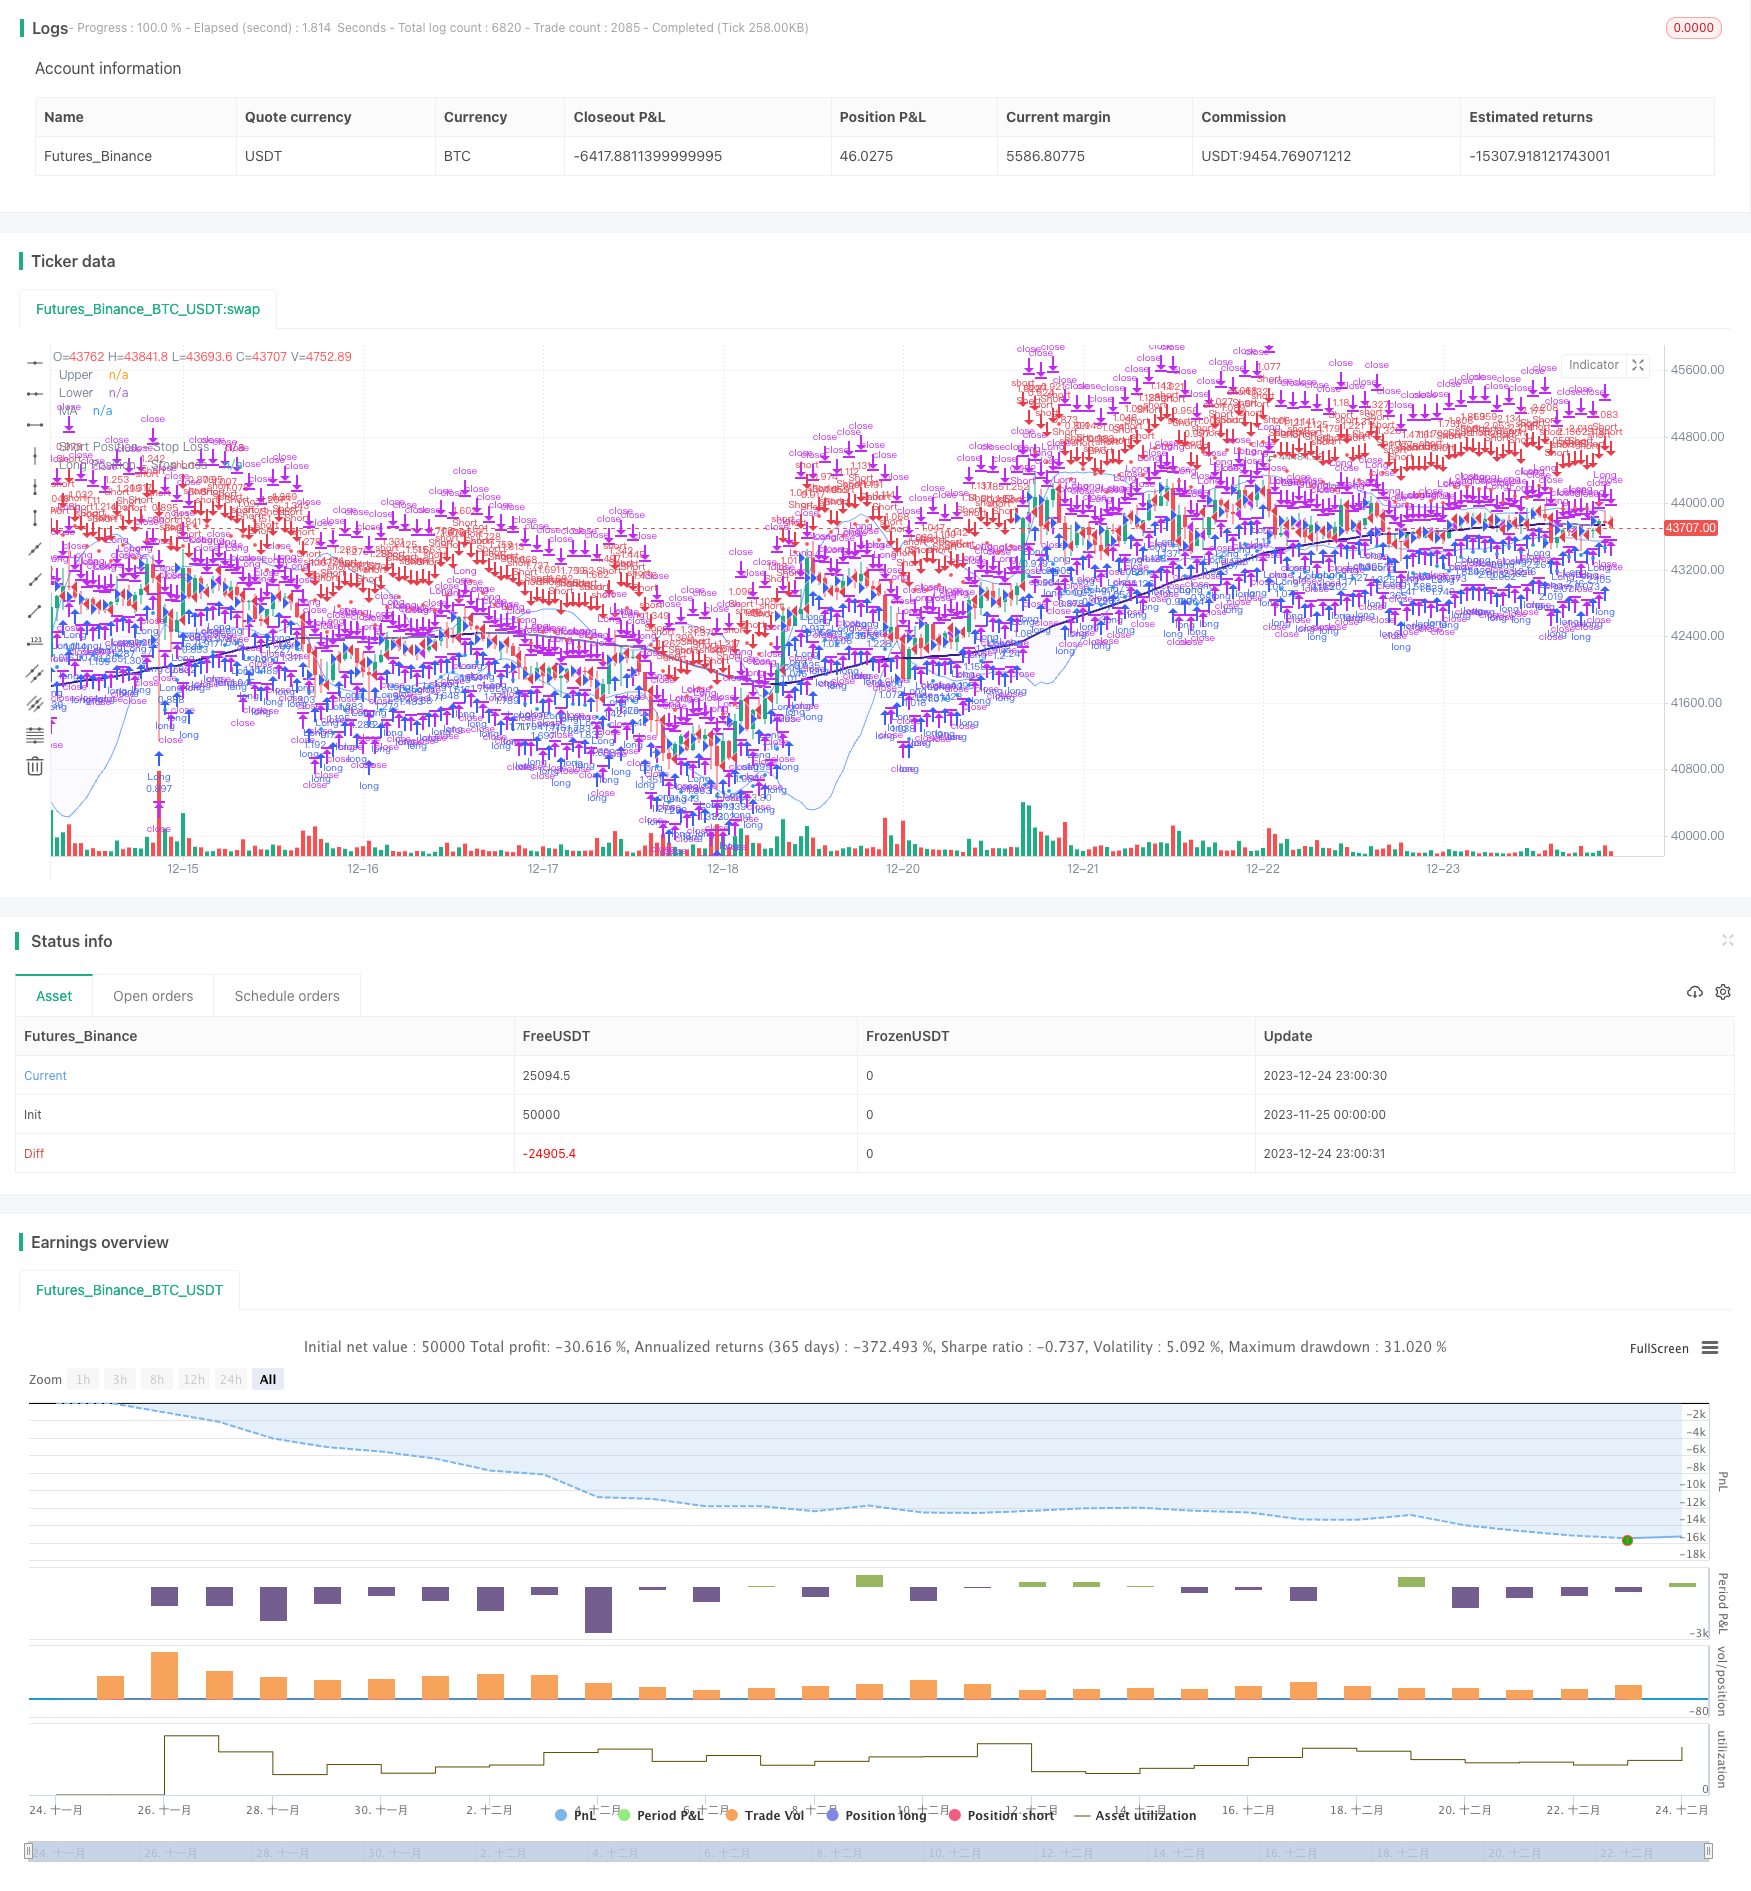
/*backtest
start: 2023-11-25 00:00:00
end: 2023-12-25 00:00:00
period: 1h
basePeriod: 15m
exchanges: [{"eid":"Futures_Binance","currency":"BTC_USDT"}]
*/

// This source code is subject to the terms of the Mozilla Public License 2.0 at https://mozilla.org/MPL/2.0/
// © sosacur01

//@version=5
strategy(title="Bollinger Band | Trend Following", overlay=true, pyramiding=1, commission_type=strategy.commission.percent, commission_value=0.2, initial_capital=10000)

//--------------------------------------

//BACKTEST RANGE
useDateFilter = input.bool(true, title="Filter Date Range of Backtest",
     group="Backtest Time Period")
backtestStartDate = input(timestamp("1 jan 2017"),
     title="Start Date", group="Backtest Time Period",
     tooltip="This start date is in the time zone of the exchange " +
     "where the chart's instrument trades. It doesn't use the time " +
     "zone of the chart or of your computer.")
backtestEndDate = input(timestamp("1 jul 2100"),
     title="End Date", group="Backtest Time Period",
     tooltip="This end date is in the time zone of the exchange " +
     "where the chart's instrument trades. It doesn't use the time " +
     "zone of the chart or of your computer.")
inTradeWindow = true
if not inTradeWindow and inTradeWindow[1]
    strategy.cancel_all()
    strategy.close_all(comment="Date Range Exit")

//--------------------------------------

//LONG/SHORT POSITION ON/OFF INPUT
LongPositions   = input.bool(title='On/Off Long Postion', defval=true, group="Long & Short Position")
ShortPositions  = input.bool(title='On/Off Short Postion', defval=true, group="Long & Short Position")

//--------------------------------------
//MA INPUTS
averageType1    = input.string(defval="WMA", group="MA", title="MA Type", options=["SMA", "EMA", "WMA", "HMA", "RMA", "SWMA", "ALMA", "VWMA", "VWAP"])
averageLength1  = input.int(defval=99, title="MA Lenght", group="MA")
averageSource1  = input(close, title="MA Source", group="MA")

//MA TYPE
MovAvgType1(averageType1, averageSource1, averageLength1) =>
	switch str.upper(averageType1)
        "SMA"  => ta.sma(averageSource1, averageLength1)
        "EMA"  => ta.ema(averageSource1, averageLength1)
        "WMA"  => ta.wma(averageSource1, averageLength1)
        "HMA"  => ta.hma(averageSource1, averageLength1)
        "RMA"  => ta.rma(averageSource1, averageLength1)
        "SWMA" => ta.swma(averageSource1)
        "ALMA" => ta.alma(averageSource1, averageLength1, 0.85, 6)
        "VWMA" => ta.vwma(averageSource1, averageLength1)
        "VWAP" => ta.vwap(averageSource1)
        => runtime.error("Moving average type '" + averageType1 +
             "' not found!"), na


//MA VALUES
ma  = MovAvgType1(averageType1, averageSource1, averageLength1)

//MA CONDITIONS
bullish_ma = close > ma
bearish_ma = close < ma

//PLOT COLOR
ma_plot    = if close > ma
    color.navy
else
    color.rgb(49, 27, 146, 40)

//MA PLOT
plot(ma,color=ma_plot, linewidth=2, title="MA")

//--------------------------------------
//BB INPUTS
length  = input.int(20, minval=1, group="BB")
src     = input(close, title="Source", group="BB")
mult    = input.float(2.0, minval=0.001, maxval=50, title="StdDev", group="BB")

//BB VALUES
basis = ta.sma(src, length)
dev = mult * ta.stdev(src, length)
upper = basis + dev
lower = basis - dev
offset = input.int(0, "Offset", minval = -500, maxval = 500)

//BBPLOT
//plot(basis, "Basis", color=#FF6D00, offset = offset)
p1 = plot(upper, "Upper", color=#2978ffa4, offset = offset)
p2 = plot(lower, "Lower", color=#2978ffa4, offset = offset)
fill(p1, p2, title = "Background", color=color.rgb(33, 47, 243, 97))

//BB ENTRY AND EXIT CONDITIONS
bb_long_entry  = close >= upper
bb_long_exit   = close <= lower
bb_short_entry = close <= lower
bb_short_exit  = close >= upper

//---------------------------------------------------------------
//VOLUME INPUTS
useVolumefilter  = input.bool(title='Use Volume Filter?', defval=false, group="Volume Inputs")
dailyLength      = input.int(title = "MA length", defval = 30, minval = 1, maxval = 100, group = "Volume Inputs")
lineWidth        = input.int(title = "Width of volume bars", defval = 3, minval = 1, maxval = 6, group = "Volume Inputs")
Volumefilter_display  = input.bool(title="Color bars?", defval=false, group="Volume Inputs", tooltip = "Change bar colors when Volume is above average")

//VOLUME VALUES
volumeAvgDaily = ta.sma(volume, dailyLength)

//VOLUME SIGNAL
v_trigger  = (useVolumefilter ? volume > volumeAvgDaily : inTradeWindow)

//PLOT VOLUME SIGNAL
barcolor(Volumefilter_display ? v_trigger ? color.new(#6fe477, 77):na: na, title="Volume Filter")
//---------------------------------------------------------------

//ENTRIES AND EXITS
long_entry  = if inTradeWindow and bullish_ma and bb_long_entry and v_trigger and LongPositions
    true
long_exit   = if inTradeWindow and bb_long_exit
    true

short_entry = if inTradeWindow  and bearish_ma and bb_short_entry and v_trigger and ShortPositions
    true
short_exit  = if inTradeWindow  and bb_short_exit
    true

//--------------------------------------

//RISK MANAGEMENT - SL, MONEY AT RISK, POSITION SIZING
atrPeriod                = input.int(14, "ATR Length", group="Risk Management Inputs")
sl_atr_multiplier        = input.float(title="Long Position - Stop Loss - ATR Multiplier", defval=2, group="Risk Management Inputs", step=0.5)
sl_atr_multiplier_short  = input.float(title="Short Position - Stop Loss - ATR Multiplier", defval=2, group="Risk Management Inputs", step=0.5)
i_pctStop                = input.float(2, title="% of Equity at Risk", step=.5, group="Risk Management Inputs")/100

//ATR VALUE
_atr = ta.atr(atrPeriod)

//CALCULATE LAST ENTRY PRICE
lastEntryPrice = strategy.opentrades.entry_price(strategy.opentrades - 1)

//STOP LOSS - LONG POSITIONS
var float sl = na

//CALCULTE SL WITH ATR AT ENTRY PRICE - LONG POSITION
if (strategy.position_size[1] != strategy.position_size)
    sl := lastEntryPrice - (_atr * sl_atr_multiplier)

//IN TRADE - LONG POSITIONS
inTrade = strategy.position_size > 0

//PLOT SL - LONG POSITIONS
plot(inTrade ? sl : na, color=color.blue, style=plot.style_circles, title="Long Position - Stop Loss")

//CALCULATE ORDER SIZE - LONG POSITIONS
positionSize = (strategy.equity * i_pctStop) / (_atr * sl_atr_multiplier)

//============================================================================================

//STOP LOSS - SHORT POSITIONS
var float sl_short = na

//CALCULTE SL WITH ATR AT ENTRY PRICE - SHORT POSITIONS
if (strategy.position_size[1] != strategy.position_size)
    sl_short := lastEntryPrice + (_atr * sl_atr_multiplier_short)

//IN TRADE SHORT POSITIONS
inTrade_short = strategy.position_size < 0

//PLOT SL - SHORT POSITIONS
plot(inTrade_short ? sl_short : na, color=color.red, style=plot.style_circles, title="Short Position - Stop Loss")

//CALCULATE ORDER - SHORT POSITIONS
positionSize_short = (strategy.equity * i_pctStop) / (_atr * sl_atr_multiplier_short)


//===============================================

//LONG STRATEGY
strategy.entry("Long", strategy.long, comment="Long", when = long_entry, qty=positionSize)
if (strategy.position_size > 0)
    strategy.close("Long", when = (long_exit), comment="Close Long")
    strategy.exit("Long", stop = sl, comment="Exit Long")

//SHORT STRATEGY
strategy.entry("Short", strategy.short, comment="Short", when = short_entry, qty=positionSize_short)
if (strategy.position_size < 0)
    strategy.close("Short", when = (short_exit), comment="Close Short")
    strategy.exit("Short", stop = sl_short, comment="Exit Short")

//ONE DIRECTION TRADING COMMAND (BELLOW ONLY ACTIVATE TO CORRECT BUGS)
//strategy.risk.allow_entry_in(strategy.direction.long)