Chiến lược giao dịch RSI Stochastic Oscillator Momentum
Tổng quan
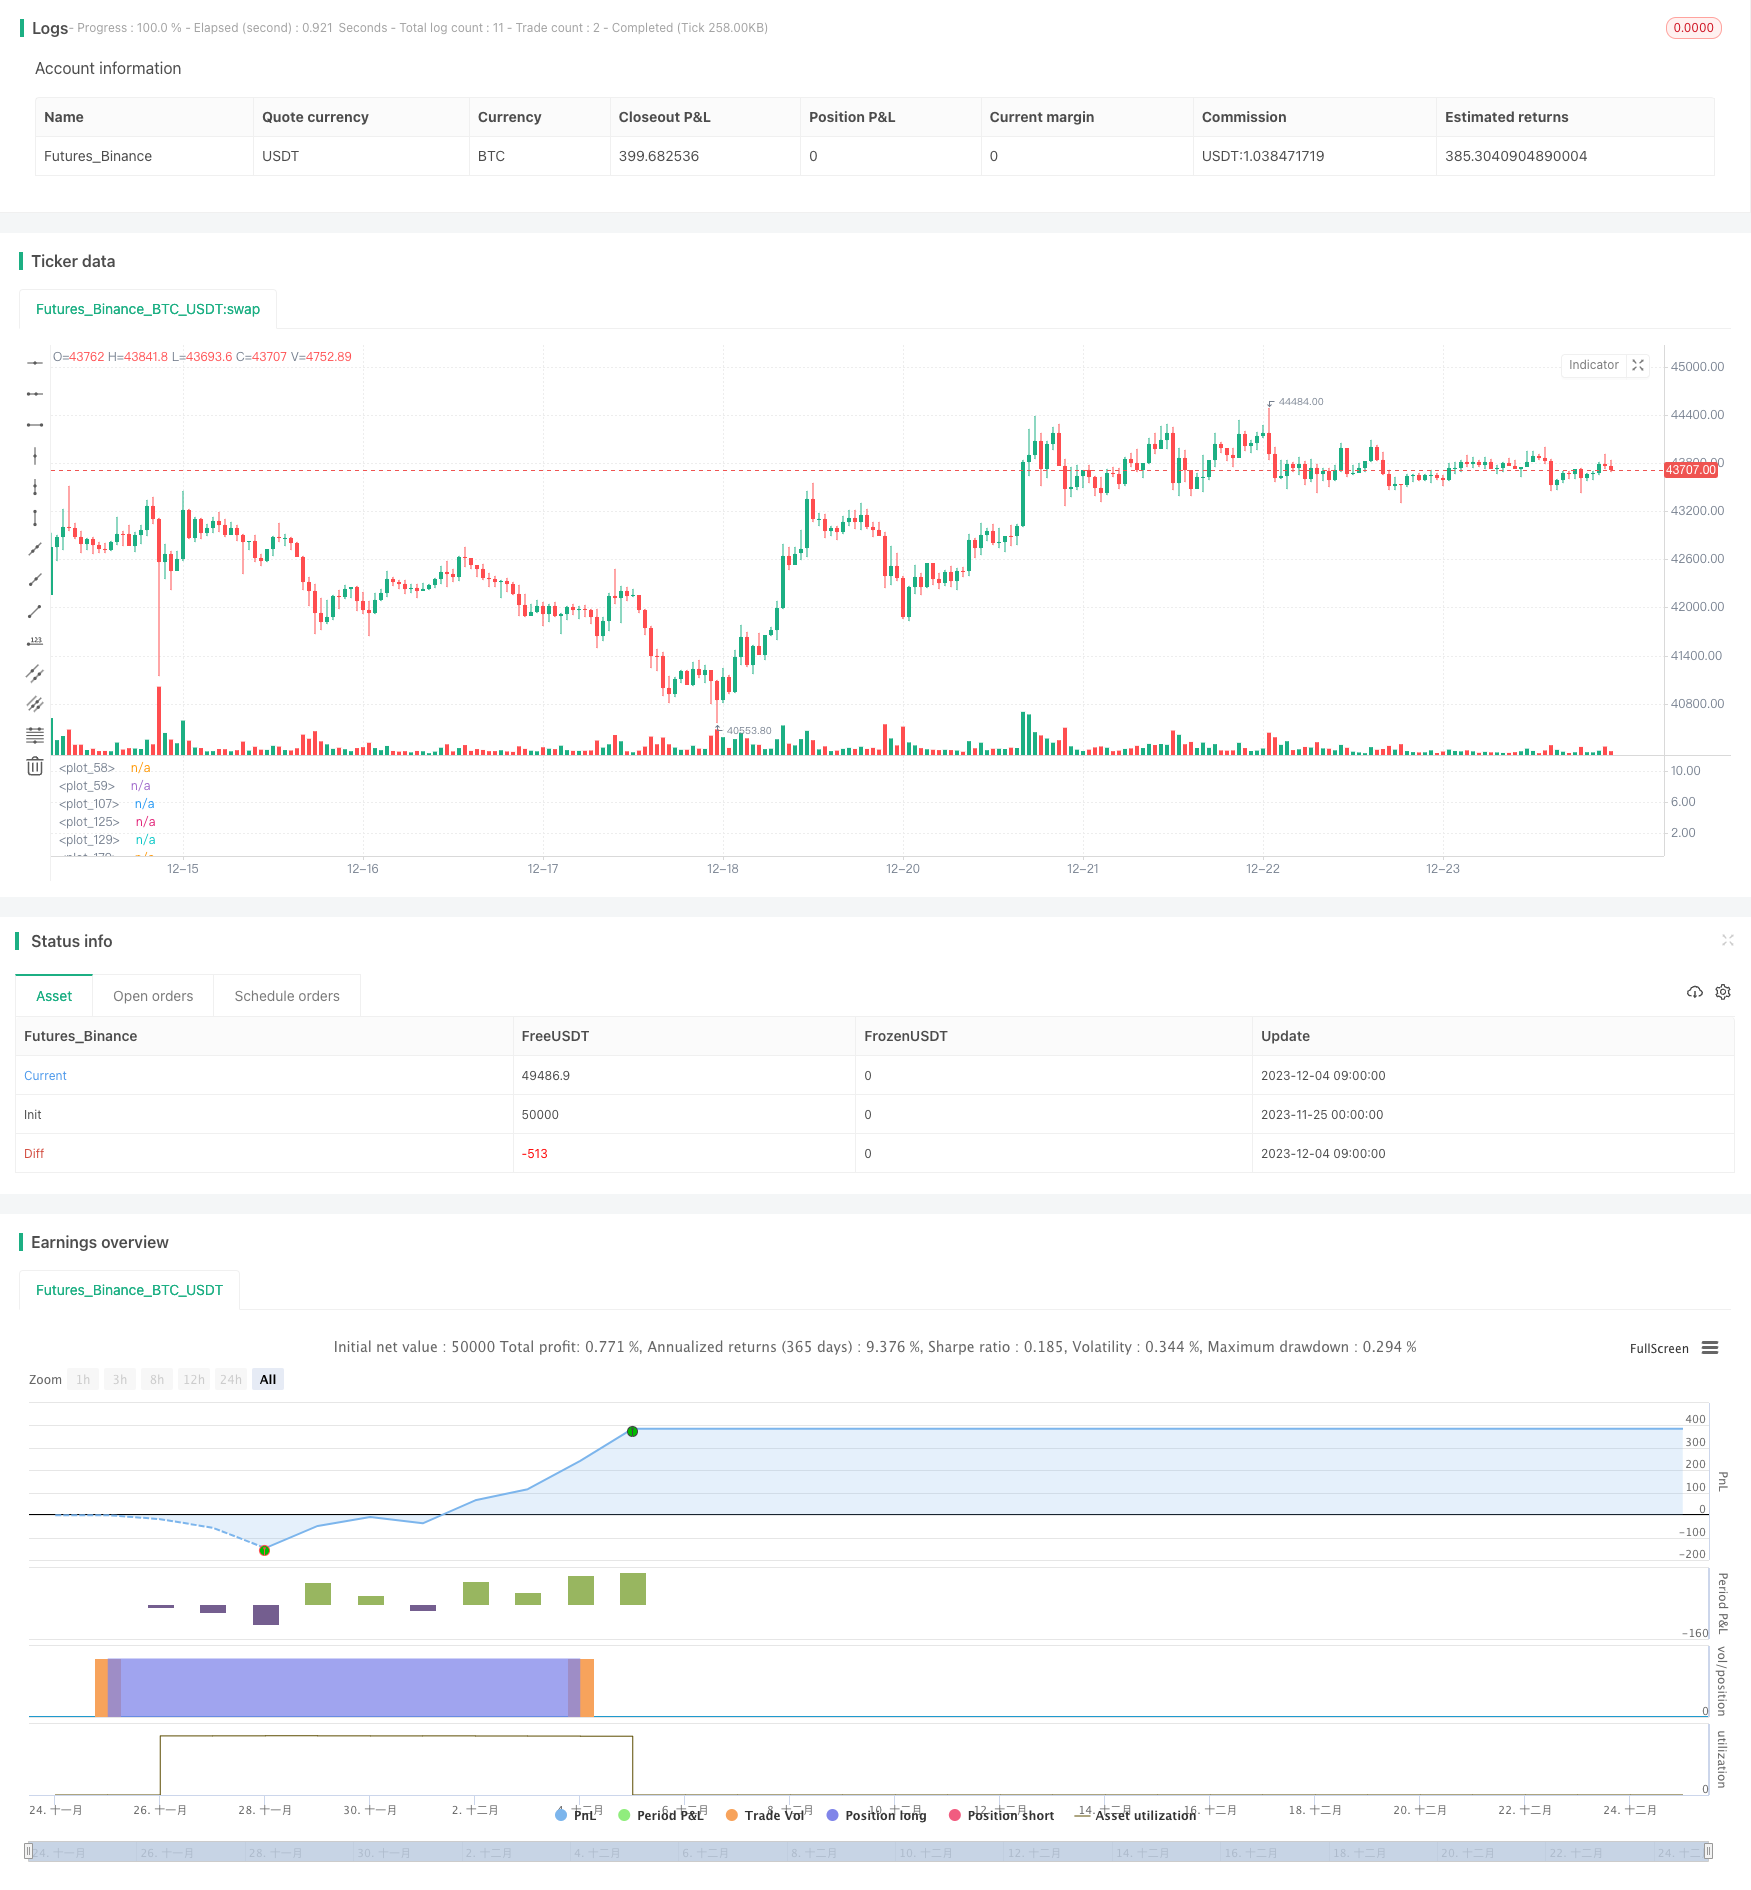
Bài viết này chủ yếu đề cập đến một chiến lược giao dịch xung động động dựa trên chỉ số Stochastic RSI. Chiến lược này sử dụng các chỉ số kỹ thuật có chu kỳ ngắn hơn (ví dụ: 30 phút) để đưa ra quyết định giao dịch dựa trên việc Stochastic RSI có đi vào khu vực quá mua quá bán hay không.
Nguyên tắc chiến lược
Chỉ số trung tâm của chiến lược này là Stochastic RSI. Công thức tính toán cho chỉ số Stochastic RSI là:
Stochastic RSI = (RSI - điểm RSI thấp) / (RSI cao - điểm RSI thấp) * 100
Trong đó, RSI sử dụng tham số lengthRSI ((đặc định 12), Stochastic RSI sử dụng tham số lengthStoch ((đặc định 12)).
Khi Stochastic RSI cao hơn vùng lấp đầy màu tím là vùng mua quá mức, khi đó làm trống; khi Stochastic RSI thấp hơn vùng lấp đầy màu tím là vùng bán quá mức, khi đó làm nhiều hơn.
Ngoài ra, chiến lược cũng đặt các điều kiện lọc đồng nhất. Chỉ khi EMA nhanh cao hơn EMA chậm, bạn có thể mở nhiều vị trí; Chỉ khi EMA nhanh thấp hơn EMA chậm, bạn có thể mở vị trí trống. Điều này giúp tránh giao dịch ngược.
Lợi thế chiến lược
So với một chiến lược RSI đơn lẻ, chiến lược này kết hợp với chỉ số Stochastic để xác định rõ hơn các khu vực quá mua quá bán, do đó cải thiện độ tin cậy của tín hiệu.
So với chiến lược Stochastic đơn lẻ, chiến lược này sử dụng RSI làm nguồn dữ liệu đầu vào của Stochastic, có thể lọc một phần tiếng ồn và làm cho tín hiệu đáng tin cậy hơn.
Các điều kiện lọc đều được thiết lập có thể ngăn chặn hiệu quả việc xây dựng hàng rào ngược, do đó giảm tổn thất không cần thiết.
Thiết lập thời gian giữ để tránh bị phá vỡ giả.
Rủi ro chiến lược
Chiến lược này chủ yếu sử dụng các chỉ số thời gian ngắn, vì vậy chỉ phù hợp với hoạt động ngắn hạn, hiệu quả của đường dài có thể không tốt.
Stochastic RSI tự nó tạo ra một số độ trễ, có thể bỏ lỡ tín hiệu sau biến động giá mạnh trong ngắn hạn.
Trong tình huống xung đột, Stochastic RSI sẽ tạo ra nhiều lần vượt qua vùng bán tháo, có thể làm tăng chi phí giao dịch.
Hướng tối ưu hóa chiến lược
Có thể thử nghiệm các kết hợp tham số khác nhau để tối ưu hóa hơn nữa độ dài, giá trị K và giá trị D của Stochastic RSI.
Có thể thử nghiệm các tham số độ dài RSI khác nhau để tìm ra độ dài chu kỳ RSI phù hợp hơn.
Bạn có thể thử kết hợp với các chỉ số khác để tăng thêm độ chính xác của tín hiệu. Ví dụ: MACD, Bollinger Bands, v.v.
Có thể thử nghiệm các tham số trì hoãn thời gian giữ vị trí khác nhau để tìm thời gian xuất hiện phù hợp hơn.
Tóm tắt
Bài viết này mô tả chi tiết các nguyên tắc xây dựng, lợi thế, rủi ro và ý tưởng tối ưu hóa chiến lược động lực dựa trên chỉ số Stochastic RSI. So với chiến lược chỉ số đơn, chiến lược này sử dụng lợi thế của cả RSI và Stochastic để xác định rõ ràng hơn và đáng tin cậy hơn các hiện tượng bán tháo bán tháo ngắn hạn của thị trường, do đó có thể đảo ngược giao dịch.
/*backtest
start: 2023-11-25 00:00:00
end: 2023-12-25 00:00:00
period: 1h
basePeriod: 15m
exchanges: [{"eid":"Futures_Binance","currency":"BTC_USDT"}]
*/

// This source code is subject to the terms of the Mozilla Public License 2.0 at https://mozilla.org/MPL/2.0/
// © Drun30 (Federico Magnani)

//@version=4
//STRATEGIA PRINCIPALE
capitaleIniziale=10000

var sizeordineInit= 50 // → % di capitale investita per ogni trade
var deltaSize = 25 // → delta% di capitale investito se trade precedente è stato in perdita
var sizeLimite = 100 //il trade non userà mai questa percentuale di capitale investito
var sizeordine = sizeordineInit

//Parametri ottimali 30 min
usiShort=false
usiLong=true
ipercomprato=85.29
ipervenduto=30.6
//

strategy("Momentum Strategy (V7.B.4)", initial_capital=capitaleIniziale, currency="USD", default_qty_type=strategy.percent_of_equity, commission_type=strategy.commission.percent, commission_value=0.1, slippage = 5, default_qty_value=sizeordineInit, overlay=false, pyramiding=0)

backtest = input(title="------------------------Backtest Period------------------------", defval = false)
start = timestamp(input(2020, "start year"), input(1, "start month"), input(1, "start day"), 00, 00)
end = timestamp(input(0, "end year"), input(0, "end month"), input(0, "end day"), 00, 00)

siamoindata=time > start?true:false
if end > 0
    siamoindata:=time > start and time <= end?true:false

basicParameters = input(title="------------------------Basic Parameters------------------------", defval = false)
smoothK = input(3, minval=1)
smoothD = input(6, minval=1)
lengthRSI = input(12, minval=1)
src = input(close, title="RSI Source")
rsi1 = rsi(src, lengthRSI)
lengthStoch = input(12, minval=1)
k = ema(stoch(rsi1, rsi1, rsi1, lengthStoch), smoothK)
d = ema(k, smoothD)
altezzaipercomprato= input(ipercomprato, title="Overbought Height", minval=1, type=input.float)
altezzaipervenduto= input(ipervenduto, title="Oversold Height", minval=1,type=input.float)

BarsDelay = input(6,title="Bars delay",minval=0)

GambleSizing = input(true, title = "Gamble Sizing?",type=input.bool)
gambleAdd = input(deltaSize,title="Gamble Add (%)",minval=0,type=input.integer)
gambleLimit = input(sizeLimite,title="Gamble MAX (%)",minval=0,type=input.integer)
if GambleSizing and strategy.closedtrades[0]>strategy.closedtrades[1]
    if strategy.losstrades[0]>strategy.losstrades[1] and sizeordine<gambleLimit
        sizeordine:=sizeordine+gambleAdd
    if strategy.wintrades[0]>strategy.wintrades[1]
        sizeordine:=sizeordineInit

periodomediamobile_fast = input(1, title="Fast EMA length",minval=1)
periodomediamobile_slow = input(60, title="Slow EMA length",minval=1)

plot(k, color=color.blue)
plot(d, color=color.orange)
h0 = hline(altezzaipercomprato)
h1 = hline(altezzaipervenduto)
fill(h0, h1, color=color.purple, transp=80)
// n=input(Vicinanzadalcentro,title="Vicinanza dal centro",minval=0)
//sarebbe il livello di D in cui si acquista o si vende, maggiore è la vicinanza maggiore sarà la frequenza dei trades, SE 0 è DISABILITATO

//     siamoinipervenduto= d<=altezzaipervenduto and d<=d[n] and d>d[1]?true:false //and d<d[3] and d>d[1]
//     siamoinipercomprato= d>=altezzaipercomprato and d>=d[n] and d<d[1]?true:false //and d>d[3] and d<d[1]
goldencross = crossover(k,d)
deathcross = crossunder(k,d)
// METTI VARIABILE IN CUI AVVIENE CROSSOVER O CROSSUNDER
valoreoro = valuewhen(goldencross,d,0)
valoremorte = valuewhen(deathcross,d,0)

siamoinipervenduto = goldencross and valoreoro<=altezzaipervenduto?true:false//d<=altezzaipervenduto?true:false
siamoinipercomprato = deathcross and valoremorte>=altezzaipercomprato?true:false//d>=altezzaipercomprato?true:false

long_separator = input(title="------------------------LONG------------------------", defval = usiLong)

sl_long_inp = input(10, title="Stop Loss LONG %", type=input.float)
tp_long_inp = input(8, title="Take Profit LONG %",type=input.float)
stop_level_long = strategy.position_avg_price * (1 - (sl_long_inp/100)) //strategy.position_avg_price corrisponde al prezzo con cui si è aperta la posizione
take_level_long = strategy.position_avg_price * (1 + (tp_long_inp/100))

//BINANCE
JSON_long = 'OPEN LONG: PUT THE JSON HERE FOR THE API CALL'
JSON_chiusura = 'CLOSE POSITION: PUT THE JSON HERE FOR THE API CALL'

webhookLong = JSON_long
webhookClose= JSON_chiusura

trendFilterL = input(title="TREND FILTER LONG?", defval = true)

EMAfast=ema(close,periodomediamobile_fast)
EMAslow=ema(close,periodomediamobile_slow)

siamoinuptrend_ema=EMAfast>EMAslow?true:false //close>=EMAfast and EMAfast>EMAslow
siamoinuptrend = siamoinuptrend_ema

// CondizioneAperturaLong = siamoinipervenduto and siamoindata // and siamoinuptrend
CondizioneAperturaLong = siamoinipervenduto and siamoindata and long_separator
if trendFilterL
    CondizioneAperturaLong := siamoinipervenduto and siamoindata and long_separator and siamoinuptrend

CondizioneChiusuraLong = siamoinipercomprato and siamoindata

possiamoAprireLong=0
if trendFilterL and siamoinuptrend
    possiamoAprireLong:=5
plot(possiamoAprireLong,color=color.green)

sonPassateLeBarreG = barssince(CondizioneAperturaLong) == BarsDelay?true:false
sonPassateLeBarreD = barssince(CondizioneChiusuraLong) == BarsDelay?true:false

haiUnLongAncoraAperto = false
haiUnLongAncoraAperto := strategy.position_size>0?true:false

// Se l'ultimo valore della serie "CondizioneAperturaLong" è TRUE, allora hai un long ancora aperto
// Se l'ultimo valore della serie "CondizioneAperturaLong" è FALSE, allora:
//       Se l'ultimo valore della serie "CondizioneChiusuraLong" è TRUE, allora NON hai un long ancora aperto
//       Se l'ultimo valore della serie "CondizioneChiusuraLong" è FALSE, allora restituisce l'ultimo valore della serie "haiUnLongAncoraAperto"

haiUnLongAncoraAperto_float = if(haiUnLongAncoraAperto==true)
    10
else
    0

plot(haiUnLongAncoraAperto_float,color=color.red) //FInché la linea rossa si trova a livello "1" allora c'è un ordine long in corso

quantita = (sizeordine/100*(capitaleIniziale+strategy.netprofit))/valuewhen(haiUnLongAncoraAperto==false and CondizioneAperturaLong,close,0)

plot(sizeordine,color=color.purple, linewidth=3)

if  strategy.position_size<=0 and CondizioneAperturaLong //and sonPassateLeBarreG and haiUnLongAncoraAperto==false strategy.opentrades==0
    strategy.entry("Vamonos",strategy.long, alert_message=webhookLong, comment="OPEN LONG", qty=quantita)

if  strategy.position_size>0 //and sonPassateLeBarreD // and CondizioneChiusuraLong
    if siamoinuptrend == true and sonPassateLeBarreD
        strategy.close("Vamonos", alert_message=webhookClose, comment="CLOSE LONG")
    else if siamoinuptrend == false and CondizioneChiusuraLong
        strategy.close("Vamonos", alert_message=webhookClose, comment="CLOSE LONG")


if strategy.position_size>0 and siamoindata
    strategy.exit("Vamonos", stop=stop_level_long, limit=take_level_long, comment="CLOSE LONG (LIMIT/STOP)")


short_separator = input(title="------------------------SHORT------------------------", defval = usiShort)

sl_short_inp = input(20, title="Stop Loss SHORT %")
tp_short_inp = input(35, title="Take Profit SHORT %")
stop_level_short = strategy.position_avg_price * (1 + (sl_short_inp/100))
take_level_short= strategy.position_avg_price * (1 - (tp_short_inp/100))

// BINANCE
JSON_short = 'OPEN SHORT: PUT THE JSON HERE FOR THE API CALL'

webhookShort = JSON_short

trendFilterS = input(title="TREND FILTER SHORT?", defval = true)

siamoindowntrend_ema=EMAfast<EMAslow?true:false //close<=EMAfast and EMAfast<EMAslow
siamoindowntrend=siamoindowntrend_ema

CondizioneAperturaShort = short_separator and siamoinipercomprato and siamoindata
if trendFilterS
    CondizioneAperturaShort:=short_separator and siamoinipercomprato and siamoindata and siamoindowntrend

CondizioneChiusuraShort = siamoinipervenduto and siamoindata

sonPassateLeBarreGs = barssince(CondizioneAperturaShort) == BarsDelay?true:false
sonPassateLeBarreDs = barssince(CondizioneChiusuraShort) == BarsDelay?true:false

haiUnoShortAncoraAperto = false
haiUnoShortAncoraAperto := strategy.position_size<0?true:false

haiUnoShortAncoraAperto_float = if(haiUnoShortAncoraAperto==true)
    15
else
    0

plot(haiUnoShortAncoraAperto_float,color=color.purple) //FInché la linea viola si trova a livello "2" allora c'è un ordine short in corso

if CondizioneAperturaShort and strategy.position_size>=0 //and haiUnoShortAncoraAperto==false
    strategy.entry("Andale",strategy.short,alert_message=webhookShort, comment="OPEN SHORT")

if  strategy.position_size<0 //and sonPassateLeBarreD // and CondizioneChiusuraLong
    if siamoindowntrend == true and sonPassateLeBarreDs
        strategy.close("Andale",alert_message=webhookClose, comment="CLOSE SHORT")
    else if siamoindowntrend == false and CondizioneChiusuraShort
        strategy.close("Andale",alert_message=webhookClose, comment="CLOSE SHORT")

if strategy.position_size<0 and siamoindata
    strategy.exit("Andale", stop=stop_level_short, limit=take_level_short, comment="CLOSE SHORT (LIMIT/STOP)")