Chiến lược tối ưu hóa dừng lỗ động dựa trên chiến lược lưới đánh cá
Tổng quan
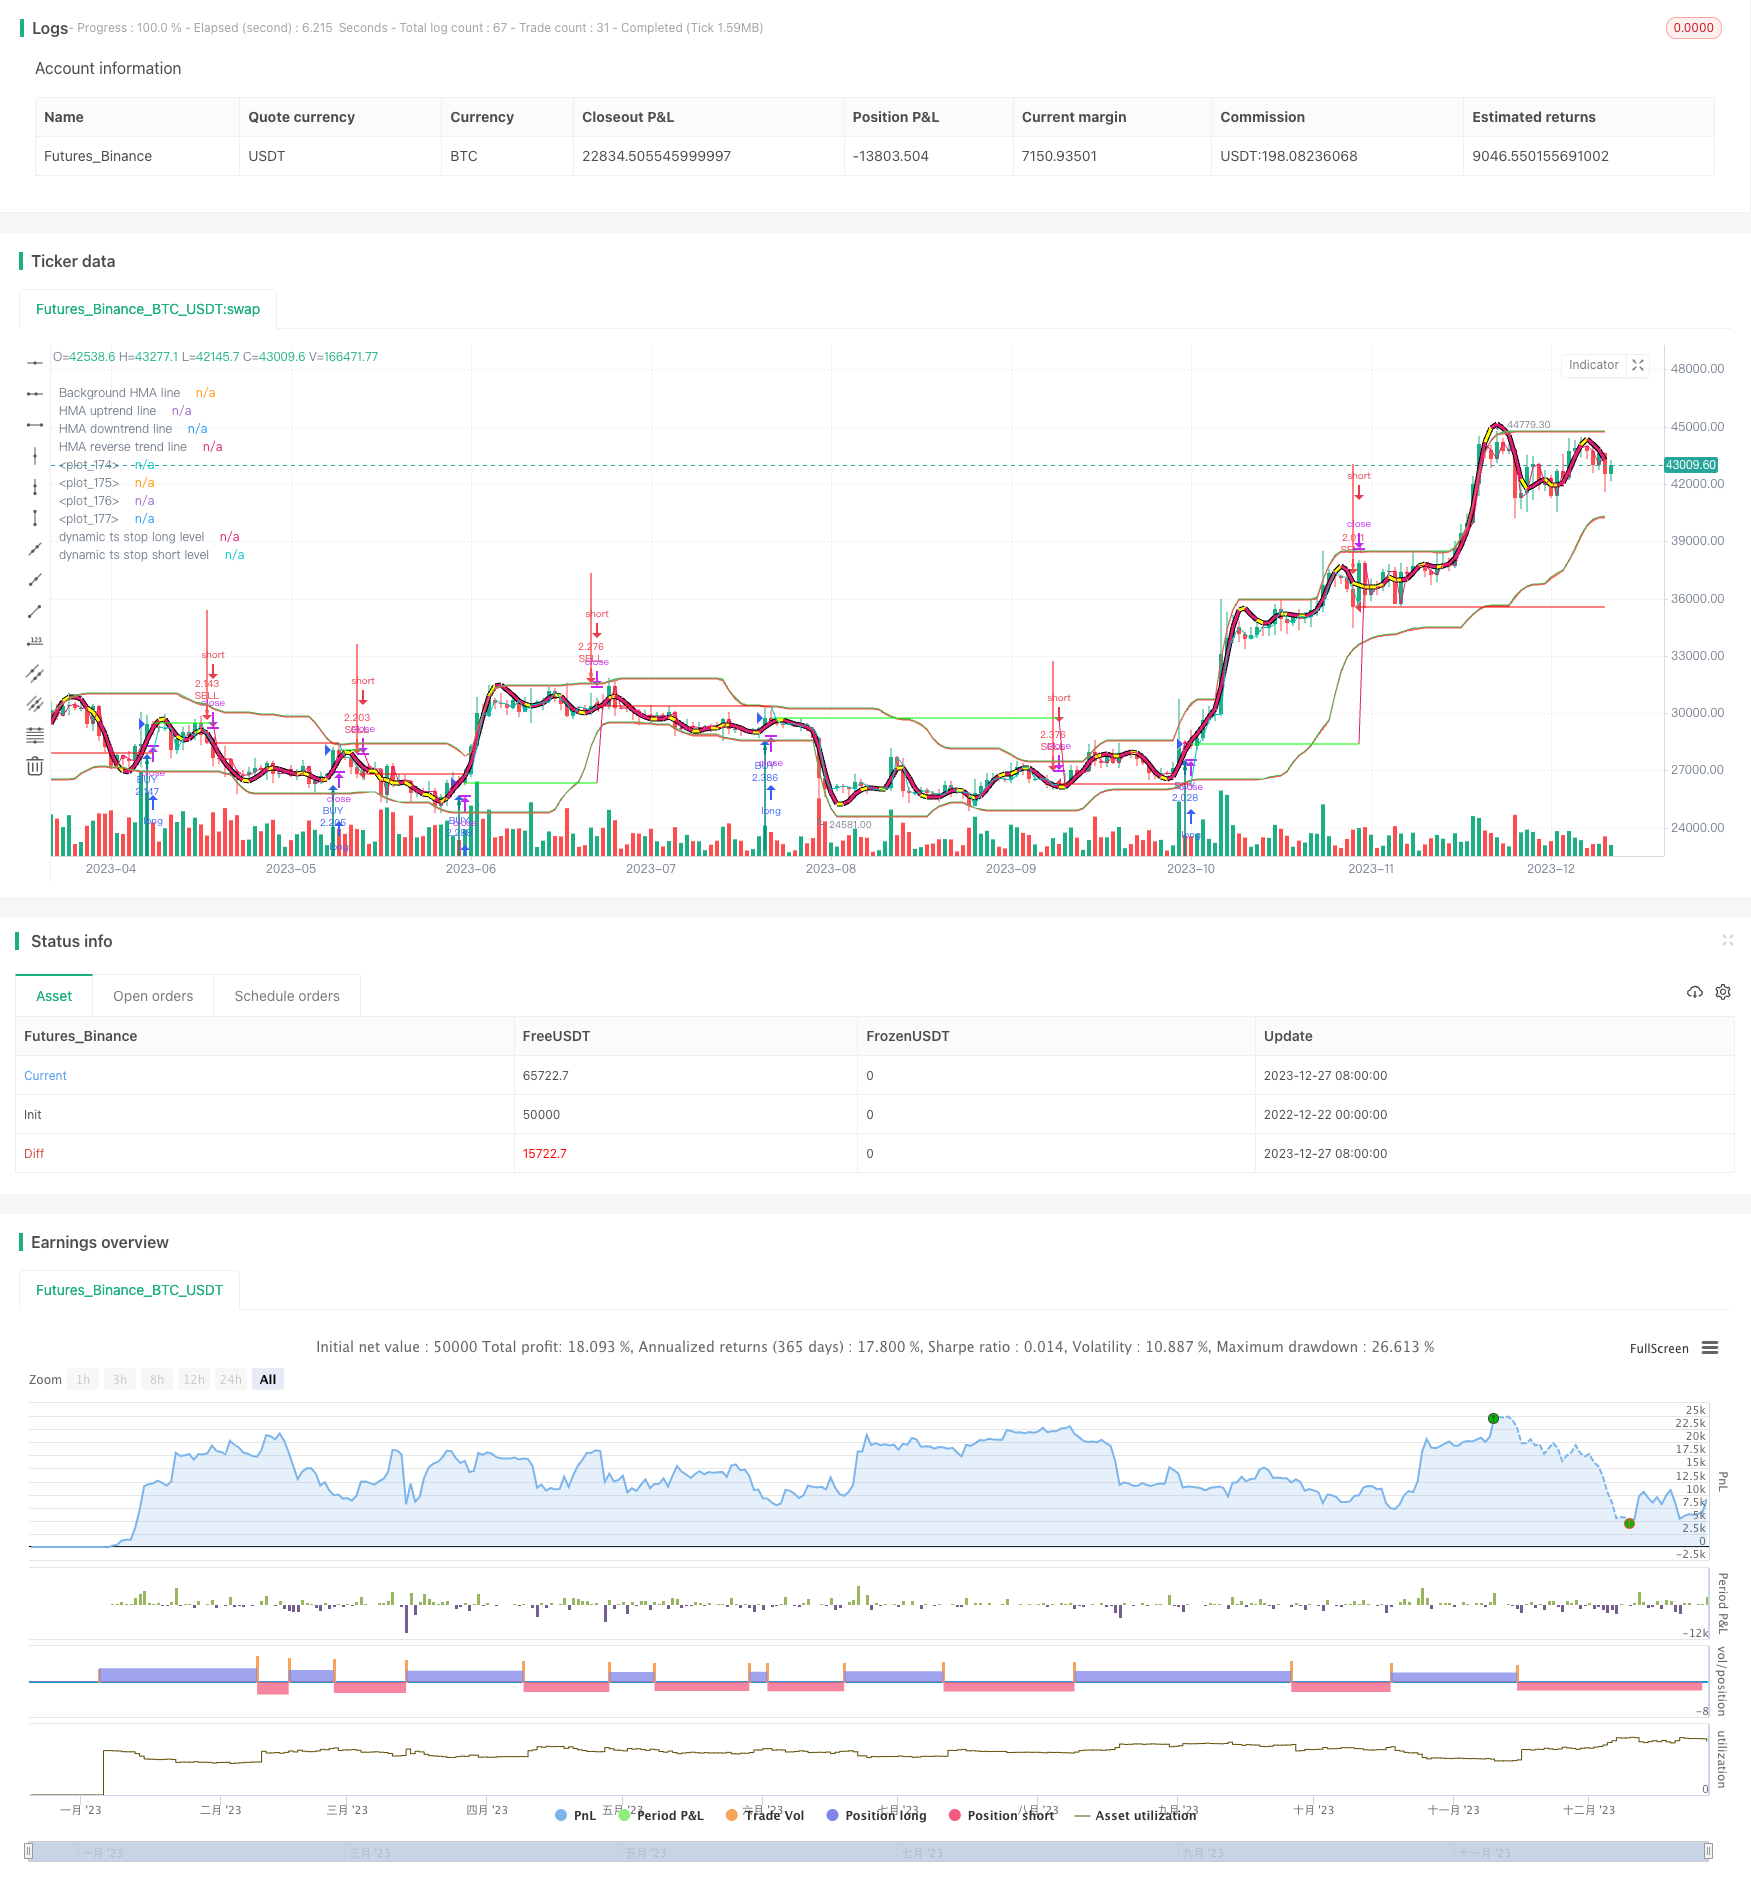
Ý tưởng cốt lõi của chiến lược này là kết hợp chiến lược lưới đánh cá và cơ chế dừng lỗ di động, để thực hiện thoát lỗ hiệu quả hơn. Chiến lược lưới đánh cá đánh giá xu hướng và vị trí thị trường thông qua chỉ số K-line, xác định động thời gian mua và bán. Trong khi đó, cơ chế dừng lỗ động có thể thiết lập điểm dừng lỗ và kiểm soát rủi ro hiệu quả theo mức độ biến động của thị trường.
Nguyên tắc
Chính sách này dựa trên các mô-đun sau:
- Mô-đun chỉ số lưới
Tính toán các chỉ số lưới cá thông qua các chỉ số căng thẳng Fisher và Stoch để đánh giá xu hướng thị trường và điểm mua và bán.
- Mô-đun dừng động
Theo ATR và RSI chỉ số động tính điểm dừng lỗ, thực hiện động theo dõi dừng lỗ.
- Mô-đun theo dõi mất mát di động
Thiết lập điểm di chuyển dừng cố định và thoát khỏi vị trí khi giá đạt điểm dừng.
Phân tích lợi thế
Lợi thế lớn nhất của chiến lược này là khả năng kiểm soát rủi ro tuyệt vời. Cơ chế dừng động có thể thiết lập mức dừng thích hợp theo mức độ biến động của thị trường, có hiệu quả trong việc tránh thiệt hại do trượt quá lớn và có thể theo dõi xu hướng tốt hơn so với dừng cố định. Ngoài ra, chỉ số lưới cá đánh giá thời gian mua và bán chính xác và đáng tin cậy, có thể lọc một số giao dịch ồn ào.
Phân tích rủi ro
Rủi ro chính của chiến lược này là thiết lập điểm dừng không đúng có thể gây ra sự thoát quá quyết liệt. Ngoài ra, nếu sử dụng thiết lập tham số quá quyết liệt, nó cũng có thể gây ra giao dịch whipsaw quá thường xuyên. Để giảm thiểu những rủi ro này, các tham số nên được lựa chọn hợp lý và tránh thiết lập độ di chuyển quá lớn.
Hướng tối ưu hóa
Các hoạt động tối ưu hóa trong chiến lược này tập trung vào các khía cạnh sau:
Tối ưu hóa các tham số chỉ số lưới đánh cá, tìm ra xu hướng đánh giá các tham số tốt hơn;
Tối ưu hóa các tham số dừng động để tìm một mức dừng cân bằng hơn;
Thêm mô-đun quản lý vị trí dựa trên biến động, điều chỉnh vị trí theo mức độ biến động của thị trường.
Chiến lược này có thể đạt được lợi nhuận điều chỉnh rủi ro cao hơn thông qua tìm kiếm tham số và tối ưu hóa quy tắc.
Tóm tắt
Chiến lược này kết hợp các chỉ số lưới cá và công nghệ dừng lỗ động để đánh giá chính xác hơn về xu hướng thị trường, hỗ trợ quyết định khi chọn, và có thể điều chỉnh động mức độ dừng lỗ, kiểm soát rủi ro hiệu quả. Bằng cách mở rộng mô-đun liên tục và tối ưu hóa tham số, chiến lược này có thể trở thành một khung chiến lược hiệu quả có thể được áp dụng lâu dài.
/*backtest
start: 2022-12-22 00:00:00
end: 2023-12-28 00:00:00
period: 1d
basePeriod: 1h
exchanges: [{"eid":"Futures_Binance","currency":"BTC_USDT"}]
*/

//@version=4
strategy("IFTS+TS Strategy Overlay ", overlay=true, pyramiding = 0, calc_on_order_fills = false, commission_type =  strategy.commission.percent, commission_value = 0.0454, default_qty_type = strategy.percent_of_equity, default_qty_value = 100)

//INPUTS
stochlength=input(19, "Stoch & ATR Length")
wmalength=input(4, title="Smooth")
ul = input(82.05,step=0.01, title="UP line")
dl = input(19,step=0.01, title="DOWN line")
uts = input(true, title="Use trailing stop")
rts = input(false, title="Re-enter after trailing stop")
tsi = input(title="trailing stop actiation pips",defval=245)
tso = input(title="trailing stop offset pips",defval=20)
udts = input(true, title="Use dynamic trailing stop start")
mpl2 = input(68.3,step=0.05, title="Multiplier for Dynamic TS start X*ATR")
udto = input(true, title="Use dynamic trailing stop offset")
mpl = input(1,step=0.01, title="Multiplier for Dynamic TS offset X*ATR")
occ = input(1, title="Occurancy for dynamic TS")
useCurrentRes = input(true, title="Use Current Chart Resolution?")
resCustom = input(title="Timeframe",defval="30")
hma = input(title="Plot Hull MA", defval=true)
pl = input(title="Plot all", defval=true)

//CALCULATIONS
v1=0.1*(stoch(close, high, low, stochlength)-50)
v2=wma(v1, wmalength)
k1=(exp(2*v2)-1)/(exp(2*v2)+1)*50+50
res = useCurrentRes ? timeframe.period : resCustom
k=security(syminfo.tickerid, res, k1, barmerge.lookahead_off)

//CALCULATIONS HULL MA
n=stochlength/2
n2ma=2*wma(close,round(n/2))
nma=wma(close,n)
diff=n2ma-nma
sqn=round(sqrt(n))
n2ma1=2*wma(close[1],round(n/2))
nma1=wma(close[1],n)
diff1=n2ma1-nma1
sqn1=round(sqrt(n))
n1=wma(diff,sqn)
n2=wma(diff1,sqn)
n3=n1-(n1*-1)
n4=n1+(n1)

//CALCULATIONS FOR BUY/SELL LEVELS
//stc=(stoch(close, high, low, stochlength))

//v3=0.1*(stoch(low, low, low, stochlength)-50)
//v4=wma(v3, wmalength)
//k3=(exp(2*v4)-1)/(exp(2*v4)+1)*50+50
//k2=security(syminfo.tickerid, res, k3, barmerge.lookahead_off)
//stl=(stoch(low, low, low, stochlength))

//v5=0.1*(stoch(high, high, high, stochlength)-50)
//v6=wma(v5, wmalength)
//k5=(exp(2*v6)-1)/(exp(2*v6)+1)*50+50
//k4=security(syminfo.tickerid, res, k5, barmerge.lookahead_off)
//sth=(stoch(high, high, high, stochlength))

//difc=k-stc
//difl=k2-stl+difc
//difh=k4-sth+difc

hg1=wma(highest(stochlength),wmalength)//-highest(stochlength)*(difh/10000)
hg=security(syminfo.tickerid, res, hg1, barmerge.lookahead_off)
hgob=hg-hg*((100-ul)/10000)
lw1=wma(lowest(stochlength),wmalength)//-lowest(stochlength)*(difl/10000)
lw=security(syminfo.tickerid, res, lw1, barmerge.lookahead_off)
lwos=lw+lw*(dl/10000)

////CONDITIONS CROSS
sell = crossunder(k,ul)? 1 : 0
buy = crossover(k,dl)? 1 : 0

////COUNT BARCOLORS
var countred = 0
if sell == 1
    countred := 1
if buy == 1
    countred := 0

var countgreen = 0
if buy == 1
    countgreen := 1
if sell == 1
    countgreen := 0

////CONDITIONS COUNT BARCOLORS
long=countgreen[1]==0 and countgreen==1 ? 1 : 0
short=countred[1]==0 and countred==1 ? 1 : 0

////COLORS
//STOCH
col = k>=k[1] ? color.aqua : color.red
col1 = countred[2]==1 ? na : #00FF00
col2 = countgreen[2]==1 ? na : #FF0000
col3 = countred[2]==1 ? na : color.yellow
col4 = countgreen[2]==1 ? na : color.yellow
//HMA
dif = n1[1]-n3
dif1 = dif>dif[1] and dif[1]>dif[2] ? na: #00FF00 //uptrend - green
dif3 = n4-n1[1]
dif2 = dif3>dif3[1] and dif3[1]>dif3[2] ? na: #FF0000  //downtrend - red
dif4 = (dif>dif[1] and dif[1]>dif[2]) == (dif3>dif3[1] and dif3[1]>dif3[2]) ? #FFFF00: na //trend change - yellow

////PLOTS CALCULATIONS DYNAMIC TS
dtso1 = sma(atr(stochlength),2)*100
dtso=security(syminfo.tickerid, "1", dtso1,barmerge.lookahead_on)*mpl
dtsi = rsi(atr(stochlength),stochlength)/mpl2*tsi
dtsiv = valuewhen(long or short, dtsi, occ)
dtsov = valuewhen(long or short, dtso, occ)
//DYNAMIC TS START
dtsil1 = countred[2]==1 and pl and uts and udts? open+(dtsiv/100) : na
dtsis1 = countgreen[2]==1 and pl and uts and udts? open-(dtsiv/100) : na
dtsil = countred[2]==1 and pl and uts and udts? open+(dtsiv/100) : fixnan(dtsil1[1])
dtsis = countgreen[2]==1 and pl and uts and udts? open-(dtsiv/100) : fixnan(dtsis1[1])
//DYNAMIC TS OFFSET+START
dtsol1 = countred[2]==1 and pl and uts and udto? dtsil-(dtsov/100) : na
dtsos1 = countgreen[2]==1 and pl and uts and udto? dtsis+(dtsov/100) : na
dtsol = countred[2]==1 and pl and uts and udto? dtsil-(dtsov/100) : fixnan(dtsol1[1])
dtsos = countgreen[2]==1 and pl and uts and udto? dtsis+(dtsov/100) : fixnan(dtsos1[1])
//CONST TS START
tsil1 = countred[2]==1 and pl and uts and not udts? open+(tsi/100) : na
tsis1 = countgreen[2]==1 and pl and uts and not udts? open-(tsi/100) : na
tsil = countred[2]==1 and pl and uts and not udts? open+(tsi/100) : fixnan(tsil1[1])
tsis = countgreen[2]==1 and pl and uts and not udts? open-(tsi/100) : fixnan(tsis1[1])
//CONST TS START + DYNAMIC TS OFFSET
tsol21 = countred[2]==1 and pl and uts and not udts and udto? open+(tsi/100)-(dtsov/100) : na
tsos21 = countgreen[2]==1 and pl and uts and not udts and udto? open-(tsi/100)+(dtsov/100) : na
tsol2 = countred[2]==1 and pl and uts and not udts and udto? open+(tsi/100)-(dtsov/100) : fixnan(tsol21[1])
tsos2 = countgreen[2]==1 and pl and uts and not udts and udto? open-(tsi/100)+(dtsov/100) : fixnan(tsos21[1])
//CONST TS OFFSET
tsol1 = countred[2]==1 and pl and uts and not udto? tsil-(tso/100) : na
tsos1 = countgreen[2]==1 and pl and uts and not udto? tsis+(tso/100) : na
tsol = countred[2]==1 and pl and uts and not udto? tsil-(tso/100) : fixnan(tsol1[1])
tsos = countgreen[2]==1 and pl and uts and not udto? tsis+(tso/100) : fixnan(tsos1[1])

//////PLOTS
////LABELS
//TS LABELS
// ltsos = (short==1) and udto and pl? label.new(bar_index, high[1]+close*0.006,  text="os "+tostring(round(dtsov)), color=color.white, size=size.small) : na
// ltsol = (long==1) and udto and pl? label.new(bar_index, low[1]-close*0.006,  text="os "+tostring(round(dtsov)), color=color.white, size=size.small, style=label.style_labelup) : na
// ltsis = (short==1) and udts and pl? label.new(bar_index, high[1]+close*0.008, text="st "+tostring(round(dtsiv)), color=color.white, size=size.small) : na
// ltsil = (long==1) and udts and pl? label.new(bar_index, low[1]-close*0.008,  text="st "+tostring(round(dtsiv)), color=color.white, size=size.small, style=label.style_labelup) : na
//STOCH LABEL
//lk = k>ul and pl? label.new(bar_index, high, text=tostring(round(k)), color=col, size=size.small) :na
//lk2 = k<dl and pl? label.new(bar_index, high, text=tostring(round(k)), color=col, size=size.small) :na
//lk3 = k>dl and k<ul and pl? label.new(bar_index, high, text=tostring(round(k)), color=color.white, size=size.small) :na
//label.delete(lk[1])
//label.delete(lk2[1])
//label.delete(lk3[1])

//ltson = udto==true and pl? label.new(bar_index, 75, text="os "+tostring(round(dtso)), color=color.yellow, size=size.small) :na
//label.delete(ltson[1])
//ltsin = udts==true and pl? label.new(bar_index, 0, text="st "+tostring(round(dtsi)), color=color.yellow, size=size.small) :na
//label.delete(ltsin[1])

//DYNAMIC TS LINES
plot(dtsil, color=col1, transp = 0, title = "dynamic ts stop long level")
plot(dtsis, color=col2, transp = 0, title = "dynamic ts stop short level")
plot(dtsol, color=col3, transp = 30, title = "dynamic ts offset long level")
plot(dtsos, color=col4, transp = 30, title = "dynamic ts offset short level")
plot(tsol2, color=col3, transp = 30, title = "const start + dynamic ts offset long level")
plot(tsos2, color=col4, transp = 30, title = "const start + dynamic ts offset short level")
//TS LINES
plot(tsil, color=col1, transp = 0, title = "const ts stop long level")
plot(tsis, color=col2, transp = 0, title = "const ts stop short level")
plot(tsol, color=col3, transp = 30, title = "const ts stop offset long level")
plot(tsos, color=col4, transp = 30, title = "const ts stop offset short level")
//ARROWS
plotarrow(pl==true? long : na, colorup = color.teal, transp=0, title = "buy arrow")
plotarrow(pl==true? -short : na, colordown = color.red, transp=0, title = "sell arrow")
//HIGH/LOW
p1 = plot(pl==true?hg : na, color=color.green, transp=100, editable=false)
p2 = plot(pl==true?lw : na, color=color.red, transp=100, editable=false)
p3 = plot(pl==true?lwos : na, color=color.green, linewidth=1, transp=100, editable=false)
p4 = plot(pl==true?hgob : na, color=color.red, linewidth=1, transp=100, editable=false)
fill(p1,p4, color=color.green, transp=75, title = "highest price levels")
fill(p2,p3, color=color.red, transp=75, title = "lowest price levels")
//HMA
mab=plot(hma and pl ? n1 : na,color=#000000, linewidth=5, transp=0, title = "Background HMA line") //black
ma=plot(hma and pl ? n1 : na,color=dif1, linewidth=3, transp=10, title = "HMA uptrend line") //green
ma2=plot(hma and pl ? n1 : na,color=dif2, linewidth=3, transp=20, title = "HMA downtrend line")//red
ma3=plot(hma and pl ? n1 : na,color=dif4, linewidth=3, transp=10, title = "HMA reverse trend line") //yellow
//LINES
// ldl = long[1]==1 and uts and udts? line.new(bar_index, high, bar_index, dtsil, color=#00FF00, width = 1) : na
// lds = short[1]==1 and uts and udts? line.new(bar_index, high, bar_index, dtsis, color=#FF0000, width = 1) : na
// ll = long[1]==1 and uts and not udts? line.new(bar_index, high, bar_index, tsil, color=#00FF00, width = 1) : na
// ls = short[1]==1 and uts and not udts? line.new(bar_index, high, bar_index, tsis, color=#FF0000, width = 1) : na

////STRATEGY
strategy.entry("BUY", strategy.long, when = buy)
strategy.entry("SELL", strategy.short, when = sell)

if (rts)
    strategy.entry("BUY", strategy.long, when = countgreen==1 and dif1==#00FF00)
    strategy.entry("SELL", strategy.short, when = countred==1 and dif2==#FF0000)

if  (uts)
    strategy.exit("Close BUY with TS","BUY", trail_points = tsi, trail_offset = tso)
    strategy.exit("Close SELL with TS","SELL", trail_points = tsi, trail_offset = tso)

    if  (udto)
        strategy.exit("Close BUY with TS","BUY", trail_points = tsi, trail_offset = dtsov)
        strategy.exit("Close SELL with TS","SELL", trail_points = tsi, trail_offset = dtsov)

    if  (udts)
        strategy.exit("Close BUY with TS","BUY", trail_points = dtsiv, trail_offset = tso)
        strategy.exit("Close SELL with TS","SELL", trail_points = dtsiv, trail_offset = tso)

    if  (udto and udts)
        strategy.exit("Close BUY with TS","BUY", trail_points = dtsiv, trail_offset = dtsov)
        strategy.exit("Close SELL with TS","SELL", trail_points = dtsiv, trail_offset = dtsov)