Chiến lược xu hướng giao cắt tử thần Golden Cross EMA kép
Ngày tạo:
2023-12-29 15:46:15
sửa đổi lần cuối:
2023-12-29 15:46:15
sao chép:
2
Số nhấp chuột:
835
1
tập trung vào
1750
Người theo dõi
Tổng quan
Chiến lược này sử dụng hai chỉ số EMA để xác định hướng xu hướng hiện tại và kết hợp với chỉ số RSI để tránh bỏ lỡ cơ hội mua và bán, là một chiến lược theo dõi xu hướng điển hình.
Nguyên tắc chiến lược
- Tính trung bình EMA của kỳ 10 và 20, được đặt tên là ma00 và ma01
- Khi ma00 đeo ma01 tạo ra tín hiệu mua
- Khi ma00 dưới ma01 tạo ra một tín hiệu bán
- Trong khi đó, khi giá lên đến ma00, nếu ma00 cao hơn ma01 cũng sẽ tạo ra một tín hiệu mua
- Tương tự như vậy, khi giá đi xuống ma00, nếu ma00 thấp hơn ma01 cũng sẽ tạo ra một tín hiệu bán
- Với sự phân biệt này, bạn có thể tránh bỏ lỡ một số điểm mua và bán.
- Thiết lập giá dừng và dừng để kiểm soát rủi ro
Phân tích lợi thế
- Sử dụng phán đoán EMA kép, có thể lọc các đột phá giả hiệu quả
- Phân biệt điều kiện để tránh bị bỏ phiếu
- Cài đặt Stop Loss Stop để kiểm soát rủi ro
Phân tích rủi ro
- Chiến lược đường trung bình EMA kép thuộc chiến lược theo dõi xu hướng, thường xuyên mua và bán trong tình trạng xung đột, dễ bị mất mát
- Không thể xác định chính xác điểm đảo ngược xu hướng, có thể dẫn đến tổn thất
- Đặt điểm dừng lỗ không đúng cách có thể làm tăng lỗ
Hướng tối ưu hóa
- Có thể tối ưu hóa đúng chu kỳ EMA, tìm kiếm sự kết hợp tham số tốt nhất
- Có thể kết hợp các chỉ số khác để tăng sự ổn định của chiến lược
- Có thể thiết lập dừng động, điều chỉnh điểm dừng theo thời gian thực theo biến động của thị trường
Mã nguồn chiến lược
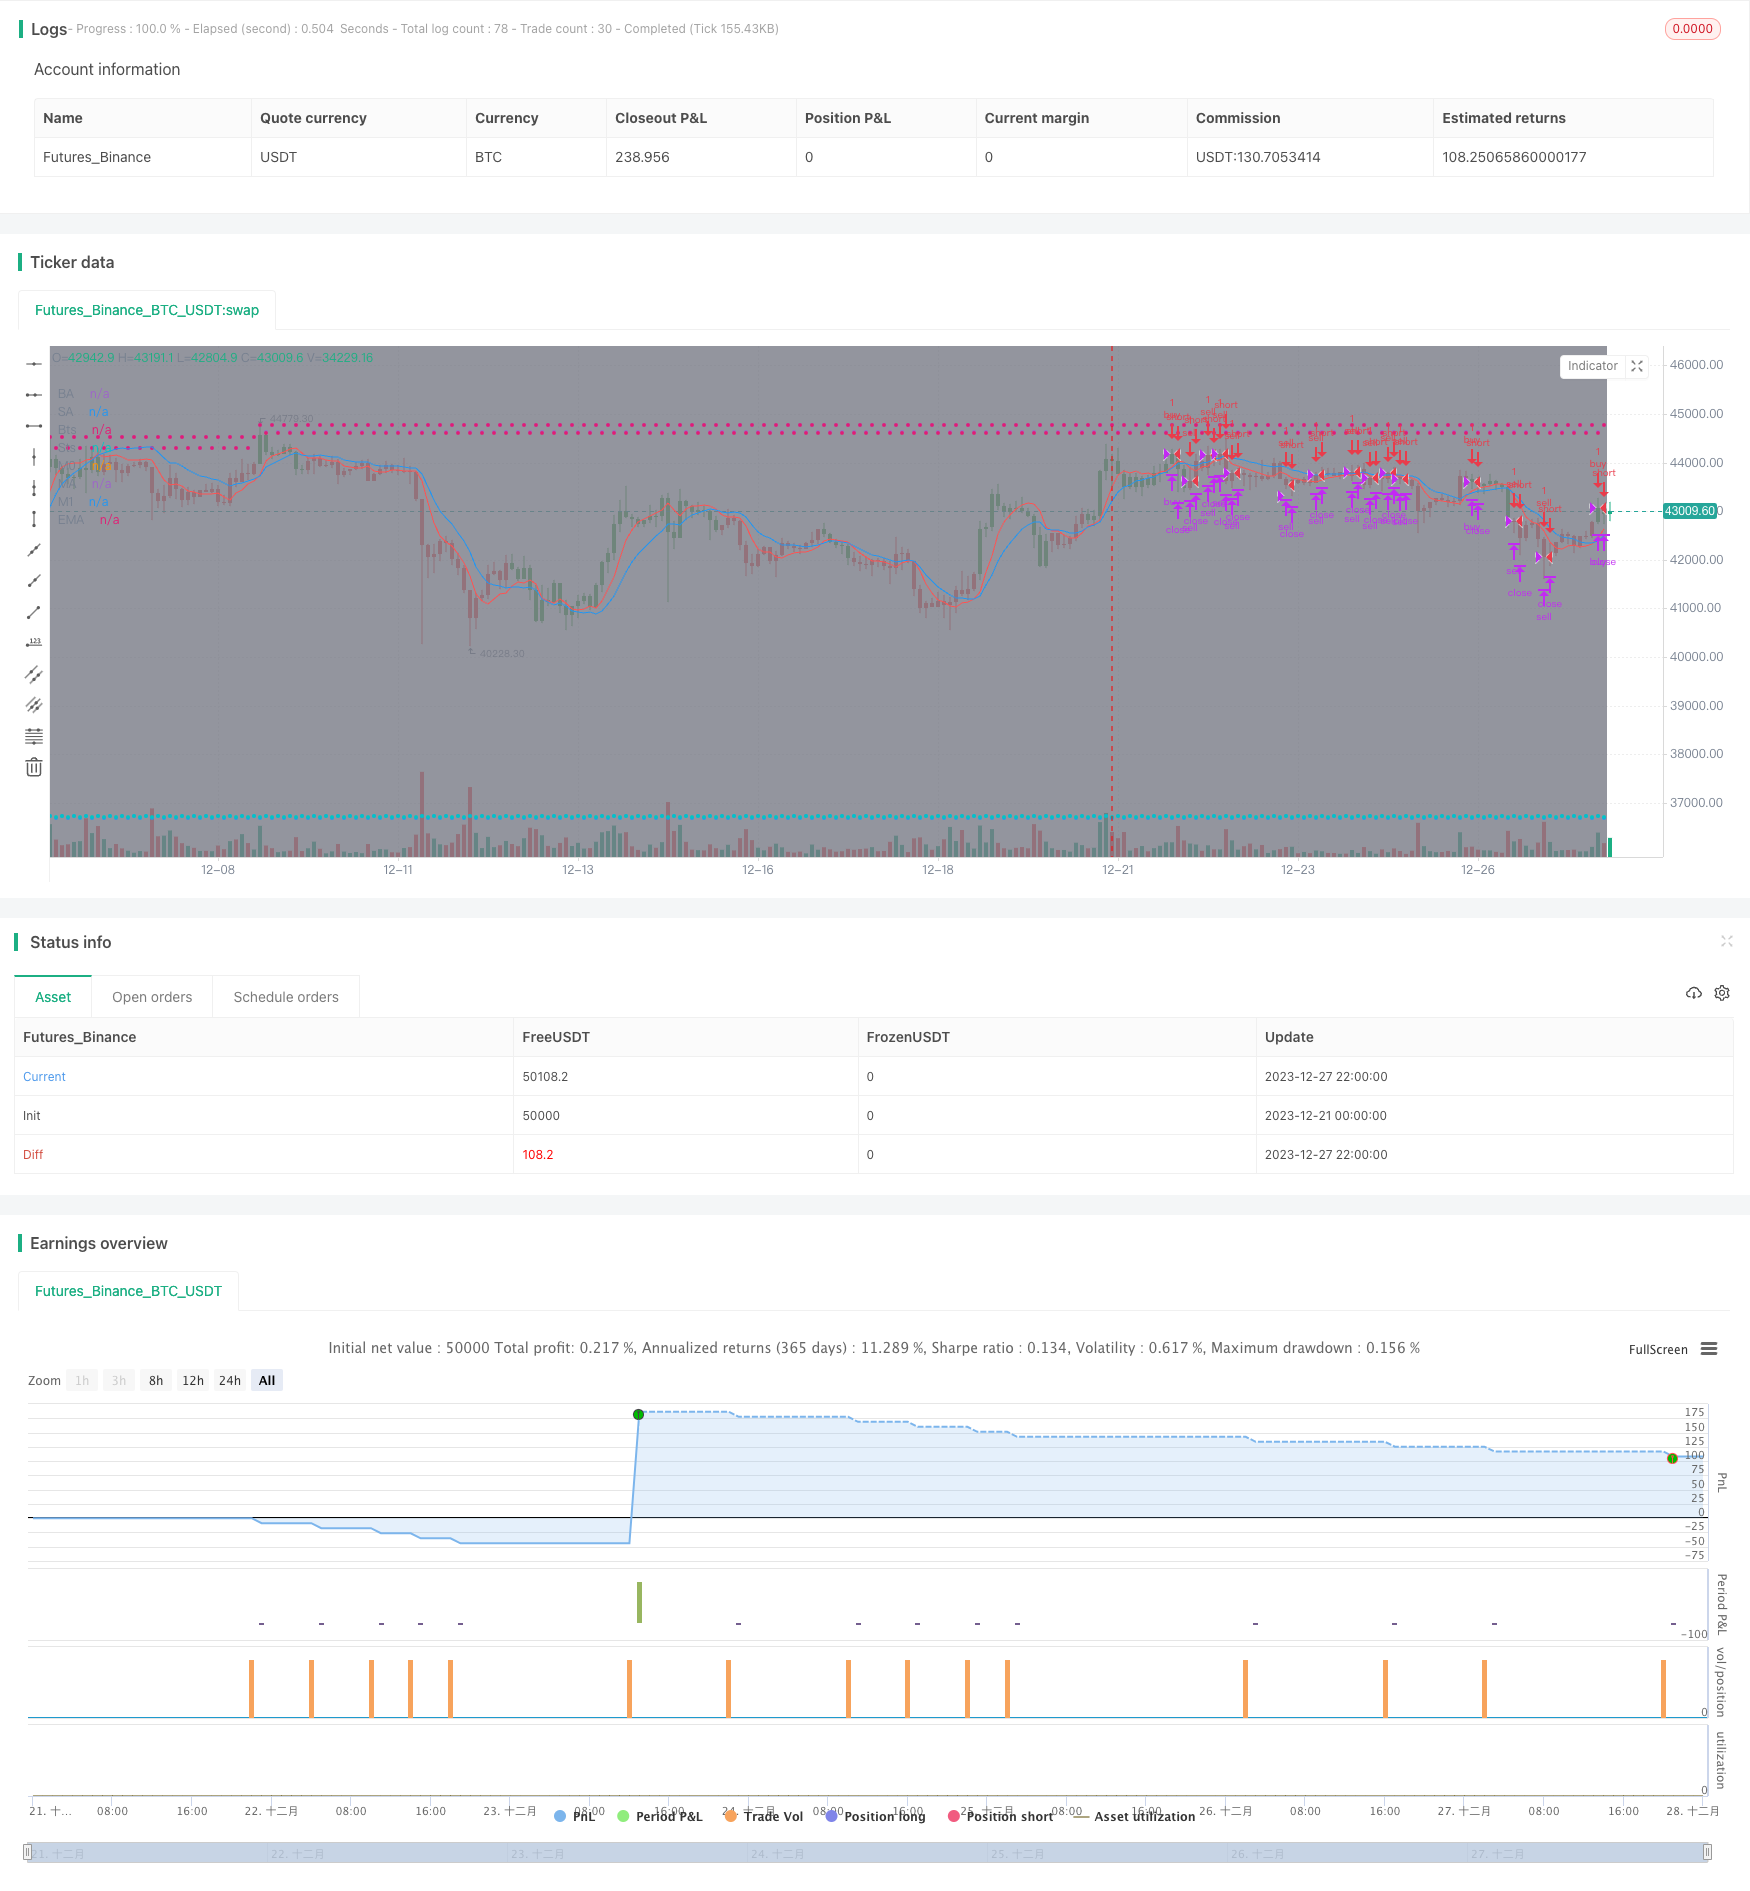
/*backtest
start: 2023-12-21 00:00:00
end: 2023-12-28 00:00:00
period: 2h
basePeriod: 15m
exchanges: [{"eid":"Futures_Binance","currency":"BTC_USDT"}]
*/

//@version=4

strategy(title='[STRATEGY][RS]MicuRobert EMA cross V1', shorttitle='S', overlay=true, pyramiding=0, initial_capital=100000)
USE_TRADESESSION = input(title='Use Trading Session?', type=bool, defval=true)
USE_TRAILINGSTOP = input(title='Use Trailing Stop?', type=bool, defval=true)
trade_session = input(title='Trade Session:',  defval='0400-1500', confirm=false)
istradingsession = not USE_TRADESESSION ? false : not na(time('1', trade_session))
bgcolor(istradingsession?color.gray:na)
trade_size = input(title='Trade Size:', type=float, defval=1)
tp = input(title='Take profit in pips:', type=float, defval=55.0) * (syminfo.mintick*10)
sl = input(title='Stop loss in pips:', type=float, defval=11.0) * (syminfo.mintick*10)
ma_length00 = input(title='EMA length:',  defval=10)
ma_length01 = input(title='DEMA length:',  defval=20)
price = input(title='Price source:', defval=open)

//  ||--- NO LAG EMA, Credit LazyBear:  ---||
f_LB_zlema(_src, _length)=>
    _ema1=ema(_src, _length)
    _ema2=ema(_ema1, _length)
    _d=_ema1-_ema2
    _zlema=_ema1+_d
//  ||-------------------------------------||

ma00 = f_LB_zlema(price, ma_length00)
ma01 = f_LB_zlema(price, ma_length01)
plot(title='M0', series=ma00, color=black)
plot(title='M1', series=ma01, color=black)

isnewbuy = change(strategy.position_size)>0 and change(strategy.opentrades)>0
isnewsel = change(strategy.position_size)<0 and change(strategy.opentrades)>0

buy_entry_price = isnewbuy ? price : buy_entry_price[1]
sel_entry_price = isnewsel ? price : sel_entry_price[1]
plot(title='BE', series=buy_entry_price, style=circles, color=strategy.position_size <= 0 ? na : aqua)
plot(title='SE', series=sel_entry_price, style=circles, color=strategy.position_size >= 0 ? na : aqua)
buy_appex = na(buy_appex[1]) ? price : isnewbuy ? high : high >= buy_appex[1] ? high : buy_appex[1]
sel_appex = na(sel_appex[1]) ? price : isnewsel ? low : low <= sel_appex[1] ? low : sel_appex[1]
plot(title='BA', series=buy_appex, style=circles, color=strategy.position_size <= 0 ? na : teal)
plot(title='SA', series=sel_appex, style=circles, color=strategy.position_size >= 0 ? na : teal)
buy_ts = buy_appex - sl
sel_ts = sel_appex + sl
plot(title='Bts', series=buy_ts, style=circles, color=strategy.position_size <= 0 ? na : red)
plot(title='Sts', series=sel_ts, style=circles, color=strategy.position_size >= 0 ? na : red)

buy_cond1 = crossover(ma00, ma01) and (USE_TRADESESSION ? istradingsession : true)
buy_cond0 = crossover(price, ma00) and ma00 > ma01 and (USE_TRADESESSION ? istradingsession : true)
buy_entry = buy_cond1 or buy_cond0
buy_close = (not USE_TRAILINGSTOP ? false : low <= buy_ts) or high>=buy_entry_price+tp//high>=last_traded_price + tp or low<=last_traded_price - sl //high >= hh or
sel_cond1 = crossunder(ma00, ma01) and (USE_TRADESESSION ? istradingsession : true)
sel_cond0 = crossunder(price, ma00) and ma00 < ma01 and (USE_TRADESESSION ? istradingsession : true)
sel_entry = sel_cond1 or sel_cond0
sel_close = (not USE_TRAILINGSTOP ? false : high >= sel_ts) or low<=sel_entry_price-tp//low<=last_traded_price - tp or high>=last_traded_price + sl //low <= ll or

strategy.entry('buy', long=strategy.long, qty=trade_size, comment='buy', when=buy_entry)
strategy.close('buy', when=buy_close)
strategy.entry('sell', long=strategy.short, qty=trade_size, comment='sell', when=sel_entry)
strategy.close('sell', when=sel_close)

//What i add .!
pos = iff(ma01 < ma00 , 1,
	    iff(ma01 > ma00 , -1, nz(pos[1], 0)))
barcolor(pos == -1 ? red: pos == 1 ? green : blue)
plot(ma00, color=red, title="MA")
plot(ma01, color=blue, title="EMA")