Chiến lược theo xu hướng xác nhận ba lần được thúc đẩy bởi chỉ báo động lượng
Tổng quan
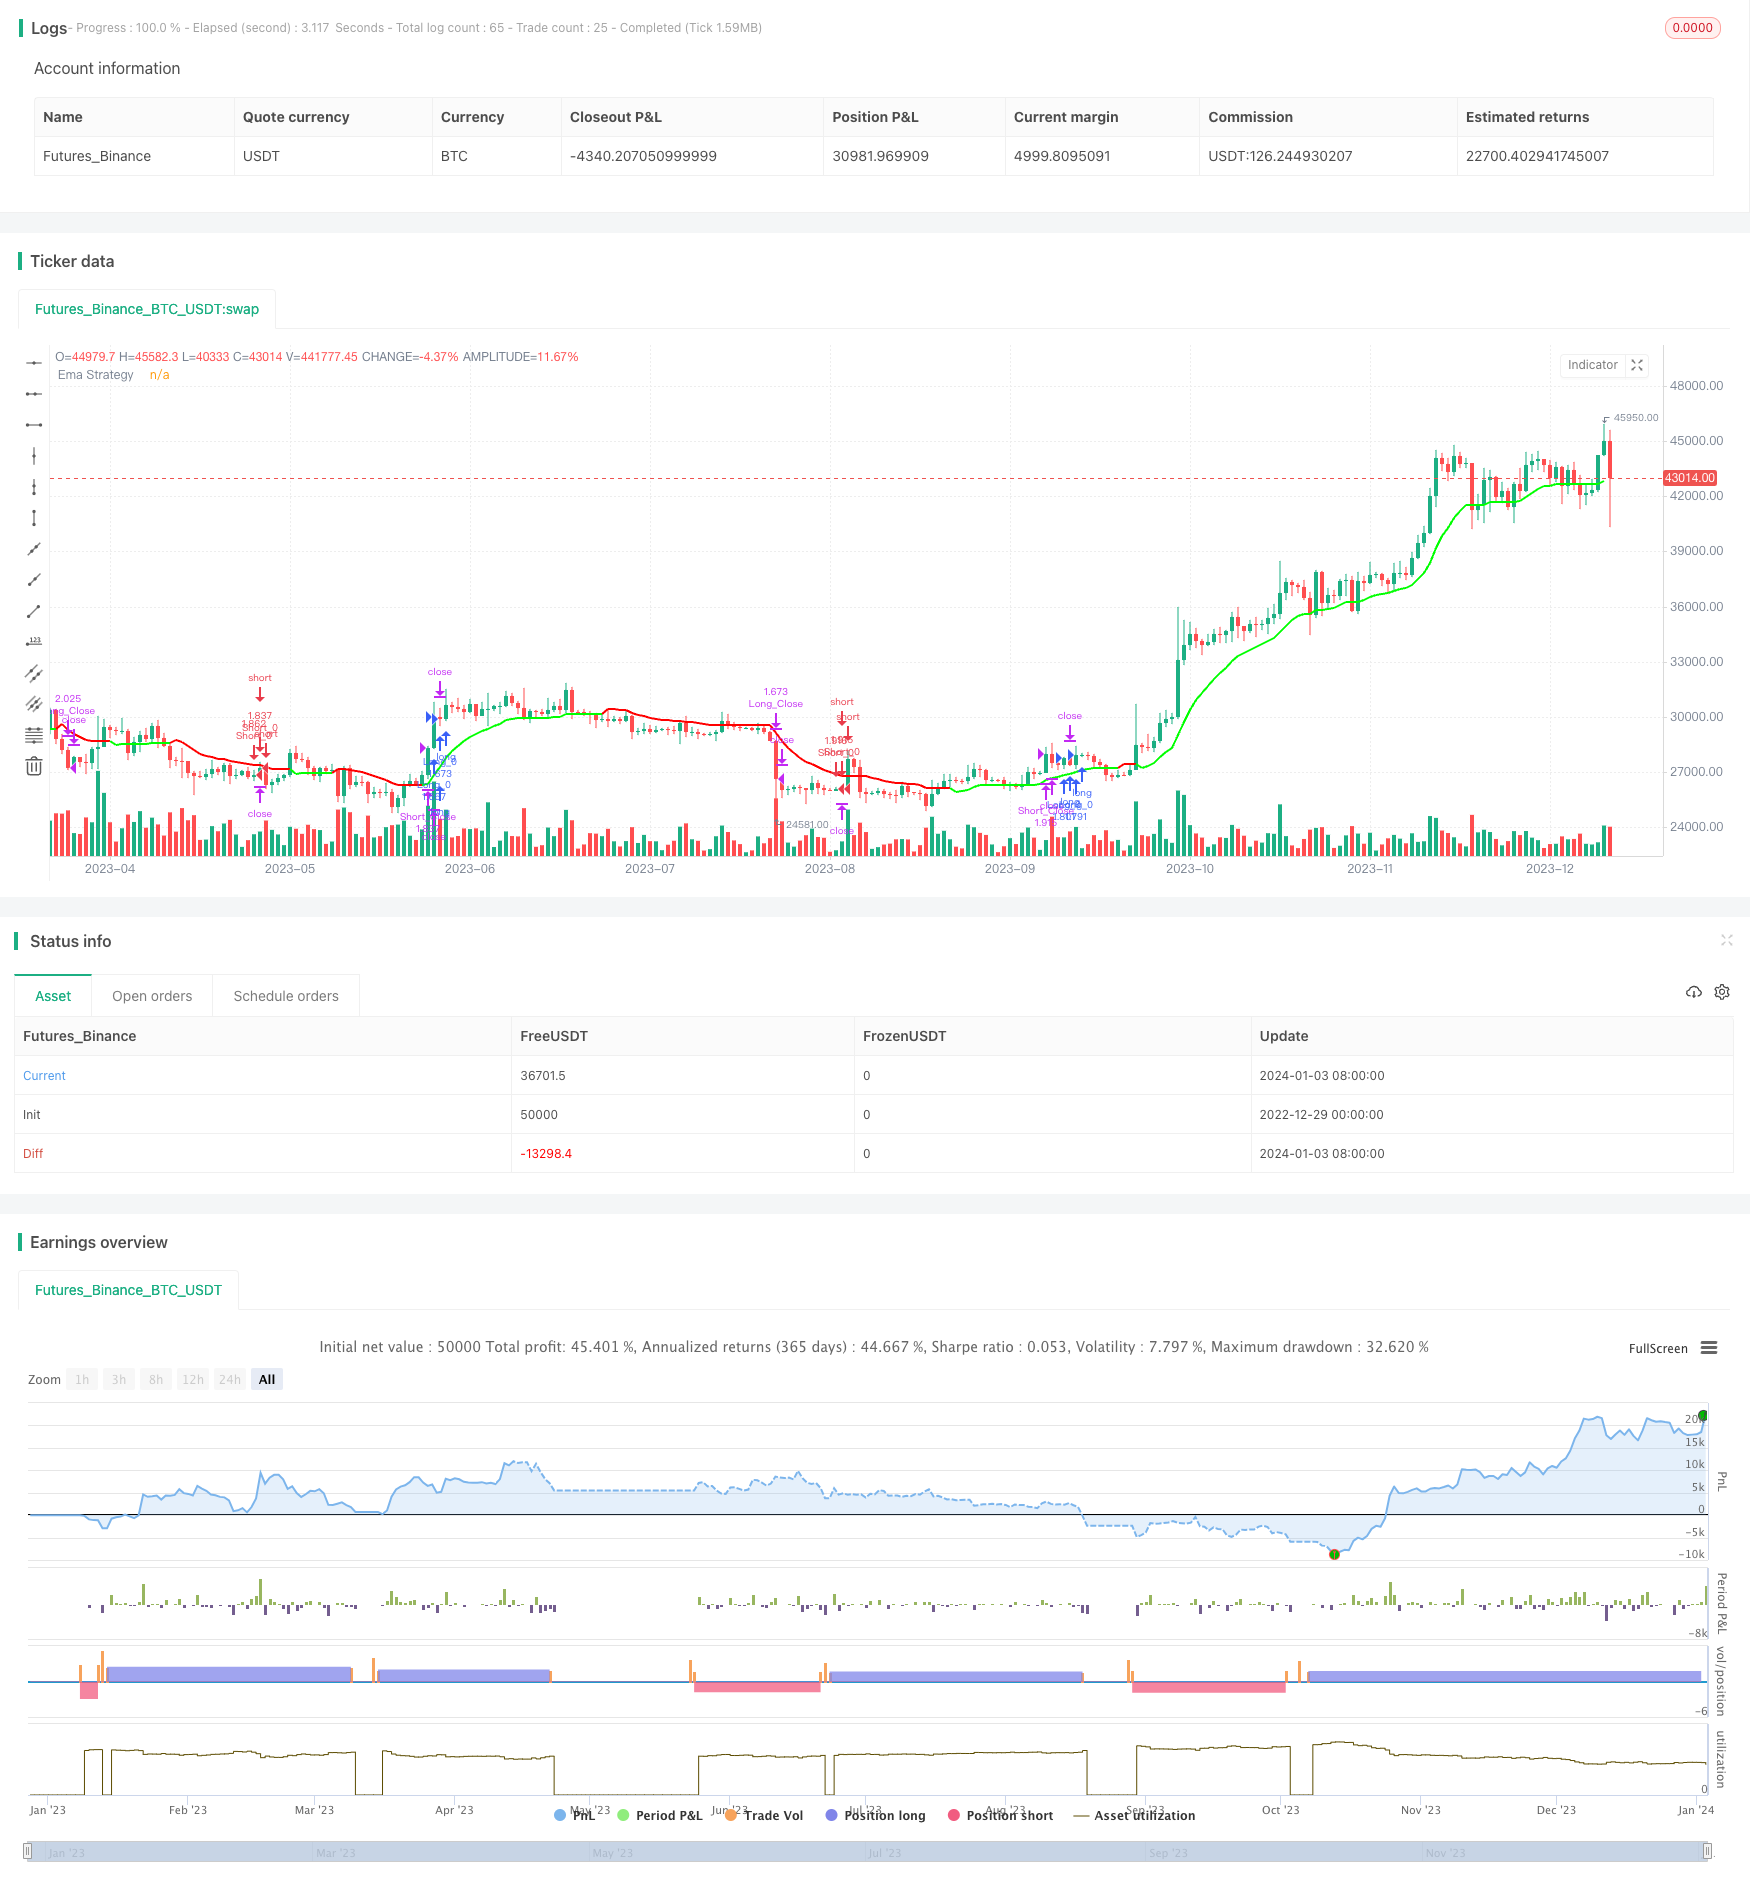
Chiến lược này sử dụng cơ chế xác nhận ba lần để tạo ra tín hiệu giao dịch, đó là chỉ số động lực xác nhận xu hướng thị trường mạnh, chỉ số siêu xu hướng xác nhận xu hướng, và chỉ số EMA làm xác nhận thêm về xu hướng. Chỉ khi cả ba chỉ số này đáp ứng các điều kiện, chiến lược sẽ tạo ra tín hiệu giao dịch nhiều hoặc ít, do đó đảm bảo chỉ chọn cơ hội giao dịch có xác suất cao.
Nguyên tắc chiến lược
Chỉ số động lực (Momentum RSI)
Chỉ số RSI động lực được sử dụng để đánh giá cường độ của xu hướng thị trường. Khi đọc lớn hơn 60, xu hướng thị trường là mạnh mẽ.
Các tín hiệu giao dịch chỉ được tạo ra trong thị trường bò và gấu.
Phân tích siêu xu hướng
Đường siêu xu hướng đại diện cho xu hướng của thị trường. Chỉ khi giá vượt qua đường siêu xu hướng thì nên cân nhắc đặt vị trí.
Khi giá từ dưới lên phá vỡ đường xu hướng siêu, chuyển thành xu hướng đa đầu; khi giá từ trên xuống phá vỡ, chuyển thành xu hướng đầu trống.
Chiến lược của EMA
- EMA và đường xu hướng hỗ trợ của nó được sử dụng để xác nhận hướng của xu hướng. Tín hiệu mua chỉ xuất hiện khi EMA phá vỡ đường xu hướng hỗ trợ lên, và tín hiệu trượt ngược lại.
Chỉ khi cả ba chỉ số này đồng thời đáp ứng các điều kiện xây dựng vị trí, tín hiệu giao dịch thực sự sẽ được phát ra. Điều này làm giảm đáng kể số lượng tín hiệu giả và tăng sự ổn định của chiến lược.
Phân tích lợi thế
Chiến lược này có tính ổn định và xác suất lợi nhuận rất cao. Những ưu điểm chính là:
Một hệ thống xác nhận nhiều lần, lọc tiếng ồn hiệu quả, chỉ chọn giao dịch có xác suất cao.
Đường xu hướng siêu động theo dõi lỗ hổng, kiểm soát rủi ro hiệu quả.
Xác định sức mạnh của xu hướng, chỉ giao dịch trong xu hướng mạnh, tránh rủi ro bổ sung.
EMA kiểm tra thêm các chỉ số để đảm bảo giao dịch đúng hướng.
Nó được định nghĩa theo tham số và có thể được tùy chỉnh theo nhu cầu của các nhà giao dịch.
Phân tích rủi ro
Rủi ro chính của chiến lược này là tín hiệu giao dịch sai do đột phá bất thường. Rủi ro chính và giải pháp bao gồm:
Rủi ro đột phá giả mạo: Tăng cơ chế xác minh đột phá
Mức độ rủi ro lớn hơn: điều chỉnh mức độ thiệt hại thích hợp.
Rủi ro đảo ngược xu hướng: Giảm thời gian nắm giữ, dừng lỗ kịp thời.
Hướng tối ưu hóa
Chiến lược này có thể được tối ưu hóa theo các hướng sau:
Các tham số tối ưu hóa: điều chỉnh các tham số chỉ số để phù hợp với nhiều giống hơn.
Tăng bộ lọc: kết hợp với nhiều chỉ số hơn, nâng cao chất lượng tín hiệu.
Chiến lược tổng hợp: kết hợp với các chiến lược khác, sử dụng lợi thế của nhau.
Dynamic Shifting: Điều chỉnh tham số theo môi trường thị trường.
Học máy: Sử dụng thuật toán để tự động tìm các tham số tối ưu.
Tóm tắt
Chiến lược này thực hiện một chiến lược giao dịch có xác nhận nhiều lần bằng cách kết hợp hiệu quả các chỉ số động lực, siêu xu hướng và EMA. Cơ chế xác minh đột phá nghiêm ngặt cũng làm cho nó có sự ổn định mạnh mẽ. Đồng thời có khả năng tùy biến và tối ưu hóa rất cao.
/*backtest
start: 2022-12-29 00:00:00
end: 2024-01-04 00:00:00
period: 1d
basePeriod: 1h
exchanges: [{"eid":"Futures_Binance","currency":"BTC_USDT"}]
*/

//@version=5
strategy('The Flash-Strategy (Momentum-RSI, EMA-crossover, ATR)', shorttitle='The Flash-Strategy (Momentum-RSI, EMA-crossover, ATR)', overlay=true,initial_capital = 1000)
//// author -  Baby_whale_to_moon

// MOM Rsi indicator
group_mom_rsi = "Rsi Of Momentum "
len = input.int(10, minval=1, title="Length Mom-Rsi", group =group_mom_rsi ,tooltip = 'This ind calculate Rsi value of Momentum we use this ind to determine power of trend')
src2 = close
mom = src2 - src2[len]
rsi_mom = ta.rsi(mom, len)
mom_rsi_val = input.int(60, minval=1, title="Mom-Rsi Limit Val", group =group_mom_rsi, tooltip = "When our Mom-Rsi value more then this we open LONG or Short, with help of this indicator we we determine the status of the trend")

// Super Trend Ind
group_supertrend = "SuperTrend indicator"
atrPeriod = input(10, "ATR Length SuperTrend", group = group_supertrend)
factor = input.float(3.0, "Factor SuperTrend", step = 0.01, group = group_supertrend)

[supertrend, direction] = ta.supertrend(factor, atrPeriod)

// Ema Indicator
group_most = "Ema indicator"
src = input(close, 'Source Ema Ind',group = group_most)
AP2 = input.int(defval=12, title='Length Ema Ind', minval=1,group = group_most)
Trail1 = ta.ema(src, AP2) //Ema func
AF2 = input.float(defval=1, title='Percent Ema Ind', minval=0.1,group = group_most) / 100
SL2 = Trail1 * AF2  // Stoploss Ema
Trail2 = 0.0
iff_1 = Trail1 > nz(Trail2[1], 0) ? Trail1 - SL2 : Trail1 + SL2
iff_2 = Trail1 < nz(Trail2[1], 0) and Trail1[1] < nz(Trail2[1], 0) ? math.min(nz(Trail2[1], 0), Trail1 + SL2) : iff_1
Trail2 := Trail1 > nz(Trail2[1], 0) and Trail1[1] > nz(Trail2[1], 0) ? math.max(nz(Trail2[1], 0), Trail1 - SL2) : iff_2

//Bull = ta.barssince(Trail1 > Trail2 and close > Trail2 and low > Trail2) < ta.barssince(Trail2 > Trail1 and close < Trail2 and high < Trail2)

//TS1 = plot(Trail1, 'ExMov', style=plot.style_line, color=Trail1 > Trail2 ? color.rgb(33, 149, 243, 100) : color.rgb(255, 235, 59, 100), linewidth=2)
//TS2 = plot(Trail2, 'ema', style=plot.style_line, color=Trail1 > Trail2 ? color.rgb(76, 175, 79, 30) : color.rgb(255, 82, 82, 30), linewidth=2)
//fill(TS1, TS2, Bull  ? color.green : color.red, transp=90)


// Strategy Sett
group_strategy = "Settings of Strategy"
Start_Time = input(defval=timestamp('01 January 2000 13:30 +0000'), title='Start Time of BackTest', group =group_strategy)
End_Time = input(defval=timestamp('30 April 2030 19:30 +0000'), title='End Time of BackTest', group =group_strategy)
dollar = input.float(title='Dollar Cost Per Position* ', defval=50000, group =group_strategy)
trade_direction = input.string(title='Trade_direction', group =group_strategy, options=['LONG', 'SHORT', 'BOTH'], defval='BOTH')
v1 = input(true, title="Version 1 - Uses SL/TP Dynamically ", group =group_strategy ,tooltip = 'With this settings our stoploss price increase or decrease with price to get better PNL score')

v2 = input(false, title="Version 2 -  Uses SL/TP Statically", group =group_strategy)
v2stoploss_input = input.float(5, title='Static Stop.Loss % Val', minval=0.01, group =group_strategy)/100
v2takeprofit_input = input.float(10, title='Static Take.Prof % Val', minval=0.01, group =group_strategy)/100

v2stoploss_level_long = strategy.position_avg_price * (1 - v2stoploss_input)
v2takeprofit_level_long = strategy.position_avg_price * (1 + v2takeprofit_input)

v2stoploss_level_short = strategy.position_avg_price * (1 + v2stoploss_input)
v2takeprofit_level_short = strategy.position_avg_price * (1 - v2takeprofit_input)

group_line = "Line Settings"
show_sl_tp = input.bool(title='  Show StopLoss - TakeProf Lines',inline = "1", defval=true, group =group_line)
show_trend_line = input.bool(title='  Show Trend Line',inline = '3' ,defval=true, group =group_line)
stoploss_colour = input.color(title='StopLoss Line Colour',inline = '2' ,defval=color.rgb(255, 255, 0), group =group_line)
up_trend_line_colour = input.color(title='Up Trend line Colour',inline = '4' ,defval=color.rgb(0, 255, 0, 30), group =group_line)
down_trend_line_colour = input.color(title='Down Trend line Colour',inline = '4' ,defval=color.rgb(255, 0, 0, 30), group =group_line)

//plot(supertrend ,color = strategy.position_size > 0 and show_sl_tp ? color.rgb(255, 0, 0) :show_sl_tp ? color.rgb(0, 255, 0) : na , style = plot.style_steplinebr,linewidth = 2)
// plot(supertrend ,color = show_sl_tp and v1 ? stoploss_colour : na , style = plot.style_steplinebr,linewidth = 2)

// plot(v2stoploss_level_long ,color = strategy.position_size > 0 and show_sl_tp and v2 ? stoploss_colour : na , style = plot.style_steplinebr,linewidth = 2)
// plot(v2stoploss_level_short ,color = strategy.position_size < 0 and show_sl_tp and v2 ? stoploss_colour : na , style = plot.style_steplinebr,linewidth = 2)
// plot(v2takeprofit_level_long  ,color = strategy.position_size > 0 and show_sl_tp and v2 ? up_trend_line_colour : na , style = plot.style_steplinebr,linewidth = 2)
// plot(v2takeprofit_level_short ,color = strategy.position_size < 0 and show_sl_tp and v2 ? up_trend_line_colour : na , style = plot.style_steplinebr,linewidth = 2)


TS2 = plot(Trail2, 'Ema Strategy', style=plot.style_line, color=show_trend_line and Trail1 < Trail2 ? down_trend_line_colour : show_trend_line ? up_trend_line_colour  : na, linewidth=2)

// bgcolor(buy_signal ? color.rgb(0, 230, 119, 80) : na)
// bgcolor(sell_signal ? color.rgb(255, 82, 82, 80) : na)

Time_interval = true
buy_signal = Trail1 > Trail2 and direction < 0 and rsi_mom > mom_rsi_val and Time_interval
sell_signal =Trail1 < Trail2 and direction > 0 and rsi_mom > mom_rsi_val and Time_interval


// Strategy entries
if strategy.opentrades == 0 and buy_signal and ( trade_direction == 'LONG' or trade_direction == 'BOTH')
    strategy.entry('Long_0', strategy.long, qty=dollar / close)

if strategy.opentrades == 0 and sell_signal and ( trade_direction == 'SHORT' or trade_direction == 'BOTH')
    strategy.entry('Short_0', strategy.short, qty=dollar / close)


if close < supertrend and v1
    strategy.exit('Long_Close',from_entry = "Long_0", stop=supertrend, qty_percent=100)
if  v2 and strategy.position_size > 0
    strategy.exit('Long_Close',from_entry = "Long_0", stop=v2stoploss_level_long,limit= v2takeprofit_level_long  , qty_percent=100)

if close > supertrend and v1
    strategy.exit('Short_Close',from_entry = "Short_0", stop=supertrend, qty_percent=100)
if  v2 and strategy.position_size < 0
    strategy.exit('Short_Close',from_entry = "Short_0", stop=v2stoploss_level_short,limit= v2takeprofit_level_short ,qty_percent=100)