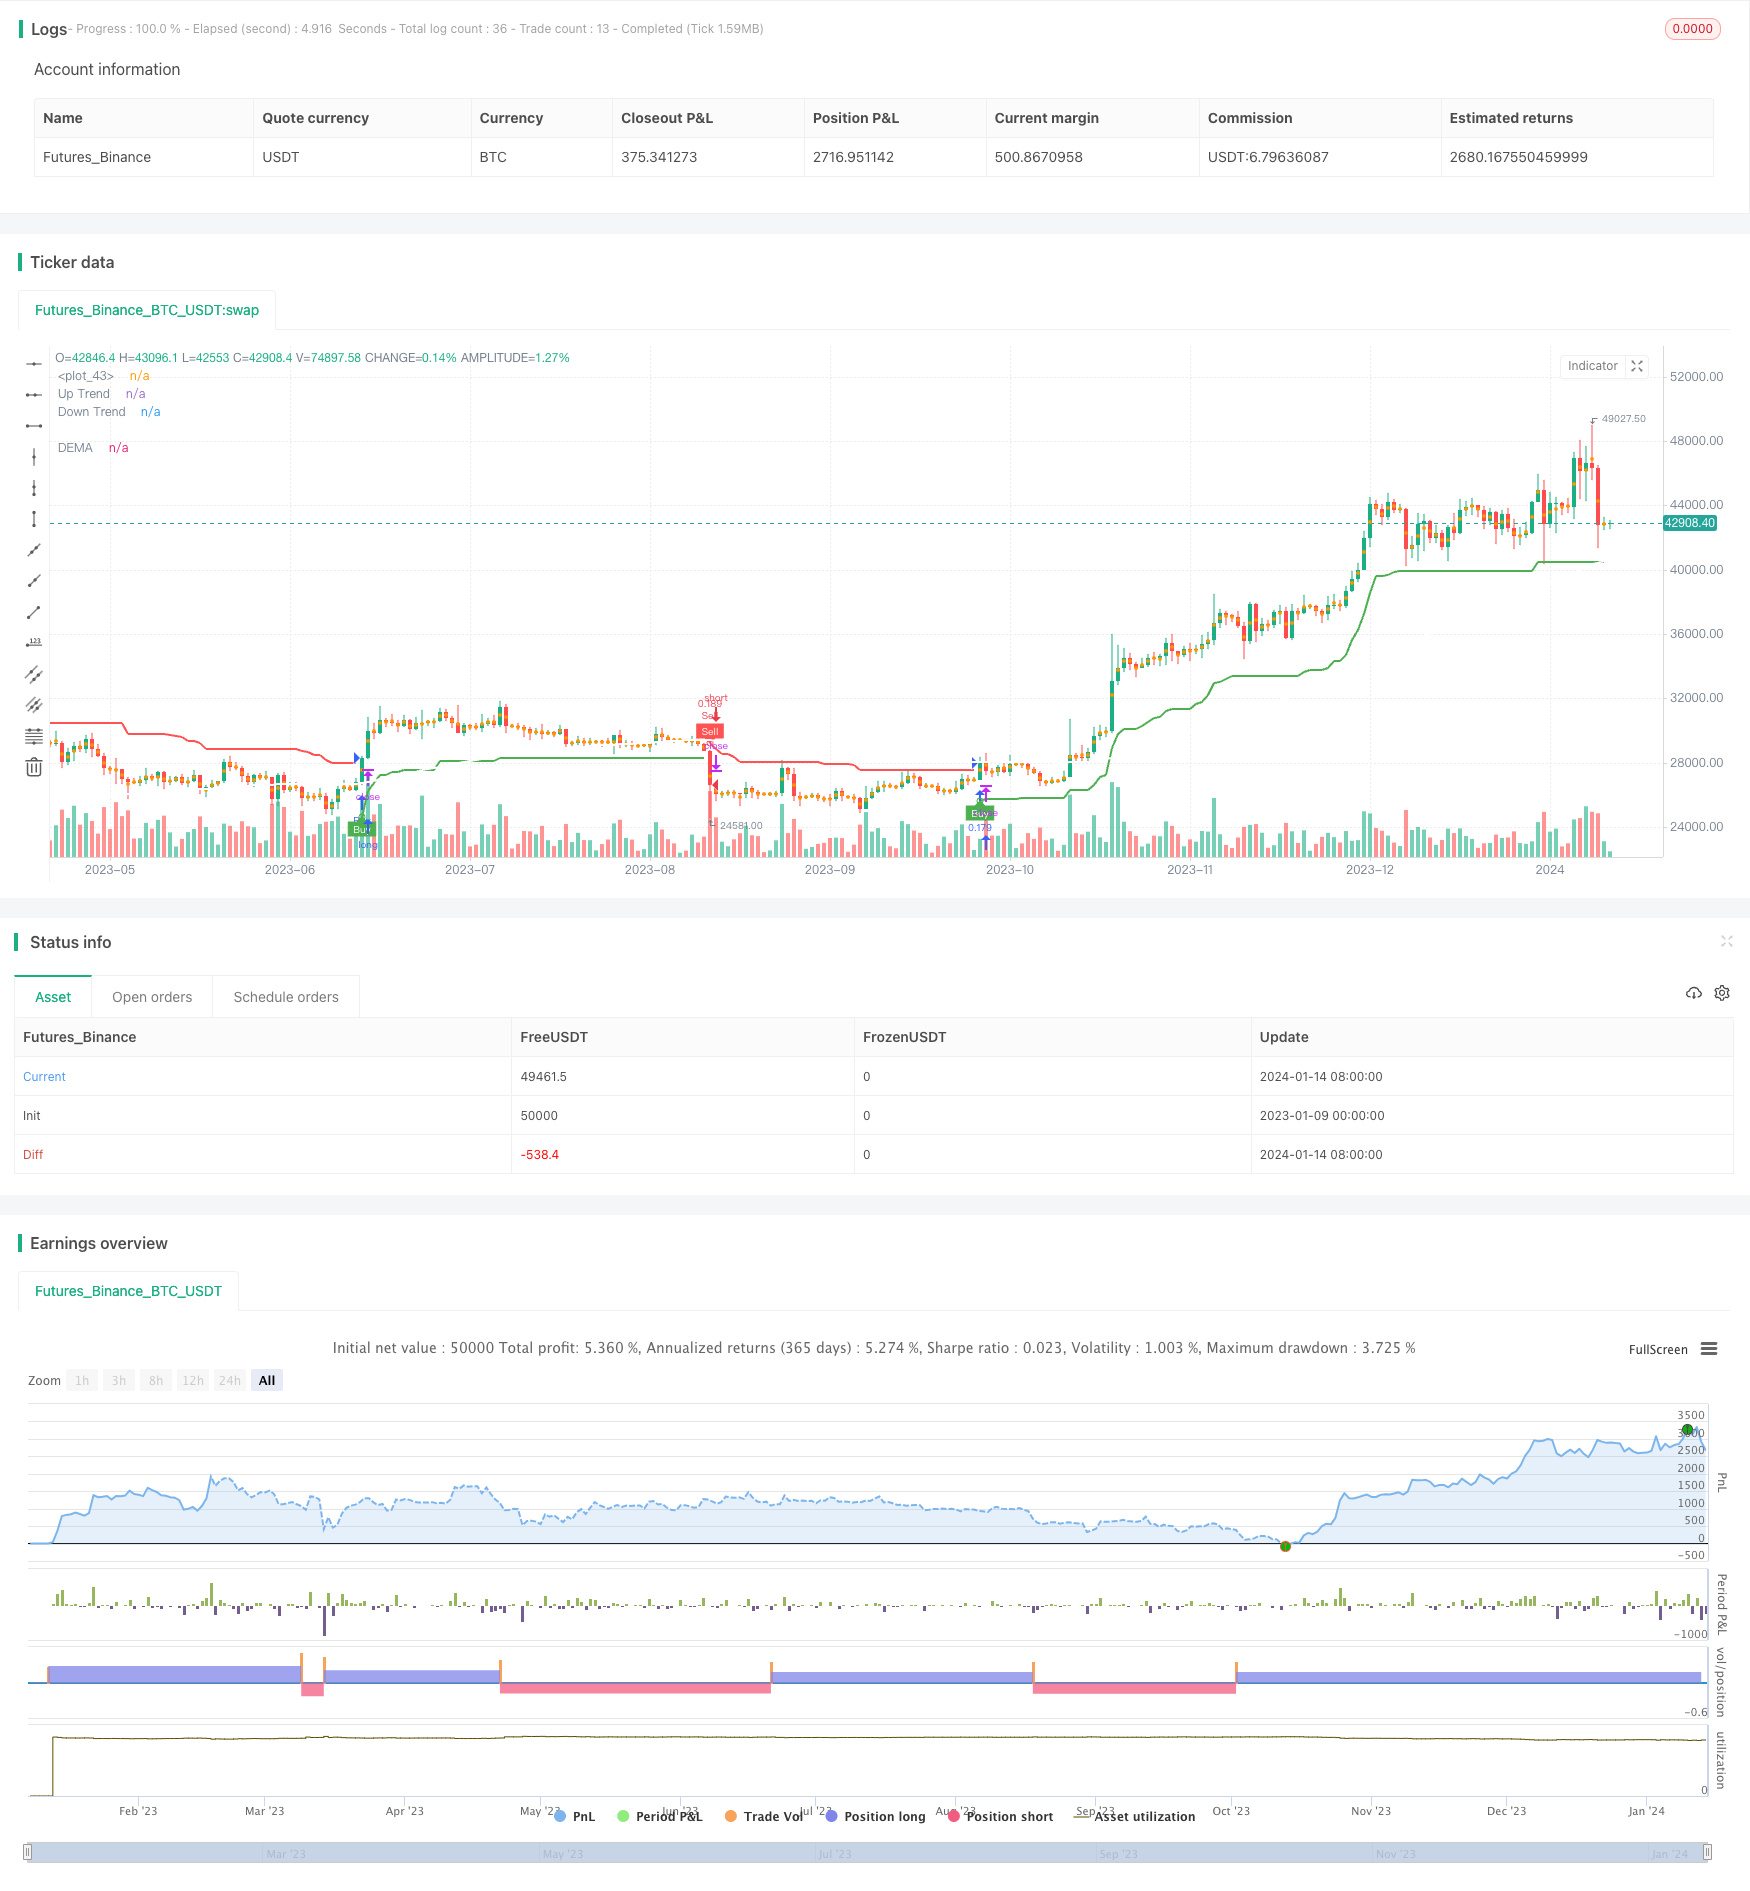
Chiến lược theo dõi xu hướng kép DEMA của Super Trend Indicator

Tổng quan
Chiến lược theo dõi xu hướng kép là một chiến lược kết hợp các chỉ số siêu xu hướng, đường trung bình di chuyển hai chỉ số (DEMA) và dải Brin. Nó nhằm tận dụng lợi thế của nhiều chỉ số kỹ thuật để bắt kịp tín hiệu mua và bán khi xu hướng đảo ngược.
Nguyên tắc chiến lược
Chiến lược này bao gồm ba phần chính:
Chỉ số siêu xu hướng: tính toán đường phá vỡ lên và đường phá vỡ xuống để xác định hướng của xu hướng hiện tại. Khi giá từ dưới lên phá vỡ đường siêu xu hướng, tạo ra tín hiệu mua; Khi từ trên xuống phá vỡ, tạo ra tín hiệu bán.
DEMA: một chỉ số theo dõi xu hướng, kết hợp các tính năng của trung bình di chuyển đơn giản và trung bình di chuyển chỉ số, có thể phản ứng nhanh hơn với sự thay đổi giá. DEMA 200 ngày được thiết lập trong chiến lược để xác định hướng xu hướng dài hạn.
Dải Brin: thể hiện phạm vi biến động của giá. Dải Brin thu hẹp hoặc mở rộng bất thường, cho thấy có thể có xu hướng đảo ngược.
Khi cả chỉ số siêu xu hướng và DEMA đều phát ra tín hiệu mua / bán, nghĩa là vào vị trí tương ứng. Ngoài ra, sự bất thường của Brin cũng có thể là tín hiệu phán đoán phụ trợ.
Lợi thế chiến lược
- Các nhà nghiên cứu đã nghiên cứu các yếu tố khác nhau trong việc sử dụng các công cụ này.
- Chỉ số siêu xu hướng không nhạy cảm với sự thay đổi giá nhỏ, chỉ phát ra tín hiệu tại các điểm chuyển hướng, tránh giao dịch quá thường xuyên.
- DEMA làm phẳng đường cong, đánh giá xu hướng dài hạn chính xác và đáng tin cậy.
- Brin đưa ra phán đoán hỗ trợ về sự thay đổi.
Rủi ro và giải pháp
- Các tham số chỉ số siêu xu hướng được thiết lập quá nhạy cảm, có thể tạo ra nhiều tiếng ồn hơn. Các tham số ATR và tham số nhân có thể được điều chỉnh để tối ưu hóa.
- Chu kỳ DEMA quá dài có khả năng theo dõi xu hướng kém. Các tham số có thể được thử nghiệm rút ngắn xuống còn 100 ngày.
- Trong trường hợp kết hợp nhiều chỉ số, tín hiệu không nhất quán. Trong trường hợp này, các chỉ số siêu xu hướng có thể được sử dụng làm tín hiệu chính.
Hướng tối ưu hóa
- Kiểm tra các thiết lập tham số khác nhau của chu kỳ và nhân ATR để tìm tham số tối ưu cho chỉ số siêu xu hướng.
- Tối ưu hóa tham số chu kỳ DEMA.
- Thêm các chỉ số hỗ trợ phán đoán khác như KDJ, MACD, v.v.
- Thêm chiến lược dừng lỗ.
Tóm tắt
Chiến lược theo dõi xu hướng kép kết hợp nhiều chỉ số, tích hợp các lợi thế của siêu xu hướng, DEMA và ba dây Brin, nâng cao chất lượng tín hiệu trong khi nắm bắt xu hướng, có thể mong đợi hiệu quả chiến lược tốt hơn thông qua tối ưu hóa tham số. Việc bổ sung cơ chế dừng lỗ cũng là trọng tâm tối ưu hóa trong tương lai.
/*backtest
start: 2023-01-09 00:00:00
end: 2024-01-15 00:00:00
period: 1d
basePeriod: 1h
exchanges: [{"eid":"Futures_Binance","currency":"BTC_USDT"}]
*/

//@version=4
strategy("Supertrend + DEMA + Bollinger Bands", overlay=true, default_qty_type=strategy.percent_of_equity, default_qty_value=10, precision=2)

// Input parameters for Supertrend
atrLength = input(title="ATR Period", type=input.integer, defval=12)
src = input(hl2, title="Source")
multiplier = input(title="ATR Multiplier", type=input.float, step=0.1, defval=3.0)
changeATR = input(title="Change ATR Calculation Method?", type=input.bool, defval=true)
showSupertrend = input(title="Show Supertrend Indicator?", type=input.bool, defval=true)

// Input parameters for DEMA
demaLength = input(200, title="DEMA Period")
showDEMA = input(title="Show DEMA Indicator?", type=input.bool, defval=true)

// Calculate ATR for Supertrend
atr2 = sma(tr, atrLength)
atr = changeATR ? atr(atrLength) : atr2

// Calculate Supertrend
up = src - (multiplier * atr)
up1 = nz(up[1], up)
up := close[1] > up1 ? max(up, up1) : up

dn = src + (multiplier * atr)
dn1 = nz(dn[1], dn)
dn := close[1] < dn1 ? min(dn, dn1) : dn

trend = 1
trend := nz(trend[1], trend)
trend := trend == -1 and close > dn1 ? 1 : trend == 1 and close < up1 ? -1 : trend

// Plot Supertrend
upPlot = plot(showSupertrend ? (trend == 1 ? up : na) : na, title="Up Trend", style=plot.style_linebr, linewidth=2, color=color.new(color.green, 0))
buySignal = trend == 1 and trend[1] == -1
plotshape(buySignal ? up : na, title="UpTrend Begins", location=location.absolute, style=shape.circle, size=size.tiny, color=color.new(color.green, 0))
plotshape(buySignal ? up : na, title="Buy", text="Buy", location=location.absolute, style=shape.labelup, size=size.tiny, color=color.new(color.green, 0), textcolor=color.new(color.white, 0))

dnPlot = plot(showSupertrend ? (trend == 1 ? na : dn) : na, title="Down Trend", style=plot.style_linebr, linewidth=2, color=color.new(color.red, 0))
sellSignal = trend == -1 and trend[1] == 1
plotshape(sellSignal ? dn : na, title="DownTrend Begins", location=location.absolute, style=shape.circle, size=size.tiny, color=color.new(color.red, 0))
plotshape(sellSignal ? dn : na, title="Sell", text="Sell", location=location.absolute, style=shape.labeldown, size=size.tiny, color=color.new(color.red, 0), textcolor=color.new(color.white, 0))

mPlot = plot(ohlc4, title="", style=plot.style_circles, linewidth=0)

longFillColor = (trend == 1 ? color.new(color.green, 80) : color.new(color.white, 0))
shortFillColor = (trend == -1 ? color.new(color.red, 80) : color.new(color.white, 0))

fill(mPlot, upPlot, title="UpTrend Highlighter", color=longFillColor)
fill(mPlot, dnPlot, title="DownTrend Highlighter", color=shortFillColor)

// Alert conditions
alertcondition(buySignal, title="Custom Supertrend Buy", message="Custom Supertrend Buy!")
alertcondition(sellSignal, title="Custom Supertrend Sell", message="Custom Supertrend Sell!")

// Calculate DEMA
ema1 = ema(close, demaLength)
dema = 2 * ema1 - ema(ema1, demaLength)

// Plot DEMA with white color
plot(showDEMA ? dema : na, color=color.new(color.white, 0), title="DEMA", linewidth=2)

// Add push notification on mobile if buy and sell occurred
if (buySignal)
    strategy.entry("Buy", strategy.long)
    strategy.exit("Sell")
    alert("Buy Signal - Supertrend")

if (sellSignal)
    strategy.entry("Sell", strategy.short)
    strategy.exit("Cover")
    alert("Sell Signal - Supertrend")