Chiến lược giao dịch ngắn hạn phá vỡ động lượng
Tổng quan
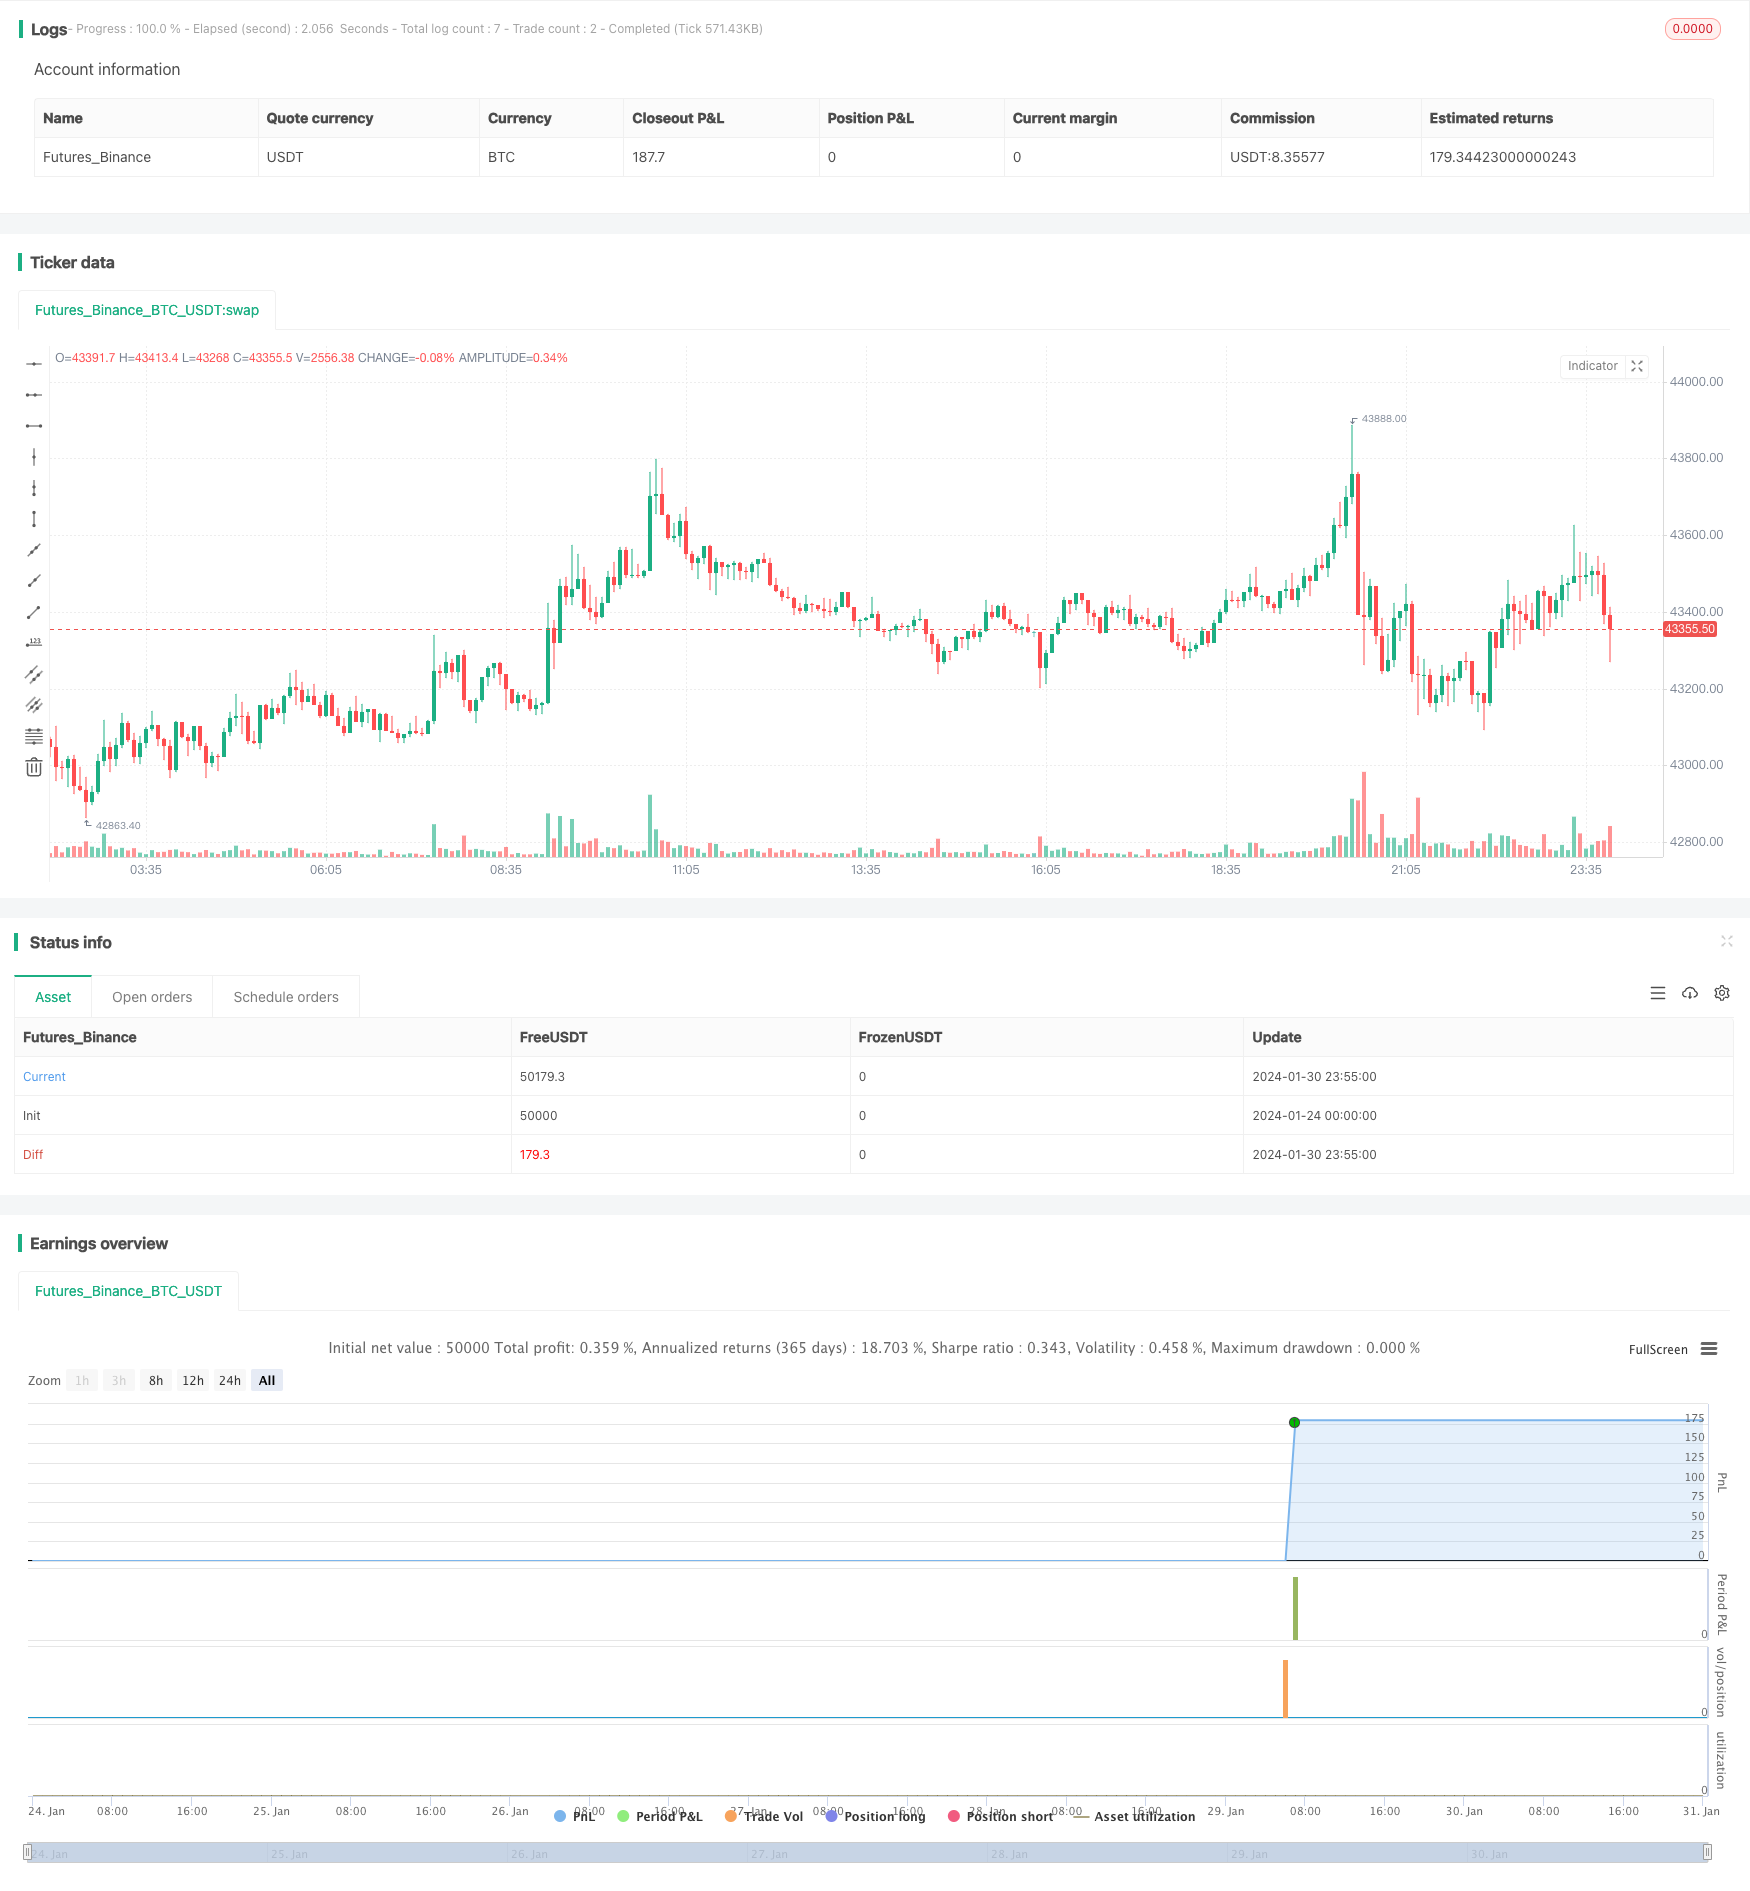
Chiến lược này theo dõi dữ liệu giao dịch SPY, kết hợp với các tín hiệu của các chỉ số kỹ thuật khác nhau như đường trung bình di chuyển, MACD, RSI, để đánh giá chính xác các xu hướng ngắn hạn và đưa ra quyết định mua và bán để kiếm lợi nhuận từ giao dịch ngắn hạn.
Nguyên tắc chiến lược
Lập luận cốt lõi của chiến lược dựa trên các chỉ số kỹ thuật sau đây để đánh giá xu hướng ngắn hạn và thời điểm nhập cảnh:
- Các đường cong vàng và đường cong chết của đường trung bình di chuyển chỉ số ((EMA) vào ngày 5 và 13 được sử dụng để xác định sự biến đổi của xu hướng trượt.
- Chỉ số MACD đánh giá liệu có động lực tăng lên hay không.
- Chỉ số ADX đánh giá xu hướng.
- Chỉ số RSI đánh giá cường độ của xu hướng.
Bằng cách tối ưu hóa các tham số chỉ số trên, đánh giá điểm chuyển đổi đa không quan trọng. Khi đáp ứng 5⁄6 điều kiện, hiển thị tín hiệu trắng L hoặc S, và khi hoàn toàn đáp ứng sáu điều kiện, hiển thị tín hiệu hình△ vàng khi kết thúc biểu đồ.
Điều kiện tạo ra tín hiệu mua:
EMA 5 ngày lớn hơn EMA 13 ngày và đường MACD thấp hơn 0,5 và ADX cao hơn 20 và đường dao động MACD lớn hơn 0 và đường tín hiệu cao hơn -0.1 và RSI cao hơn 40
Điều kiện để tạo ra tín hiệu bán hàng:
EMA 5 ngày nhỏ hơn EMA 13 ngày và đường MACD cao hơn -0.5 và ADX cao hơn 20 và đường tín hiệu thấp hơn 0 và đường dao động MACD nhỏ hơn 0 và RSI thấp hơn 60
Phân tích lợi thế
Chiến lược này có những ưu điểm sau:
- Kết hợp nhiều tín hiệu chỉ số, phán đoán chính xác hơn.
- Thông qua các tham số tối ưu hóa, sự cân bằng giữa độ nhạy và độ chính xác của phán đoán.
- Dấu hiệu thông minh và rõ ràng, và ngưỡng hoạt động thấp.
- Nó phù hợp với giao dịch ngắn hạn và phù hợp với sở thích rủi ro của hầu hết các nhà đầu tư.
- Cân nhắc nhu cầu hoạt động của ổ cứng, tránh biến động cao trong thời gian cuối.
Phân tích rủi ro
Chiến lược này cũng có những rủi ro sau:
- Thiết lập tham số không đúng có thể dẫn đến nguy cơ sai lầm. Cần thử nghiệm và tối ưu hóa liên tục.
- Một giống duy nhất, không thể phân tán rủi ro trong ngành và phân bổ tài sản.
- Các nhà giao dịch thường xuyên sẽ phải trả các khoản phí giao dịch và rủi ro trượt.
- Không có thời gian để xây dựng kho, có thể bỏ lỡ một số cơ hội.
Hướng tối ưu hóa
Chiến lược này có thể được tối ưu hóa từ các khía cạnh sau:
- Kiểm tra thay đổi các thiết lập tham số để tăng độ chính xác phán đoán.
- Tăng chỉ số dừng lỗ để kiểm soát tổn thất đơn lẻ.
- Tối ưu hóa thời gian mở vị trí, lọc thời gian biến động cao của mốc sau.
- Thêm các giống khác vào chiến lược.
- Kết hợp với thuật toán học máy để cải thiện khả năng tự điều chỉnh tham số.
Tóm tắt
Chiến lược này rất phù hợp cho giao dịch ngắn hạn bằng cách theo dõi dữ liệu SPY, kết hợp với nhiều chỉ số kỹ thuật như trung bình di chuyển, MACD, RSI để đánh giá xu hướng ngắn hạn, tần suất hoạt động cao, rút lui thấp. Có thể tiếp tục tối ưu hóa từ nhiều chiều, có không gian cải tiến lớn.
/*backtest
start: 2024-01-24 00:00:00
end: 2024-01-31 00:00:00
period: 5m
basePeriod: 1m
exchanges: [{"eid":"Futures_Binance","currency":"BTC_USDT"}]
*/

//@version=5
strategy(title="SPY 1 Minute Day Trader", overlay=true)

//This script has been created to take into account how the following variables impact trend for SPY 1 Minute
//The SPY stop losses/take profit have been set at 30 cents which equates to 15 cents on SPY 1 DTE ATM contracts
//5 ema vs 13 ema : A cross establishes start of trend
//MACD (Line, Signal & Slope) : If you have momentum
//ADX : if you are trending
//RSI : If the trend has strength
//The above has been optimized to determine pivot points in the trend using key values for these 6 indicators
//bounce up = ema5 > ema13 and macdLine < .5 and adx > 20 and macdSlope > 0 and signalLine > -.1 and rsiSignal > 40
//bounce down = ema5 < ema13 and macdLine > -.5 and adx > 20 and signalLine < 0 and macdSlope < 0 and rsiSignal < 60
//White L's indicate that 5 of 6 conditions are met due to impending uptrend w/ missing one in green below it
//Yellow L's indicate that 6 of 6 conditions still are met
//White S's indicate that 5 of 6 conditions are met due to impending downtrend w/ missing condition in red above it
//Yellow S's indicate that 6 of 6 conditions still are met
//After a downtrend or uptrend is established, once it closes it can't repeat for 10 minutes
//Won't open any trades on last two minutes of any hours to avoid volatility
//Will close any open trades going into last minute of hour

// Initialize variables
var float long_entry_price = na
var float short_entry_price = na
var float stop_loss = na
var float take_profit = na
var float short_stop_loss = na
var float short_take_profit = na
var float option_SL = 0.3 //approx 15 cents on SPY 1 DTE
var float option_TP = 0.3 //approx 15 cents on SPY 1 DTE
var long_entry_time = 0
var short_entry_time = 0
var allow_long_entry = true
var allow_short_entry = true
var allow_trades = true
var hourlyclose = 0
var notify = 0
var shortnotify = 0

// Calculate the EMAs & SMAs
ema5 = ta.ema(close, 5)
ema13 = ta.ema(close, 13)
sma20 = ta.sma(close, 20)

// Input parameters
fastLength = input.int(12, minval=1, title="Fast Length")
slowLength = input.int(26, minval=1, title="Slow Length")
signalLength = input.int(9, minval=1, title="Signal Smoothing")

// Inputs
length = input.int(14, "Length")
smoothK = input.int(3, "SmoothK")
src = input(close, "Source")
overbought = input.float(80, "Overbought")
oversold = input.float(20, "Oversold")

//Stochastic Calculation
highestHigh = ta.highest(src, length)
lowestLow = ta.lowest(src, length)
k = 100 * ((src - lowestLow) / (highestHigh - lowestLow))
d = ta.sma(k, smoothK)

// Calculate MACD
[macdLines, signalLines, _] = ta.macd(close, fastLength, slowLength, signalLength)

// Calculate slope of MACD line
macdSlope = (macdLines - macdLines[1]) / (bar_index - bar_index[1])

// Calculate the RSI
rsiValue = ta.rsi(close, 5)

// Calculate the signal line as the SMA of the RSI for 5 minute over 9 periods
rsiSignal = ta.sma(rsiValue, 9)

// Calculate MACD
[macdLine, signalLine, _] = ta.macd(close, 12, 26, 9)

// Length of the ATR
atr_length = input.int(14, title="ATR Length", minval=1)

// Calculate the True Range
tr = ta.tr(true)

// Calculate the ATR
atr = ta.atr(atr_length)

// Length of the ADX
len = input.int(14, minval=1)

// Set minimum number of bars between trades
min_bars_between_trades = 10

// Calculate the Directional Movement
up = ta.change(high)
down = -ta.change(low)
plusDM = na(up) ? na : (up > down and up > 0 ? up : 0)
minusDM = na(down) ? na : (down > up and down > 0 ? down : 0)

// Calculate the Smoothed Directional Movement
plusDI = 100 * ta.ema(plusDM, len) / ta.ema(tr, len)
minusDI = 100 * ta.ema(minusDM, len) / ta.ema(tr, len)

// Calculate the Directional Index (DX)
DX = 100 * math.abs(plusDI - minusDI) / (plusDI + minusDI)

// Calculate the ADX
adx = ta.ema(DX, len)

// Get high, low, and close prices
highPrice = high
lowPrice = low
closePrice = close

// Determine buy and sell signals - Tried to optimize as much as possible - changing these do impact results
buy_signal = ema5 > ema13 and macdLine < .5 and adx > 20 and macdSlope > 0 and signalLine > -.1 and rsiSignal > 40
short_buy_signal = ema5 < ema13 and macdLine > -.5 and adx > 20 and signalLine < 0 and macdSlope < 0 and rsiSignal < 60

// Define long entry conditions
C1 = ema5 > ema13 ? 1 : 0 //E below bar when only one missing
C2 = d < 70 ? 1 : 0 //no longer part of signal - but was Smoothed Stoicastic
C3 = macdLine < .5 ? 1 : 0 //M below bar when only one missing
C4 = adx > 20 ? 1 : 0 //A below bar when only one missing
C5 = macdSlope > 0 ? 1 : 0 //% below bar when only one missing
C6 = signalLine > -.01 ? 1 : 0 //S (MACD Signal) below bar when only one missing
C7 = rsiSignal > 50 ? 1 : 0 //R below bar when only one missing

// Define short entry conditions
C8 = ema5 < ema13 ? 1 : 0 //E above bar when only one missing
C9 = d > 40 ? 1 : 0 //no longer part of signal - but was Smoothed Stoicastic
C10 = macdLine > -0.5 ? 1 : 0 //M above bar when only one missing
C11 = adx > 20 ? 1 : 0 //A above bar when only one missing
C12 = macdSlope < 0 ? 1 : 0 //% above bar when only one missing
C13 = signalLine < 0 ? 1 : 0 //S (MACD Signal) above bar when only one missing
C14 = rsiSignal < 50 ? 1 : 0 //R above bar when only one missing

// Long or Short Incoming denoted by white color and gold means all conditions met
plotchar((C1 + C3 + C4 + C5 + C6 + C7) == 5 ? 1 : na, title="Pivot Up White", char="L", location=location.belowbar, color=color.white, size = size.tiny)
plotchar((C8 + C10 + C11 + C12 + C13 + C14) == 5 ? 1 : na, title="Pivot Down White", char="S", location=location.abovebar, color=color.white, size = size.tiny)
plotchar((C1 + C3 + C4 + C5 + C6 + C7) > 5 ? 1 : na, title="Pivot Up Gold", char="L", location=location.belowbar, color=color.yellow, size = size.tiny)
plotchar((C8 + C10 + C11 + C12 + C13 + C14) > 5 ? 1 : na, title="Pivot Down Gold", char="S", location=location.abovebar, color=color.yellow, size = size.tiny)
plotchar((C1 + C3 + C4 + C5 + C6 + C7) >= 5 and (C1) != 1 ? 1 : na, title="Missing", char = "", text="E", location=location.belowbar, color=color.green, size = size.small)
plotchar((C1 + C3 + C4 + C5 + C6 + C7) >= 5 and (C3) != 1 ? 1 : na, title="Missing", char = "", text="M", location=location.belowbar, color=color.green, size = size.small)
plotchar((C1 + C3 + C4 + C5 + C6 + C7) >= 5 and (C4) != 1 ? 1 : na, title="Missing", char = "", text="A", location=location.belowbar, color=color.green, size = size.small)
plotchar((C1 + C3 + C4 + C5 + C6 + C7) >= 5 and (C5) != 1 ? 1 : na, title="Missing", char = "", text="%", location=location.belowbar, color=color.green, size = size.small)
plotchar((C1 + C3 + C4 + C5 + C6 + C7) >= 5 and (C6) != 1 ? 1 : na, title="Missing", char = "", text="S", location=location.belowbar, color=color.green, size = size.small)
plotchar((C1 + C3 + C4 + C5 + C6 + C7) >= 5 and (C7) != 1 ? 1 : na, title="Missing", char = "", text="R", location=location.belowbar, color=color.green, size = size.small)
plotchar((C8 + C10 + C11 + C12 + C13 + C14) >= 5 and (C8) != 1 ? 1 : na, title="Missing", char = "", text="E", location=location.abovebar, color=color.red, size = size.small)
plotchar((C8 + C10 + C11 + C12 + C13 + C14) >= 5 and (C10) != 1 ? 1 : na, title="Missing", char = "", text="M", location=location.abovebar, color=color.red, size = size.small)
plotchar((C8 + C10 + C11 + C12 + C13 + C14) >= 5 and (C11) != 1 ? 1 : na, title="Missing", char = "", text="A", location=location.abovebar, color=color.red, size = size.small)
plotchar((C8 + C10 + C11 + C12 + C13 + C14) >= 5 and (C12) != 1 ? 1 : na, title="Missing", char = "", text="%", location=location.abovebar, color=color.red, size = size.small)
plotchar((C8 + C10 + C11 + C12 + C13 + C14) >= 5 and (C13) != 1 ? 1 : na, title="Missing", char = "", text="S", location=location.abovebar, color=color.red, size = size.small)
plotchar((C8 + C10 + C11 + C12 + C13 + C14) >= 5 and (C14) != 1 ? 1 : na, title="Missing", char = "", text="R", location=location.abovebar, color=color.red, size = size.small)

// Execute buy and sell orders
if buy_signal and allow_trades and allow_long_entry  //Don't buy on last 2 minutes of hour
    long_entry_price := open
    strategy.entry("Pivot Up", strategy.long)
    stop_loss := long_entry_price - option_SL
    take_profit := long_entry_price + option_TP
    long_entry_time := time
    allow_long_entry := false
    allow_trades := false
    notify := 1
plotshape(notify == 1 ? 1 : na, "Pivot Up", style=shape.triangleup, offset = 1, location=location.belowbar, size=size.normal, textcolor = color.orange, color=color.orange)
if notify == 1
    notify := notify - 1

if short_buy_signal and allow_trades and allow_short_entry  //Don't buy on last 2 minutes of hour
    short_entry_price := open
    strategy.entry("Pivot Down", strategy.short)
    short_stop_loss := short_entry_price + option_SL
    short_take_profit := short_entry_price - option_TP
    short_entry_time := time
    allow_short_entry := false
    allow_trades := false
    shortnotify := 1
plotshape(shortnotify == 1 ? 1 : na, "Pivot Down", style=shape.triangledown, offset = 1, location=location.abovebar, size=size.normal, textcolor = color.orange, color=color.orange)
if shortnotify == 1
    shortnotify := shortnotify - 1

// Take scalp when in a position and 5 or more parameters are met!
if strategy.position_size != 0 and (C1 + C3 + C4 + C5 + C6 + C7) >5
    strategy.exit("Exit Longs", "Pivot Up", stop=stop_loss, limit = take_profit)
else if strategy.position_size != 0 and (C8 + C10 + C11 + C12 + C13 + C14) >5
    strategy.exit("Exit Shorts", "Pivot Down", stop=short_stop_loss, limit = short_take_profit)

// Reset allow_trades after cool-down period of min_bars_between_trades bars set above
if time > long_entry_time + (time - time[1]) * min_bars_between_trades
    allow_long_entry := true
    allow_trades := true

if time > short_entry_time + (time - time[1]) * min_bars_between_trades
    allow_short_entry := true
    allow_trades := true

// Close all positions at the end of the trading day and when volatile hours approach!
if  strategy.position_size != 0
    strategy.close("Pivot Up")
    strategy.close("Pivot Down")
    hourlyclose := 1
plotshape(hourlyclose == 1 ? 1 : na, "Suggested Volatile Hour Close", text="Suggested Volatile Hour Close", offset = 1, style=shape.triangledown, location=location.abovebar, size=size.tiny, textcolor = color.orange, color=color.orange)
if hourlyclose == 1
    hourlyclose := hourlyclose - 1