Chiến lược siết chặt đà Lazy Bear
Tổng quan
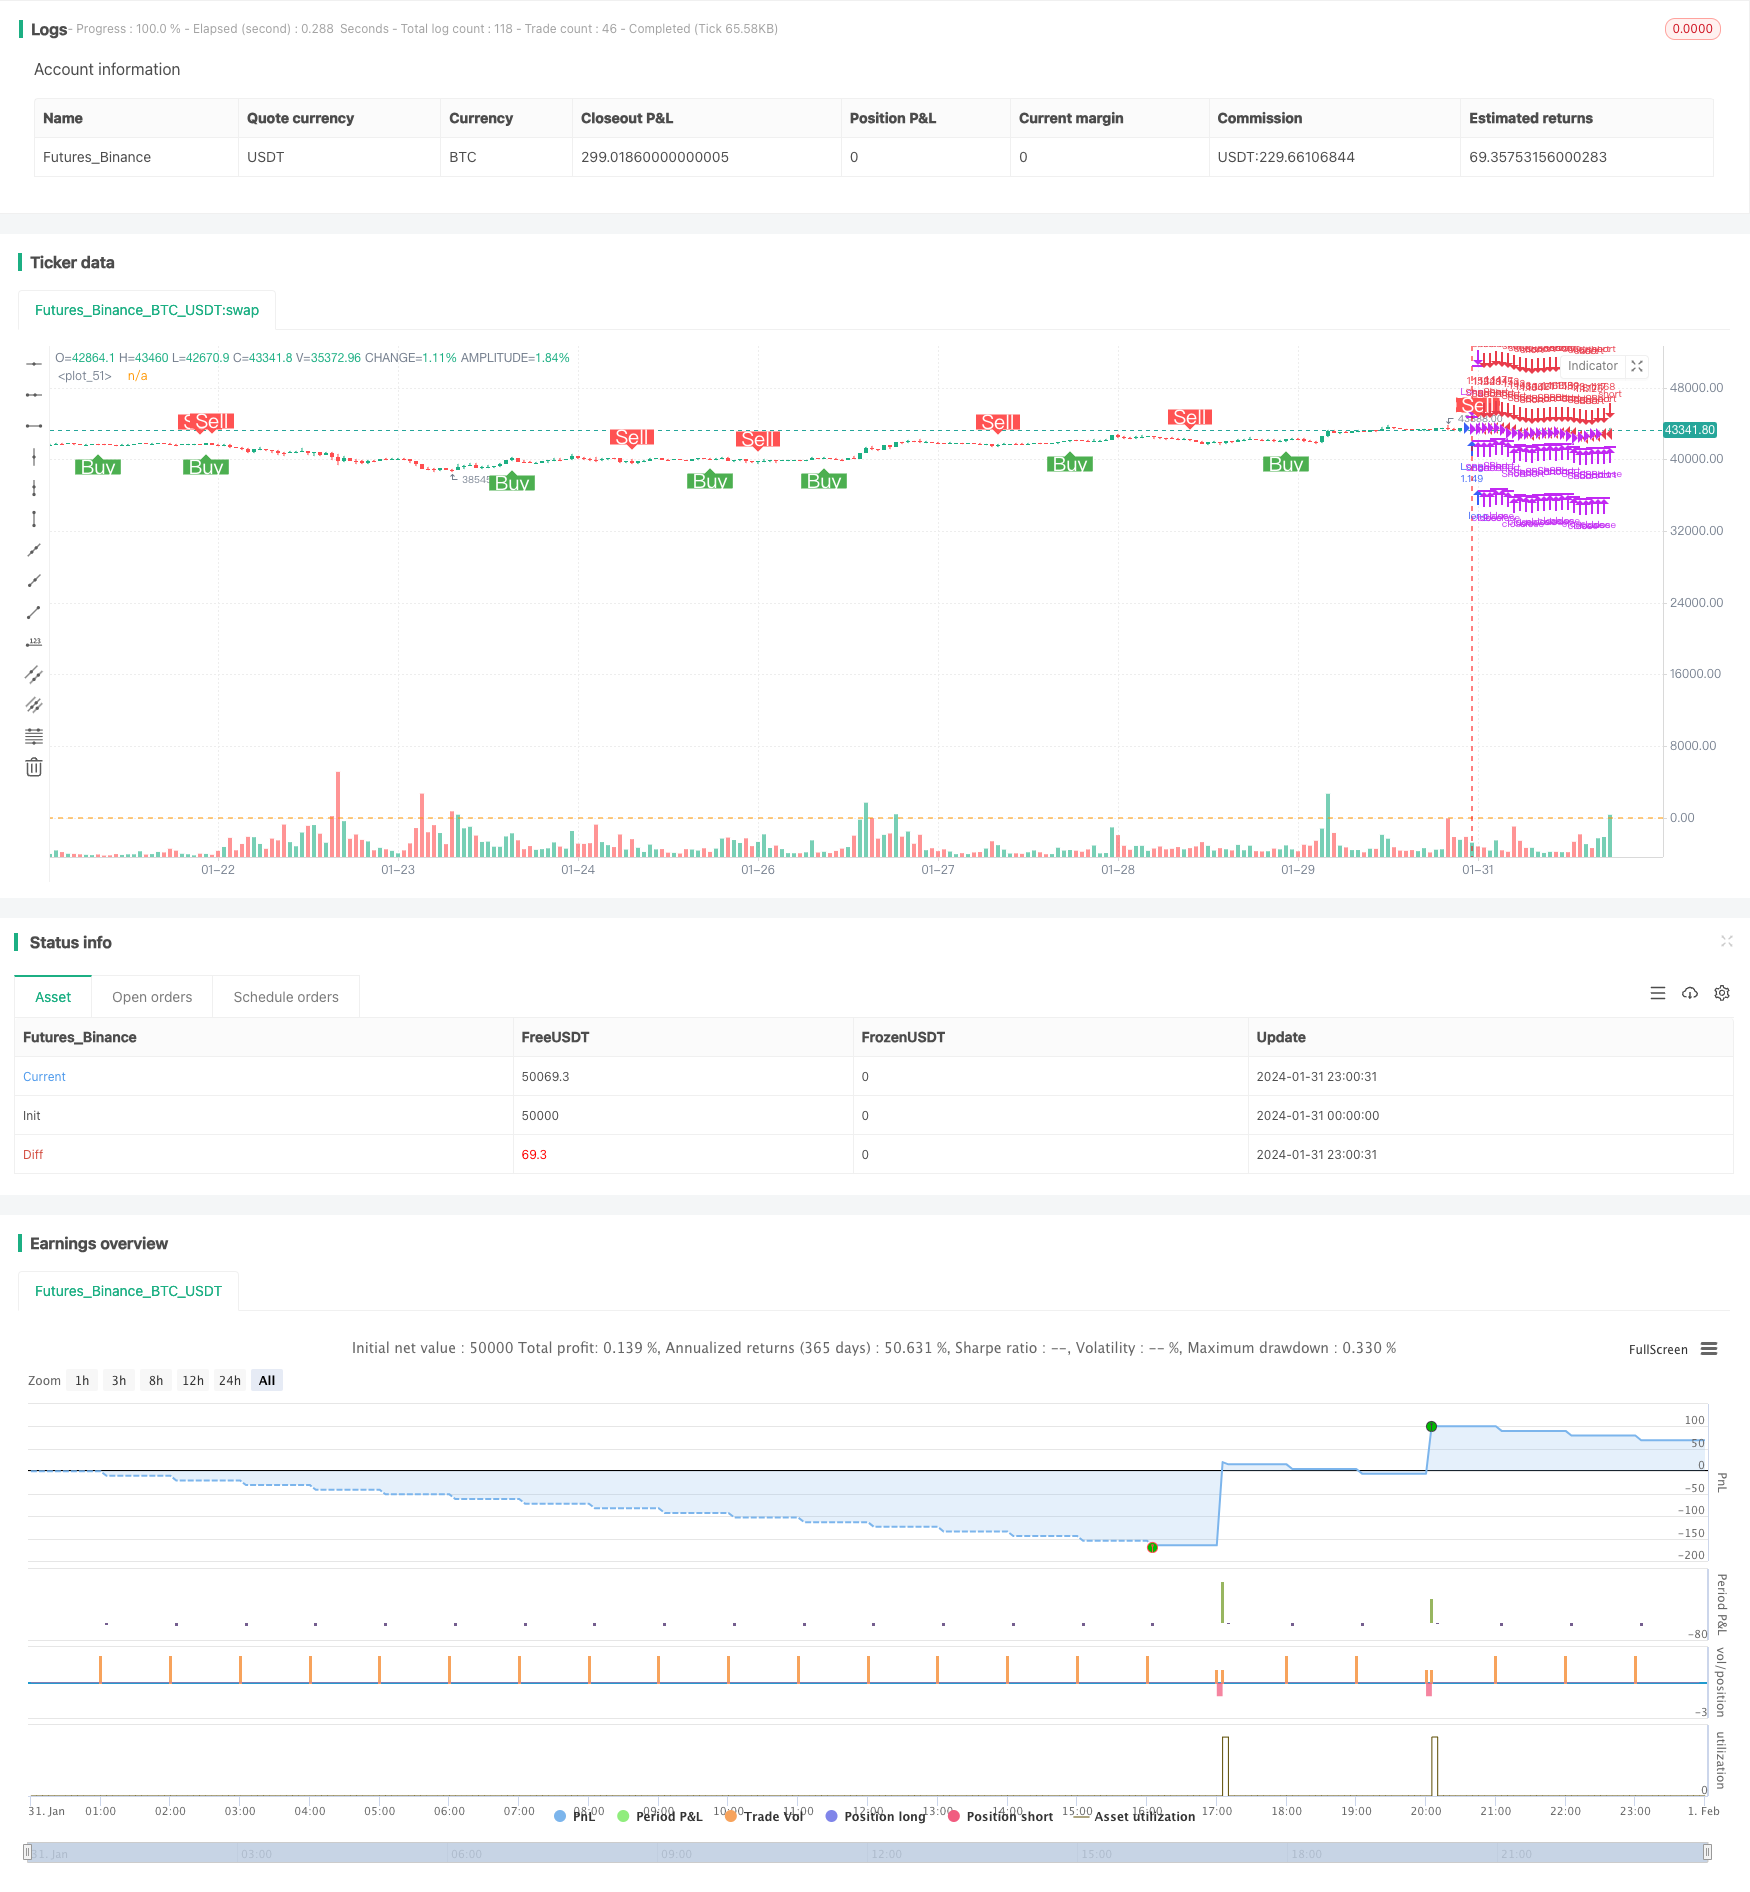
Chiến lược bóp méo động lực là một chiến lược giao dịch định lượng kết hợp các chỉ số động lực của các dải Brin, kênh Keltner và các chỉ số động lực. Nó sử dụng các dải Brin và kênh Keltner để xác định xem thị trường hiện tại có ở trong tình trạng bóp méo hay không, sau đó kết hợp với các chỉ số động lực để tạo ra tín hiệu giao dịch.
Ưu điểm chính của chiến lược này là có thể tự động nhận ra sự bắt đầu của hành vi xu hướng và kết hợp với chỉ số động lượng để đánh giá thời gian nhập cảnh. Tuy nhiên, cũng có một số rủi ro cần phải tối ưu hóa các tham số cho các giống khác nhau.
Nguyên tắc chiến lược
Chiến lược bóp mép động lực của con gấu được đánh giá dựa trên ba chỉ số sau:
- Bollinger Bands: bao gồm đường trung, đường trên và đường dưới
- Keltner Channels: bao gồm đường ray trung tâm, đường ray trên và đường ray dưới
- Chỉ số động lực (Momentum Indicator): Giá hiện tại và giá n ngày trước
Khi BRI lên đường dưới đường Keltner và BRI xuống đường dưới đường Keltner, chúng ta cho rằng thị trường đang ở trong trạng thái ép. Điều này thường có nghĩa là hành động theo xu hướng hiện tại sắp bắt đầu.
Để xác định thời điểm vào thị trường, chúng tôi sử dụng chỉ số động lực để đánh giá tốc độ thay đổi giá. Chúng tôi tạo ra tín hiệu mua khi động lực lên vượt quá mức trung bình của nó; chúng tôi tạo ra tín hiệu bán khi động lực xuống dưới mức trung bình của nó.
Phân tích lợi thế chiến lược
Những lợi thế chính của chiến lược xô đẩy động lực của con gấu gấu là:
- Có thể tự động nhận biết khi nào xu hướng bắt đầu, và tham gia sớm
- Kết hợp nhiều chỉ số để đánh giá và tránh các tín hiệu sai
- Đánh giá xu hướng và đảo ngược hai phương thức giao dịch
- Các tham số có thể tùy chỉnh để tối ưu hóa cho các giống khác nhau
Phân tích rủi ro
Tuy nhiên, chiến lược xô đẩy động lực của con gấu lông cũng có một số rủi ro:
- Các kênh Brin và Keltner có khả năng phát tín hiệu sai
- Các chỉ số động lực không ổn định, có thể bỏ lỡ điểm nhập cảnh tốt nhất
- Cần tối ưu hóa các tham số, nếu không sẽ không hiệu quả
- Tác dụng có liên quan nhiều hơn đến các loại giao dịch
Để giảm rủi ro, khuyến nghị tối ưu hóa các tham số chiều dài của Brin Belt và Keltner Channel, điều chỉnh điểm dừng lỗ, chọn các loại giao dịch có tính thanh khoản tốt hơn, đồng thời xác minh với các chỉ số khác.
Hướng tối ưu hóa chiến lược
Để tăng cường hiệu quả của chiến lược bóp méo động lực, các hướng tối ưu hóa chính là:
- Kiểm tra sự kết hợp các tham số của các giống và chu kỳ khác nhau
- Tối ưu hóa chiều dài của Brin Belt và Keltner Channel
- Tối ưu hóa chiều dài của chỉ số động lực
- Các chiến lược dừng lỗ khác nhau đối với nhiều đầu và đầu trống
- Thêm các chỉ số khác để xác nhận tín hiệu
Bằng cách thử nghiệm và tối ưu hóa đa phương tiện, chiến lược này có thể được nâng cao đáng kể về tỷ lệ chiến thắng và lợi nhuận.
Tóm tắt
Chiến lược bóp méo xoắn động lực tích hợp nhiều chỉ số có khả năng phán đoán mạnh mẽ, có thể xác định hiệu quả khi xu hướng bắt đầu. Tuy nhiên, cũng có một số rủi ro, cần phải tối ưu hóa tham số cho các loại giao dịch khác nhau. Bằng cách liên tục thử nghiệm và tối ưu hóa, chiến lược này có thể trở thành một hệ thống giao dịch thuật toán hiệu quả.
/*backtest
start: 2024-01-31 00:00:00
end: 2024-02-01 00:00:00
period: 1h
basePeriod: 15m
exchanges: [{"eid":"Futures_Binance","currency":"BTC_USDT"}]
*/

//@version=5
// This source code is subject to the terms of the Mozilla Public License 2.0 at https://mozilla.org/MPL/2.0/
// © mtahreemalam original strategy by LazyBear

strategy(title = 'SQM Strategy, TP & SL',
         shorttitle = 'Squeeze.M Strat',
         overlay = true,
         pyramiding = 0,
         default_qty_type = strategy.percent_of_equity,
         default_qty_value = 100,
         initial_capital = 1000,
         commission_type=strategy.commission.percent,
         commission_value=0.0,
         process_orders_on_close=true,
         use_bar_magnifier=true)
//Strategy logic
strategy_logic = input.string("Cross above 0", "Strategy Logic", options = ["LazyBear", "Cross above 0"])

// Date Range
testPeriodSwitch = input(false, "Custom Backtesting Date Range",group="Backtesting Date Range")
i_startTime = input(defval = timestamp("01 Jan 2022 00:01 +0000"), title = "Backtesting Start Time",group="Backtesting Date Range")
i_endTime = input(defval = timestamp("31 Dec 2022 23:59 +0000"), title = "Backtesting End Time",group="Backtesting Date Range")
timeCond = true
isPeriod = testPeriodSwitch == true ? timeCond : true

//// Stoploss and Take Profit Parameters
// Enable Long Strategy
enable_long_strategy = input.bool(true, title='Enable Long Strategy', group='SL/TP For Long Strategy', inline='1')
long_stoploss_value = input.float(defval=5, title='Stoploss %', minval=0.1, group='SL/TP For Long Strategy', inline='2')
long_stoploss_percentage = close * (long_stoploss_value / 100) / syminfo.mintick
long_takeprofit_value = input.float(defval=5, title='Take Profit %', minval=0.1, group='SL/TP For Long Strategy', inline='2')
long_takeprofit_percentage = close * (long_takeprofit_value / 100) / syminfo.mintick

// Enable Short Strategy
enable_short_strategy = input.bool(true, title='Enable Short Strategy', group='SL/TP For Short Strategy', inline='3')
short_stoploss_value = input.float(defval=5, title='Stoploss %', minval=0.1, group='SL/TP For Short Strategy', inline='4')
short_stoploss_percentage = close * (short_stoploss_value / 100) / syminfo.mintick
short_takeprofit_value = input.float(defval=5, title='Take Profit %', minval=0.1, group='SL/TP For Short Strategy', inline='4')
short_takeprofit_percentage = close * (short_takeprofit_value / 100) / syminfo.mintick

//// Inputs
//SQUEEZE MOMENTUM STRATEGY
length = input(20, title='BB Length', group = "Squeeze Momentum Settings")
mult = input(2.0, title='BB MultFactor', group = "Squeeze Momentum Settings")
source = close
lengthKC = input(20, title='KC Length', group = "Squeeze Momentum Settings")
multKC = input(1.5, title='KC MultFactor', group = "Squeeze Momentum Settings")
useTrueRange = input(true, title='Use TrueRange (KC)', group = "Squeeze Momentum Settings")
signalPeriod=input(5, title="Signal Length", group = "Squeeze Momentum Settings")
show_labels_sqm = input(title='Show Buy/Sell SQM Labels', defval=true, group = "Squeeze Momentum Settings")
h0 = hline(0)

// Defining MA
ma = ta.sma(source, length)

// Calculate BB
basis = ma
dev = mult * ta.stdev(source, length)
upperBB = basis + dev
lowerBB = basis - dev

// Calculate KC
range_1 = useTrueRange ? ta.tr : high - low
rangema = ta.sma(range_1, lengthKC)
upperKC = ma + rangema * multKC
lowerKC = ma - rangema * multKC


// SqzON | SqzOFF | noSqz
sqzOn = lowerBB > lowerKC and upperBB < upperKC
sqzOff = lowerBB < lowerKC and upperBB > upperKC
noSqz = sqzOn == false and sqzOff == false

// Momentum
val = ta.linreg(source - math.avg(math.avg(ta.highest(high, lengthKC), ta.lowest(low, lengthKC)), ta.sma(close, lengthKC)), lengthKC, 0)

red_line = ta.sma(val,signalPeriod)
blue_line = val

// lqm = if val > 0
//         if val > nz(val[1])
        // long_sqm_custom
        // if val < nz(val[1])
        // short_sqm_custom
// Plots
//plot(val, style = plot.style_line, title = "blue line", color= color.blue, linewidth=2)
//plot(ta.sma(val,SignalPeriod), style = plot.style_line, title = "red line",color = color.red, linewidth=2)

//plot(val, color=blue, linewidth=2)
//plot(0, color=color.gray, style=plot.style_cross, linewidth=2)
//plot(red_line, color=red, linewidth=2)

//LOGIC
//momentum filter
//filterMom = useMomAverage ? math.abs(val) > MomentumMin / 100000 ? true : false : true
//}

////SQM Long Short Conditions
//Lazy Bear Buy Sell Condition
// long_sqm_lazy = (blue_line>red_line)
// short_sqm_lazy = (blue_line<red_line)

long_sqm_lazy = ta.crossover(blue_line,red_line)
short_sqm_lazy = ta.crossunder(blue_line,red_line)


//Custom Buy Sell Condition
dir_sqm = val < 0 ? -1 : 1
long_sqm_custom = dir_sqm == 1 //and dir_sqm[1] == -1
short_sqm_custom = dir_sqm == -1 //and dir_sqm[1] == 1

long_sqm = strategy_logic == "LazyBear" ? long_sqm_lazy : long_sqm_custom
short_sqm = strategy_logic == "LazyBear" ? short_sqm_lazy : short_sqm_custom


// Plot Stoploss & Take Profit Levels
long_stoploss_price = strategy.position_avg_price * (1 - long_stoploss_value / 100)
long_takeprofit_price = strategy.position_avg_price * (1 + long_takeprofit_value / 100)
short_stoploss_price = strategy.position_avg_price * (1 + short_stoploss_value / 100)
short_takeprofit_price = strategy.position_avg_price * (1 - short_takeprofit_value / 100)
plot(enable_long_strategy and not enable_short_strategy ? long_stoploss_percentage : na, color=color.red, style=plot.style_linebr, linewidth=2, title='Long SL Level')
plot(enable_long_strategy and not enable_short_strategy ? long_takeprofit_percentage : na, color=color.green, style=plot.style_linebr, linewidth=2, title='Long TP Level')
plot(enable_short_strategy and not enable_long_strategy ? short_stoploss_price : na, color=color.red, style=plot.style_linebr, linewidth=2, title='Short SL Level')
plot(enable_short_strategy and not enable_long_strategy ? short_takeprofit_price : na, color=color.green, style=plot.style_linebr, linewidth=2, title='Short TP Level')


// Long Strategy
if long_sqm and enable_long_strategy == true
    strategy.entry('Long', strategy.long)
    strategy.exit('Long  SL/TP', from_entry='Long', loss=long_stoploss_percentage, profit=long_takeprofit_percentage)
    strategy.close('Long', comment = "L. CL")

// Short Strategy
if short_sqm and enable_short_strategy == true
    strategy.entry('Short', strategy.short)
    strategy.exit('Short SL/TP', from_entry='Short', loss=short_stoploss_percentage, profit=short_takeprofit_percentage)
    strategy.close('Short', comment = "S.Cl")

plot_sqm_long = long_sqm and not long_sqm[1]
plot_sqm_short = short_sqm and not short_sqm[1]

plotshape(plot_sqm_long and show_labels_sqm, title='Buy', style=shape.labelup, location=location.belowbar, size=size.normal, text='Buy', textcolor=color.new(color.white, 0), color=color.new(color.green, 0))
plotshape(plot_sqm_short and show_labels_sqm, title='Sell', style=shape.labeldown, location=location.abovebar, size=size.normal, text='Sell', textcolor=color.new(color.white, 0), color=color.new(color.red, 0))

// Date Range EXIT
if (not isPeriod)
    strategy.cancel_all()
    strategy.close_all()