Chiến lược giao cắt đường trung bình động kép EMA

Tổng quan
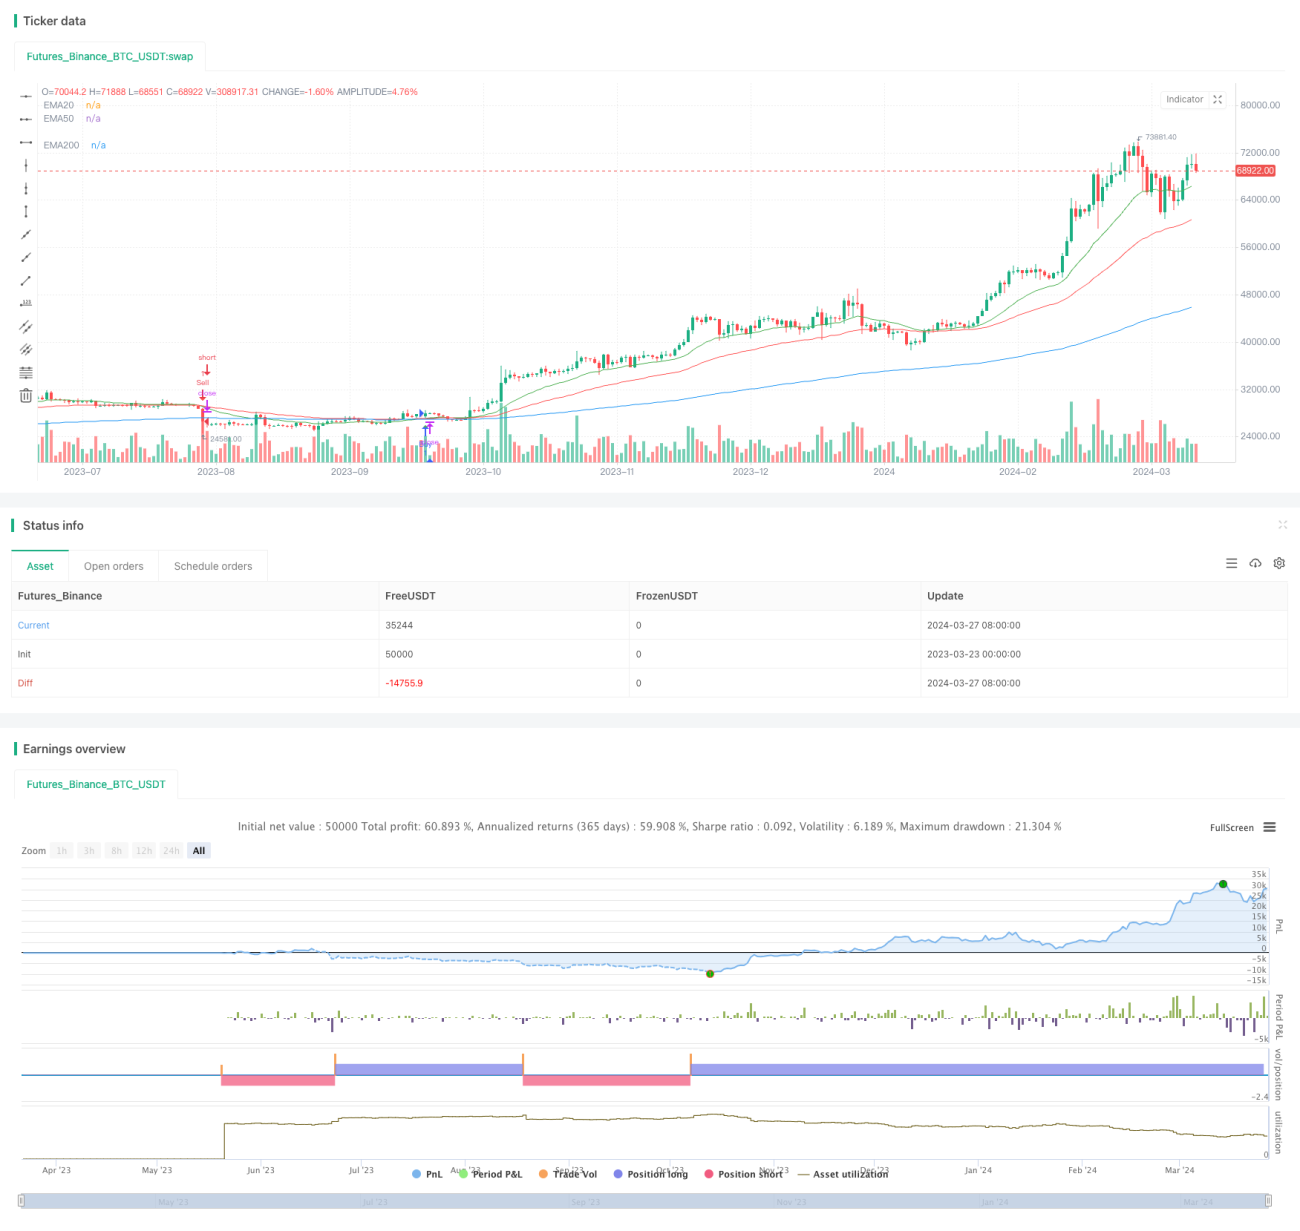
Chiến lược này dựa trên sự giao thoa của hai đường trung bình di chuyển ((EMA) để tạo ra tín hiệu giao dịch. Khi EMA ngắn hạn (20 ngày) đi từ dưới lên qua EMA dài ((50 ngày), nó tạo ra tín hiệu mua; Khi EMA ngắn hạn đi từ trên xuống qua EMA dài, nó tạo ra tín hiệu bán. Đồng thời, chiến lược này cũng vẽ một EMA 200 ngày để tham khảo xu hướng dài hạn.
Nguyên tắc chiến lược
- Tính toán 20 ngày EMA, 50 ngày EMA và 200 ngày EMA.
- Xác định sự giao thoa giữa EMA 20 và EMA 50:
- Một tín hiệu mua được tạo ra khi 20 ngày EMA đi từ dưới lên qua 50 ngày EMA.
- Một tín hiệu bán được tạo ra khi 20 ngày EMA vượt qua 50 ngày EMA từ trên xuống.
- Trên biểu đồ vẽ 20 ngày EMA (màu xanh), 50 ngày EMA (màu đỏ) và 200 ngày EMA (màu xanh) để trực quan quan sát sự chuyển động và giao thoa của chúng.
- Khi các tín hiệu mua và bán xảy ra, biểu đồ được đánh dấu bằng các dấu mua (trung bình trên màu xanh lá cây) và bán (trung bình dưới màu đỏ) tương ứng.
Lợi thế chiến lược
- Đơn giản và dễ hiểu: Chiến lược này dựa trên nguyên tắc giao chéo trung bình di chuyển đơn giản, dễ hiểu và thực hiện.
- Theo dõi xu hướng: Bằng cách giao chéo giữa các đường trung bình di chuyển ngắn hạn và dài hạn, chiến lược có thể nắm bắt tốt hơn sự thay đổi của xu hướng thị trường, phù hợp để sử dụng trong thị trường xu hướng.
- Trình tham khảo xu hướng dài hạn: Chiến lược đưa ra EMA 200 ngày như là một tham khảo xu hướng dài hạn, giúp đánh giá môi trường thị trường hiện tại.
- Trình hiển thị trực quan: Chiến lược vẽ rõ ràng các tín hiệu mua và bán và trung bình di chuyển trên biểu đồ, giúp thương nhân quan sát và phân tích trực quan.
Rủi ro chiến lược
- Thị trường chấn động: Trong thị trường chấn động, các đường trung bình di chuyển thường xuyên có thể tạo ra nhiều tín hiệu giả, dẫn đến hiệu suất chiến lược kém.
- Sự chậm trễ: Đường trung bình di chuyển có một sự chậm trễ, có thể bỏ lỡ thời điểm tốt nhất để thị trường biến đổi.
- Đối số nhạy cảm: Hiệu suất của chiến lược phụ thuộc vào lựa chọn chu kỳ của đường trung bình di chuyển, các tham số chu kỳ khác nhau có thể dẫn đến kết quả khác nhau.
Hướng tối ưu hóa chiến lược
- Tham gia các chỉ số khác: Có thể xem xét việc đưa ra các chỉ số kỹ thuật khác như RSI, MACD, v.v. để cải thiện độ tin cậy và độ chính xác của tín hiệu.
- Các tham số tối ưu hóa: Tối ưu hóa các tham số chu kỳ của đường trung bình di chuyển để tìm các tham số phù hợp nhất với tình trạng thị trường hiện tại.
- Thêm dừng và chặn: Thêm các cơ chế dừng và chặn hợp lý vào chiến lược để kiểm soát rủi ro và lợi nhuận của mỗi giao dịch.
- Phân tích xu hướng: Các tín hiệu giao dịch được lọc dựa trên xu hướng dài hạn (ví dụ như EMA 200 ngày) và chỉ giao dịch theo hướng xu hướng.
Tóm tắt
Chiến lược giao dịch chéo đường hai đường EMA là một chiến lược giao dịch đơn giản, dễ hiểu và phù hợp với thị trường xu hướng. Nó sử dụng chéo đường trung bình di chuyển ngắn hạn và dài hạn để nắm bắt sự thay đổi của xu hướng thị trường, đồng thời đưa ra tham chiếu xu hướng dài hạn. Mặc dù chiến lược này có một số hạn chế, chẳng hạn như hoạt động kém trong thị trường biến động và sự chậm trễ của đường trung bình di chuyển, nhưng bằng cách đưa ra các chỉ số khác, tối ưu hóa các tham số, thêm các biện pháp kiểm soát rủi ro, các biện pháp có thể tiếp tục nâng cao sự ổn định và lợi nhuận của chiến lược.
- 1