
এই কৌশলটি MACD সূচকের উপর ভিত্তি করে একটি দ্বিমুখী ট্রেডিং কৌশল বাস্তবায়ন করে। এটি MACD সূচকের উপর গোল্ডফোর্ক এবং ডেডফোর্ক করার সময় পৃথকভাবে লোভনীয় এবং লোভনীয় হতে পারে এবং অন্যান্য সূচকের বিচারের সাথে মিলিত হয়ে কিছু সংকেত ফিল্টার করতে পারে।
এই কৌশলটি মূলত MACD সূচক ব্যবহার করে দ্বি-মুখী লেনদেন করে। বিশেষত, এটি দ্রুত চলমান গড়, ধীর চলমান গড় এবং MACD সংকেত লাইন গণনা করে। যখন দ্রুত চলমান গড়ের উপরে ধীর চলমান গড় অতিক্রম করা হয় তখন একটি গোল্ড ফর্ক সংকেত তৈরি করে। যখন দ্রুত চলমান গড়ের নীচে ধীর চলমান গড় অতিক্রম করা হয় তখন একটি মৃত ফর্ক সংকেত তৈরি করে।
কিছু অবৈধ সংকেত ফিল্টার করার জন্য, এই কৌশলটি একটি ফিল্টার হিসাবে একটি ± 30 পরিসীমাও সেট করে, কেবলমাত্র যখন MACD স্তম্ভের লাইনটি এই পরিসীমা অতিক্রম করে তখনই একটি লেনদেনের সংকেত ট্রিগার করে। তদুপরি, এটি MACD স্তম্ভের লাইনের দিক নির্ধারণ করে যখন এটি খালি থাকে, কেবলমাত্র যখন দুটি ধারাবাহিক স্তম্ভের দিক পরিবর্তন হয় তখনই এটি খালি হয়।
এই কৌশলটি সামগ্রিকভাবে একটি মৌলিক ব্যবহারযোগ্য দ্বি-মুখী ট্রেডিং কৌশল। এটি MACD সূচকের সুবিধা গ্রহণ করে এবং একই সাথে সংকেতের গুণমান নিয়ন্ত্রণের জন্য একটি ফিল্টার যুক্ত করে। তবে MACD সূচকটিতেও কিছু সমস্যা রয়েছে, কৌশলটিকে আরও নির্ভরযোগ্য করার জন্য রিয়েল-স্টোরে আরও পরীক্ষা এবং অপ্টিমাইজেশনের প্রয়োজন। সামগ্রিকভাবে, এই কৌশলটি দ্বি-মুখী ট্রেডিং কৌশলটির ভিত্তি স্থাপন করেছে, যা পরবর্তীকালে ক্রমাগত অপ্টিমাইজ করা যেতে পারে, এটি একটি শক্তিশালী পরিমাণগত ট্রেডিং কৌশল হিসাবে তৈরি করে।
]
/*backtest
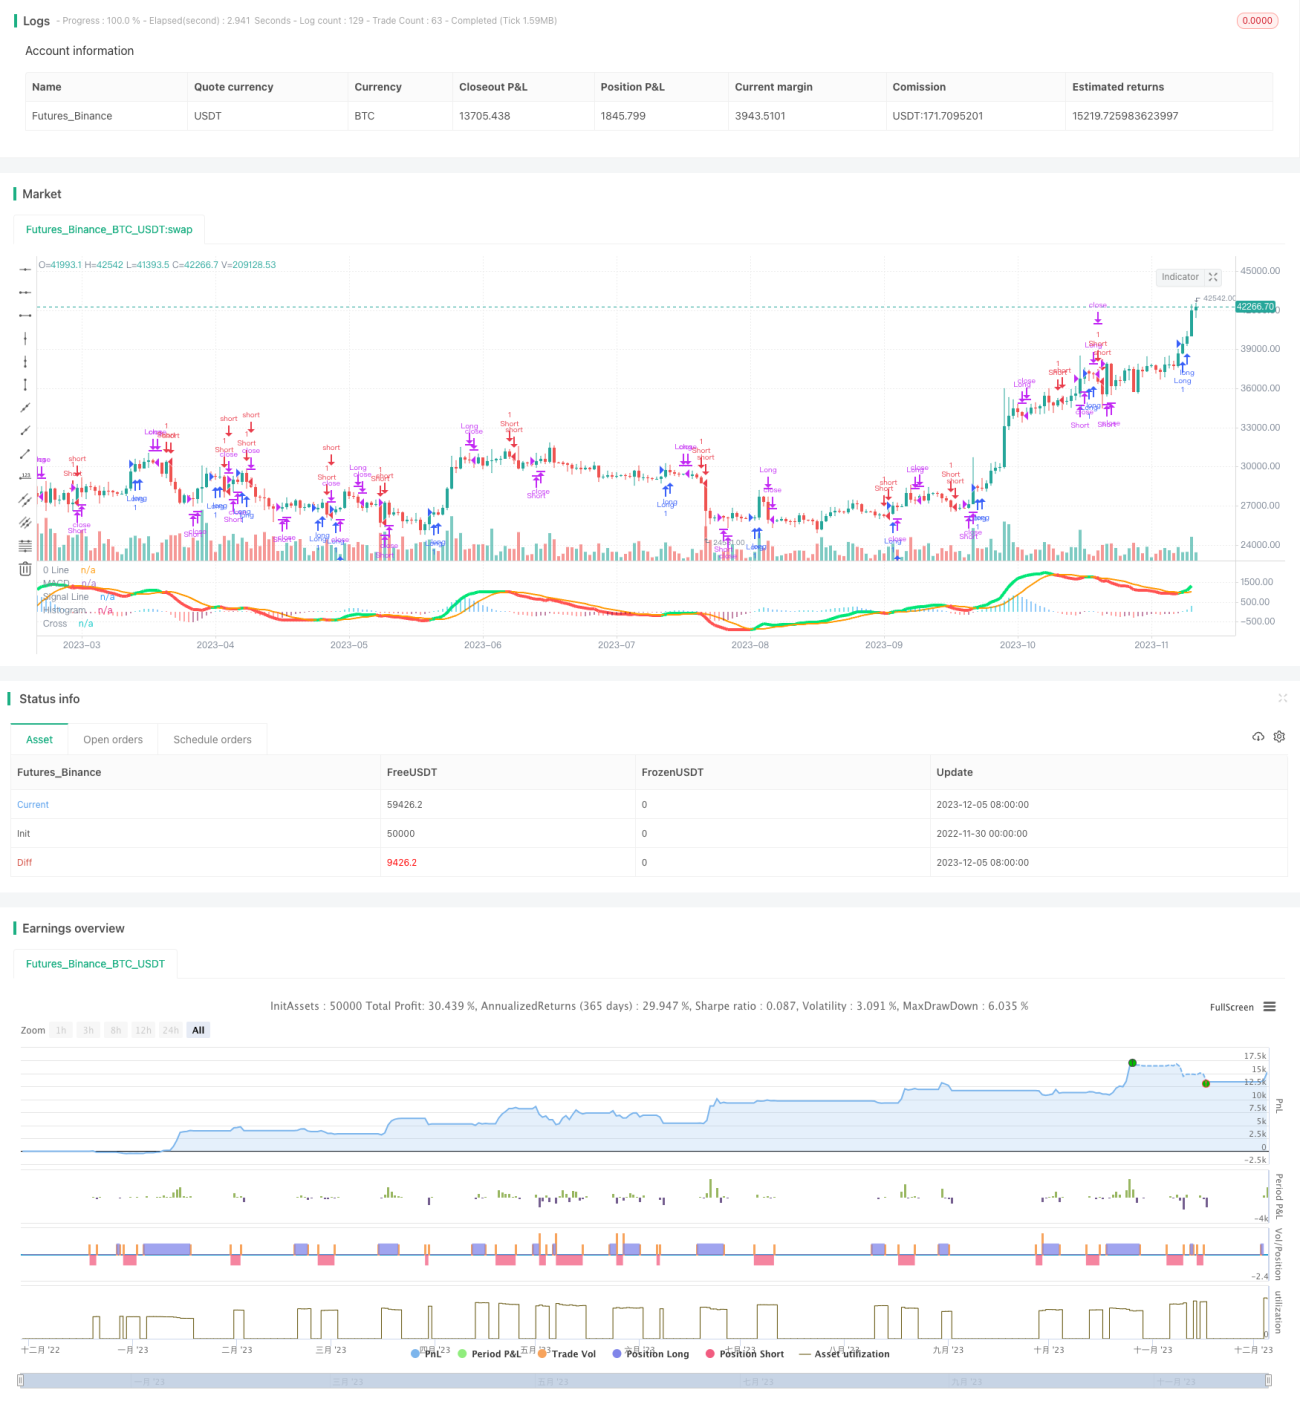
start: 2022-11-30 00:00:00
end: 2023-12-06 00:00:00
period: 1d
basePeriod: 1h
exchanges: [{"eid":"Futures_Binance","currency":"BTC_USDT"}]
*/
//@version=3
//Created by user ChrisMoody updated 4-10-2014
//Regular MACD Indicator with Histogram that plots 4 Colors Based on Direction Above and Below the Zero Line
//Update allows Check Box Options, Show MacD & Signal Line, Show Change In color of MacD Line based on cross of Signal Line.
//Show Dots at Cross of MacD and Signal Line, Histogram can show 4 colors or 1, Turn on and off Histogram.
//Special Thanks to that incredible person in Tech Support whoem I won't say you r name so you don't get bombarded with emails
//Note the feature Tech Support showed me on how to set the default timeframe of the indicator to the chart Timeframe, but also allow you to choose a different timeframe.
//By the way I fully disclose that I completely STOLE the Dots at the MAcd Cross from "TheLark"
strategy("MACD Strategy", overlay=false)
// study(title="CM_MacD_Ult_MTF", shorttitle="CM_Ult_MacD_MTF")
source = close
useCurrentRes = input(true, title="Use Current Chart Resolution?")
resCustom = input(title="Use Different Timeframe? Uncheck Box Above", defval="60")
smd = input(true, title="Show MacD & Signal Line? Also Turn Off Dots Below")
sd = input(true, title="Show Dots When MacD Crosses Signal Line?")
sh = input(true, title="Show Histogram?")
macd_colorChange = input(true,title="Change MacD Line Color-Signal Line Cross?")
hist_colorChange = input(true,title="MacD Histogram 4 Colors?")
res = useCurrentRes ? timeframe.period : resCustom
fastLength = input(12, minval=1), slowLength=input(26,minval=1)
signalLength=input(9,minval=1)
fastMA = ema(source, fastLength)
slowMA = ema(source, slowLength)
macd = fastMA - slowMA
signal = sma(macd, signalLength)
hist = macd - signal
outMacD = request.security(syminfo.tickerid, res, macd)
outSignal = request.security(syminfo.tickerid, res, signal)
outHist = request.security(syminfo.tickerid, res, hist)
histA_IsUp = outHist > outHist[1] and outHist > 0
histA_IsDown = outHist < outHist[1] and outHist > 0
histB_IsDown = outHist < outHist[1] and outHist <= 0
histB_IsUp = outHist > outHist[1] and outHist <= 0
//MacD Color Definitions
macd_IsAbove = outMacD >= outSignal
macd_IsBelow = outMacD < outSignal
// strategy.entry("Long", strategy.long, 1, when = shouldPlaceLong)
// strategy.close("Long", shouldExitLong)
// strategy.entry("Short", strategy.short, 1, when = shouldPlaceShort)
// strategy.close("Short", shouldExitShort)
isWithinZeroMacd = outHist < 30 and outHist > -30
delta = hist
// shouldExitShort = false//crossover(delta, 0)
// shouldExitLong = false//crossunder(delta, 0)
// if(crossover(delta, 0))// and not isWithinZeroMacd)
// strategy.entry("Long", strategy.long, comment="Long")
// if (crossunder(delta, 0))// and not isWithinZeroMacd)
// strategy.entry("Short", strategy.short, comment="Short")
shouldPlaceLong = crossover(delta, 0)
strategy.entry("Long", strategy.long, 1, when = shouldPlaceLong)
shouldExitLong = not histA_IsUp and histA_IsDown
shouldExitShort = not histA_IsUp and not histA_IsDown and not histB_IsDown and histB_IsUp
shouldPlaceShort = crossunder(delta, 0)
strategy.entry("Short", strategy.short, 1, when = shouldPlaceShort)
// plot_color = gray
plot_color = if(hist_colorChange)
if(histA_IsUp)
aqua
else
if(histA_IsDown)
//need to sell
// if(not isWithinZeroMacd)
// shouldExitLong = true
// strategy.entry("Short", strategy.short, comment="Short")
blue
else
if(histB_IsDown)
red
else
if(histB_IsUp)
//need to buy
// if(not isWithinZeroMacd)
// shouldExitShort = true
// strategy.entry("Long", strategy.long, comment="Long")
maroon
else
yellow
else
gray
// plot_color = hist_colorChange ? histA_IsUp ? aqua : histA_IsDown ? blue : histB_IsDown ? red : histB_IsUp ? maroon :yellow :gray
macd_color = macd_colorChange ? macd_IsAbove ? lime : red : red
signal_color = macd_colorChange ? macd_IsAbove ? orange : orange : lime
circleYPosition = outSignal
plot(smd and outMacD ? outMacD : na, title="MACD", color=macd_color, linewidth=4)
plot(smd and outSignal ? outSignal : na, title="Signal Line", color=signal_color, style=line ,linewidth=2)
plot(sh and outHist ? outHist : na, title="Histogram", color=plot_color, style=histogram, linewidth=4)
plot(sd and cross(outMacD, outSignal) ? circleYPosition : na, title="Cross", style=circles, linewidth=4, color=macd_color)
// plot( isWithinZeroMacd ? outHist : na, title="CheckSmallHistBars", style=circles, linewidth=4, color=black)
hline(0, '0 Line', linewidth=2, color=white)
strategy.close("Short", shouldExitShort)
strategy.close("Long", shouldExitLong)
// fastLength = input(12)
// slowlength = input(26)
// MACDLength = input(9)
// MACD = ema(close, fastLength) - ema(close, slowlength)
// aMACD = ema(MACD, MACDLength)
// delta = MACD - aMACD
// if (crossover(delta, 0))
// strategy.entry("MacdLE", strategy.long, comment="MacdLE")
//if last two macd bars are higher than current, close long position
// if (crossunder(delta, 0))
// strategy.entry("MacdSE", strategy.short, comment="MacdSE")
//if last two macd bars are higher than current, close long position
// plot(strategy.equity, title="equity", color=red, linewidth=2, style=areabr)