বলিঙ্গার+আরএসআই ডুয়াল স্ট্র্যাটেজি (শুধুমাত্র দীর্ঘ সময়ের জন্য) v1.2

১, কৌশল নাম
Bollinger + RSI ডাবল মাল্টিপ্লেয়ার কৌশল
দ্বিতীয়, কৌশলগত বিশ্লেষণ
এই কৌশলটি বুলিং লাইন সূচক এবং আরএসআই সূচকগুলির সমন্বয় ব্যবহার করে, যখন উভয়ই ওভারসোল সংকেত দেখায় তখন পজিশন বাড়ায় এবং যখন উভয়ই ওভারসোল সংকেত দেখায় তখন পজিশন কমিয়ে দেয়। একক সূচকের তুলনায়, এটি ট্রেডিং সংকেতগুলি নিশ্চিত করার জন্য আরও নির্ভরযোগ্য এবং মিথ্যা সংকেতগুলি এড়াতে পারে।
তৃতীয়, কৌশলগত নীতি
- আরএসআই দ্বারা ওভারবয় ওভারসোল্ড
- আরএসআই ৫০ এর নিচে ওভারসোল্ড
- আরএসআই ৫০ এর বেশি হলে, এটিকে ওভারবয় বলা হয়।
- দামের অস্বাভাবিকতা নির্ণয়ের জন্য ব্রাইন লাইন ব্যবহার করা হয়েছে
- ট্র্যাকের নিচে দামকে অতিরিক্ত বিক্রি বলা হয়
- রেলের চেয়ে বেশি দামে ভাড়া নেওয়াকে ওভারবয় বলা হয়
- যখন RSI এবং বুলিং লাইন একই সময়ে ওভারসোল্ডের সংকেত দেয়, তখন অতিরিক্ত পজিশন তৈরি করুন
- RSI রেখা 50 এর নিচে
- বুলিনের নিচে রেল লাইন
- যখন RSI এবং বুলিং লাইন একই সময়ে ওভার-বই সংকেত দেয়, তখন প্লেইন পজিশন
- RSI রেখা 50 এর উপরে
- বুলিনের চেয়েও বেশি দামে ট্রেন
চার, কৌশলগত সুবিধা
- দুটি সূচক একত্রিত করা হয়েছে, যাতে ভুয়া সংকেত এড়ানো যায়
- কেবলমাত্র একাধিক পজিশন তৈরি করুন, লজিক সরল করুন, ট্রেডিং ঝুঁকি হ্রাস করুন
পঞ্চম, কৌশলগত ঝুঁকি এবং সমাধান
- ভুলভাবে সেট করা ব্রিন লাইন প্যারামিটার, ওপেন এবং ডাউন ট্র্যাকের সীমাবদ্ধতা খুব প্রশস্ত, ভুল লেনদেনের ঝুঁকি বাড়ায়
- বুলিন লাইন প্যারামিটার অপ্টিমাইজ করুন, বুলিন লাইন চক্র এবং স্ট্যান্ডার্ড ডিফারেনশিয়াল যুক্তিসঙ্গতভাবে সেট করুন
- RSI প্যারামিটারগুলি ভুলভাবে সেট করা হয়েছে, ওভার-বয় ওভার-সেলিংয়ের জন্য ভুল বিচারক রয়েছে, যা ভুল লেনদেনের ঝুঁকি বাড়িয়ে তোলে
- আরএসআই প্যারামিটারগুলিকে অনুকূলিত করুন, আরএসআই চক্রগুলিকে সামঞ্জস্য করুন, ওভার-বিক্রয় ওভার-বিক্রয় মানদণ্ডকে যুক্তিসঙ্গতভাবে সেট করুন
- রাভিন যখন কোন ট্রেন্ড দেখায় না, তখন তার কার্যকারিতা খারাপ হয়
- প্রবণতা-ভিত্তিক সূচকগুলির সাথে একত্রে, অস্থিরতা এড়ানো
ষষ্ঠ, কৌশলগত দিকনির্দেশনা
- বুলিন লাইন এবং RSI প্যারামিটার সেটিং অপ্টিমাইজ করুন
- ক্ষতিপূরণ বাড়ানো
- ট্রেন্ডিং সূচক যেমন MACD
- সংক্ষিপ্ত ও দীর্ঘ লাইন যুক্ত করে বিচার করা
7. সারাংশ
এই কৌশলটি বুলিন লাইন এবং আরএসআই উভয় সূচকের সুবিধাগুলিকে একত্রিত করে, যখন উভয়ই একই সাথে ওভারব্লু ওভারসোল সংকেত প্রদর্শন করে তখন ট্রেড করে, একক সূচক দ্বারা উত্পন্ন মিথ্যা সংকেত এড়ানো, যার ফলে সংকেত নির্ভুলতা বৃদ্ধি পায়। পূর্ববর্তী সংস্করণের তুলনায়, কেবলমাত্র একাধিক পজিশন স্থাপন করা, ব্যবসায়ের ঝুঁকি হ্রাস করে। পরবর্তীতে প্যারামিটার অপ্টিমাইজেশন, স্টপ লস মেশিন এবং প্রবণতা-ভিত্তিক সূচকগুলির সাথে সংমিশ্রণের মাধ্যমে কৌশলটি অপ্টিমাইজ করা যেতে পারে, যাতে এটি বিভিন্ন বাজারের পরিবেশে আরও উপযুক্ত হয়।
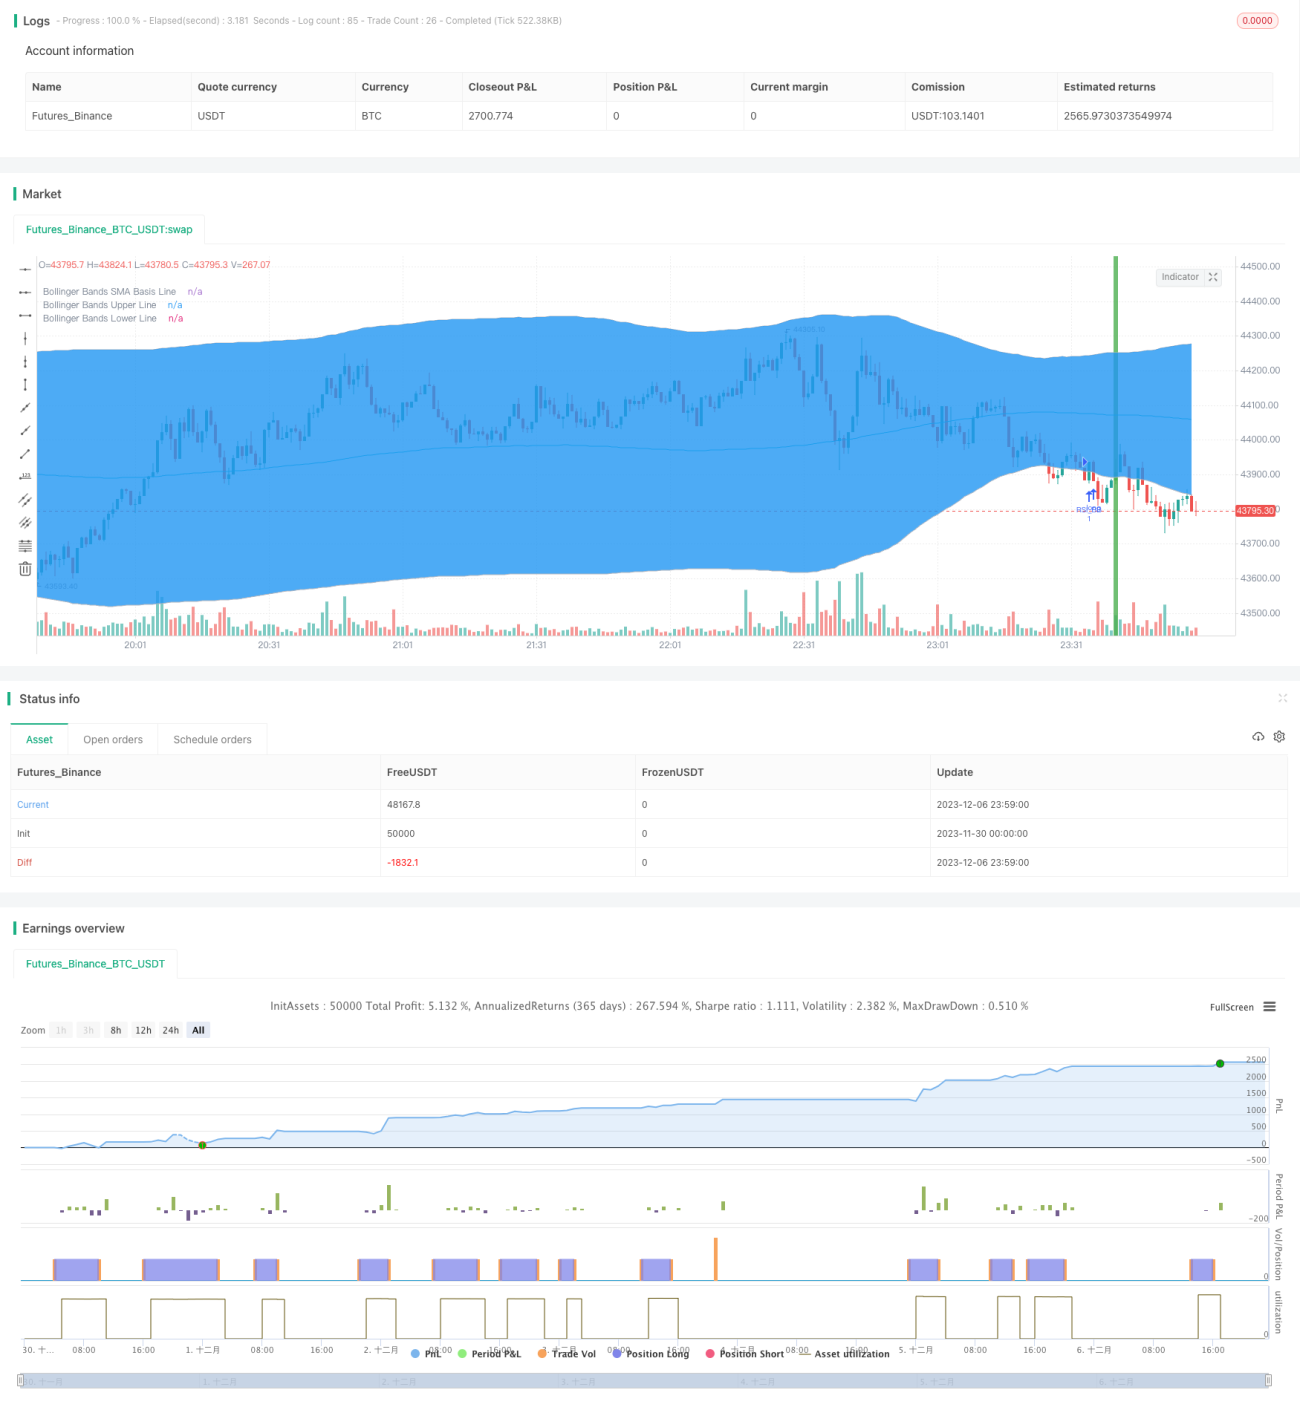
/*backtest
start: 2023-11-30 00:00:00
end: 2023-12-07 00:00:00
period: 1m
basePeriod: 1m
exchanges: [{"eid":"Futures_Binance","currency":"BTC_USDT"}]
*/

//@version=3
strategy("Bollinger + RSI, Double Strategy Long-Only (by ChartArt) v1.2", shorttitle="CA_-_RSI_Bol_Strat_1.2", overlay=true)

// ChartArt's RSI + Bollinger Bands, Double Strategy UPDATE: Long-Only- 1