Bitcoin-Daytrading-Strategie mit Kombination mehrerer Indikatoren

Überblick
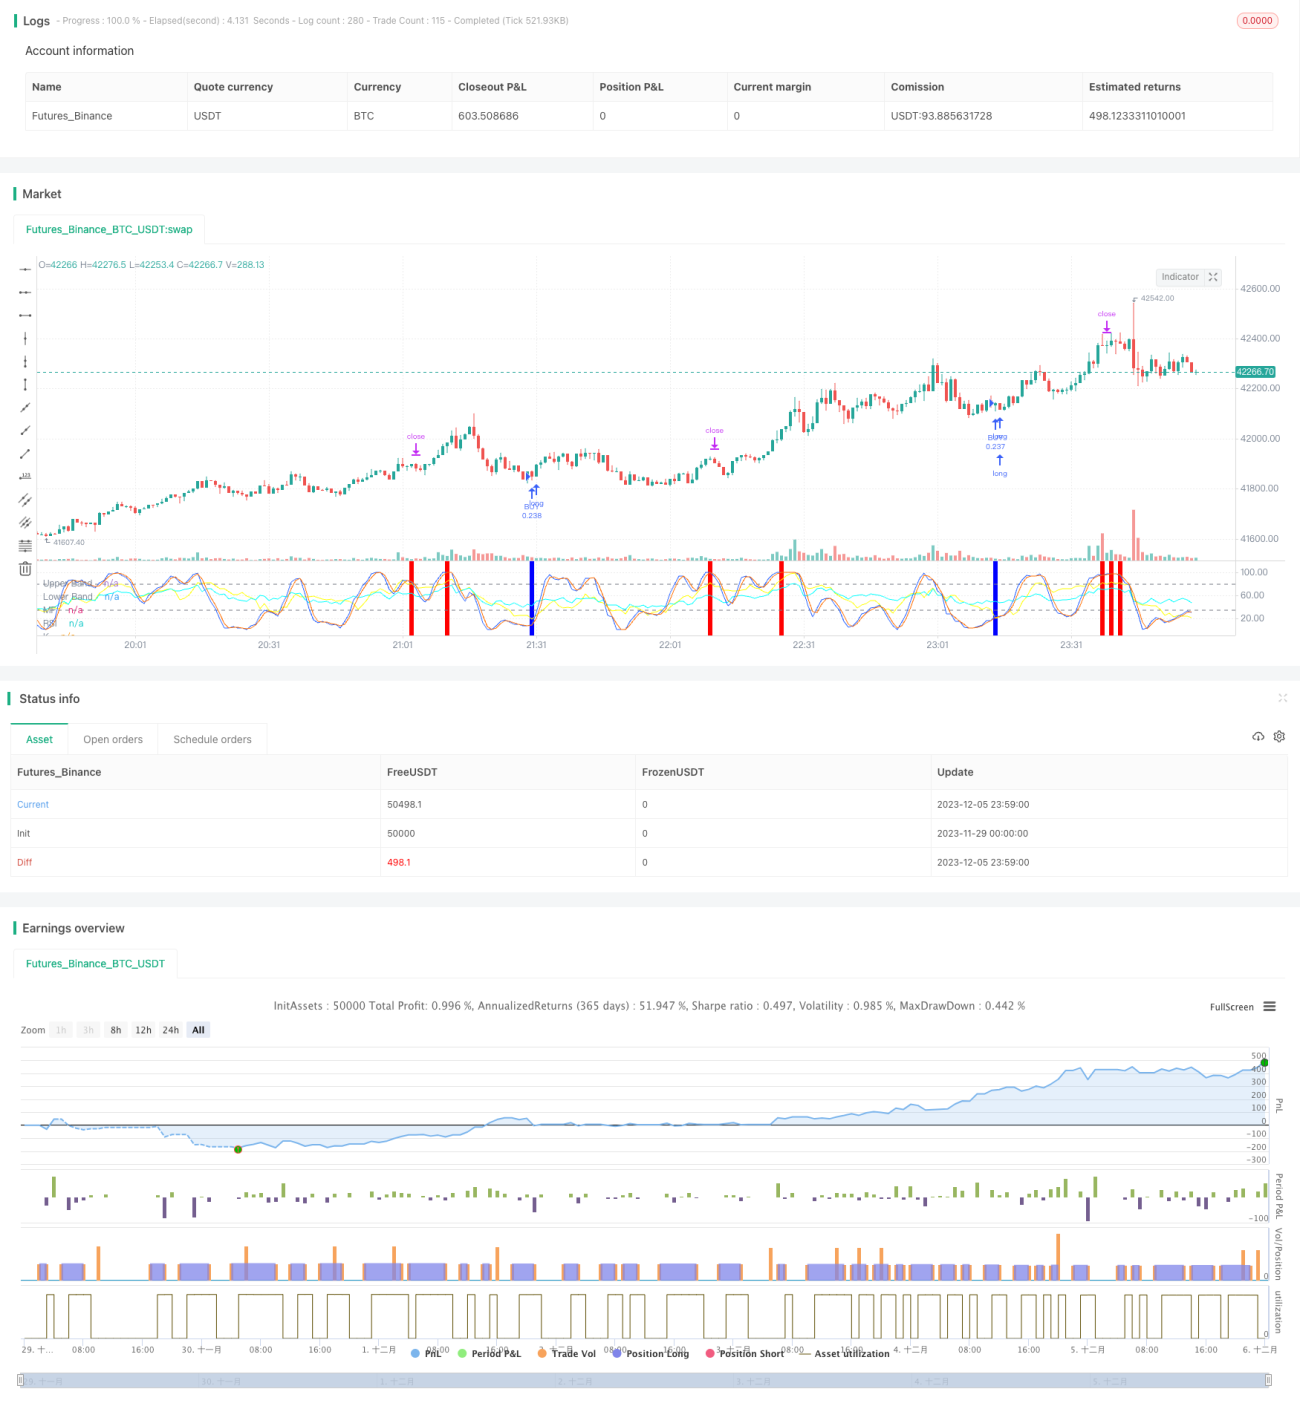
Die Strategie kombiniert vier Indikatoren RSI, MFI, Stoch RSI und MACD, um den Tageshandel mit Bitcoin zu ermöglichen. Die Strategie wird nur dann angeordnet, wenn mehrere Indikatoren gleichzeitig ein Kauf- oder Verkaufssignal senden, um das Risiko zu kontrollieren.
Strategieprinzip
-
Der RSI-Indikator wird verwendet, um zu bestimmen, ob ein Markt überkauft oder überverkauft ist. Wenn der RSI unter 40 liegt, erzeugt er ein Kaufsignal, wenn er über 70 ist, erzeugt er ein Verkaufssignal.
-
Der MFI-Indikator beurteilt die Geldflüsse des Marktes. MFI erzeugt ein Kaufsignal, wenn es unter 23 liegt, und ein Verkaufsignal, wenn es über 80 liegt.
-
Der Stoch RSI beurteilt, ob der Markt überkauft oder überverkauft ist. Die K-Linie erzeugt ein Kaufsignal, wenn sie unter 34 liegt, und ein Verkaufssignal, wenn sie über 80 liegt.
-
Der MACD-Indikator beurteilt die Markttrends und -dynamik. Die Schnelllinie erzeugt ein Kaufsignal, wenn sie unter der Schnelllinie liegt und die Säule negativ ist, und dagegen ein Verkaufssignal.
Analyse der Stärken
-
Die Kombination der vier Hauptindikatoren erhöht die Signalgenauigkeit und verhindert Verluste durch Fehlfunktionen eines einzelnen Indikators.
-
Die Wahrscheinlichkeit von Falschsignalen wird erheblich reduziert, wenn nur mehrere Indikatoren gleichzeitig signalisieren.
-
Die Einführung von Tagesgeschäften verhindert Übernachtungsrisiken und senkt die Kapitalkosten.
Risiken und Lösungen
-
Die Strategie kann mit geringer Frequenz und einem gewissen Zeitrisiko gehandelt werden. Die Parameter des Indikators können entsprechend gelockert werden, um die Anzahl der Geschäfte zu erhöhen.
-
Die Wahrscheinlichkeit, dass ein Indikator ein falsches Signal aussendet, bleibt bestehen. Machine Learning-Algorithmen können eingeführt werden, um die Zuverlässigkeit des Indikatorsignals zu beurteilen.
-
Es besteht ein gewisses Risiko von Überkauf und Überverkauf. Die Parameter des Indikators können entsprechend angepasst oder andere Indikatoren-Urteilslogiken hinzugefügt werden.
Optimierungsrichtung
-
Hinzugefügt wurde die Funktion zur Anpassung der Indikatorparameter. Die Indikatorparameter werden in Echtzeit entsprechend der Marktfluktuation und der Geschwindigkeit der Veränderung angepasst.
-
Ein zusätzliches Stop-Loss-Verfahren. Wenn der Verlust einen bestimmten Prozentsatz überschreitet, wird ein Stop-Loss-Exit eingeführt, um den Einzelschaden effektiv zu kontrollieren.
-
In Kombination mit Emotionsindikatoren erhöht die Markthitze, die Panik und andere mehrdimensionale Beurteilungen, die den strategischen Gewinnraum erhöhen.
Zusammenfassen
Diese Strategie sendet Signale aus, die durch die gegenseitige Bestätigung der vier Hauptindikatoren wirksam sind, um die Falschsignalrate zu reduzieren. Sie ist eine relativ stabile Hochfrequenz-Gewinnstrategie. Mit der ständigen Optimierung der Parameter und Modelle werden die Gewinnrate und die Gewinnfähigkeit der Strategie voraussichtlich weiter verbessert.
/*backtest
start: 2023-11-29 00:00:00
end: 2023-12-06 00:00:00
period: 1m
basePeriod: 1m
exchanges: [{"eid":"Futures_Binance","currency":"BTC_USDT"}]
*/


//@version=5
strategy('John Day Stop Loss', overlay=false, pyramiding=1, default_qty_type=strategy.cash, default_qty_value=10000, initial_capital=10000, currency='USD', precision=2)
strategy.risk.allow_entry_in(strategy.direction.long) - 1